
|
|||||
|
 | |
| |
| |
| |
| |
| |
|
Gene: SRSF6 |
Gene summary for SRSF6 |
| Gene information | Species | Human | Gene symbol | SRSF6 | Gene ID | 6431 |
| Gene name | serine and arginine rich splicing factor 6 | |
| Gene Alias | B52 | |
| Cytomap | 20q13.11 | |
| Gene Type | protein-coding | GO ID | GO:0000245 | UniProtAcc | Q13247 |
Top |
Malignant transformation analysis |
| Identification of the aberrant gene expression in precancerous and cancerous lesions by comparing the gene expression of stem-like cells in diseased tissues with normal stem cells |
| Entrez ID | Symbol | Replicates | Species | Organ | Tissue | Adj P-value | Log2FC | Malignancy |
| 6431 | SRSF6 | HTA11_1938_2000001011 | Human | Colorectum | AD | 5.23e-04 | 4.74e-01 | -0.0811 |
| 6431 | SRSF6 | HTA11_78_2000001011 | Human | Colorectum | AD | 1.13e-06 | 5.09e-01 | -0.1088 |
| 6431 | SRSF6 | HTA11_347_2000001011 | Human | Colorectum | AD | 9.86e-13 | 5.12e-01 | -0.1954 |
| 6431 | SRSF6 | HTA11_99999971662_82457 | Human | Colorectum | MSS | 1.15e-10 | 6.15e-01 | 0.3859 |
| 6431 | SRSF6 | A015-C-203 | Human | Colorectum | FAP | 7.67e-05 | 1.01e-01 | -0.1294 |
| 6431 | SRSF6 | A002-C-021 | Human | Colorectum | FAP | 3.59e-02 | 1.97e-01 | 0.1171 |
| 6431 | SRSF6 | A002-C-205 | Human | Colorectum | FAP | 1.05e-03 | 4.12e-02 | -0.1236 |
| 6431 | SRSF6 | A015-C-104 | Human | Colorectum | FAP | 2.03e-07 | 1.55e-01 | -0.1899 |
| 6431 | SRSF6 | A002-C-016 | Human | Colorectum | FAP | 7.71e-04 | -8.37e-02 | 0.0521 |
| 6431 | SRSF6 | A002-C-116 | Human | Colorectum | FAP | 6.74e-05 | -9.40e-02 | -0.0452 |
| 6431 | SRSF6 | A018-E-020 | Human | Colorectum | FAP | 6.90e-05 | 2.17e-01 | -0.2034 |
| 6431 | SRSF6 | F034 | Human | Colorectum | FAP | 1.82e-03 | 2.22e-02 | -0.0665 |
| 6431 | SRSF6 | AEH-subject1 | Human | Endometrium | AEH | 1.08e-02 | -2.40e-01 | -0.3059 |
| 6431 | SRSF6 | AEH-subject2 | Human | Endometrium | AEH | 5.19e-09 | -2.47e-01 | -0.2525 |
| 6431 | SRSF6 | AEH-subject3 | Human | Endometrium | AEH | 6.69e-09 | -2.62e-01 | -0.2576 |
| 6431 | SRSF6 | AEH-subject4 | Human | Endometrium | AEH | 2.52e-06 | -2.93e-01 | -0.2657 |
| 6431 | SRSF6 | AEH-subject5 | Human | Endometrium | AEH | 3.21e-08 | -3.39e-01 | -0.2953 |
| 6431 | SRSF6 | EEC-subject1 | Human | Endometrium | EEC | 2.61e-12 | -3.17e-01 | -0.2682 |
| 6431 | SRSF6 | EEC-subject2 | Human | Endometrium | EEC | 1.70e-05 | -2.48e-01 | -0.2607 |
| 6431 | SRSF6 | EEC-subject3 | Human | Endometrium | EEC | 5.10e-26 | -4.40e-01 | -0.2525 |
| Page: 1 2 3 4 5 6 7 8 9 |
| Tissue | Expression Dynamics | Abbreviation |
| Colorectum (GSE201348) |  | FAP: Familial adenomatous polyposis |
| CRC: Colorectal cancer | ||
| Colorectum (HTA11) | 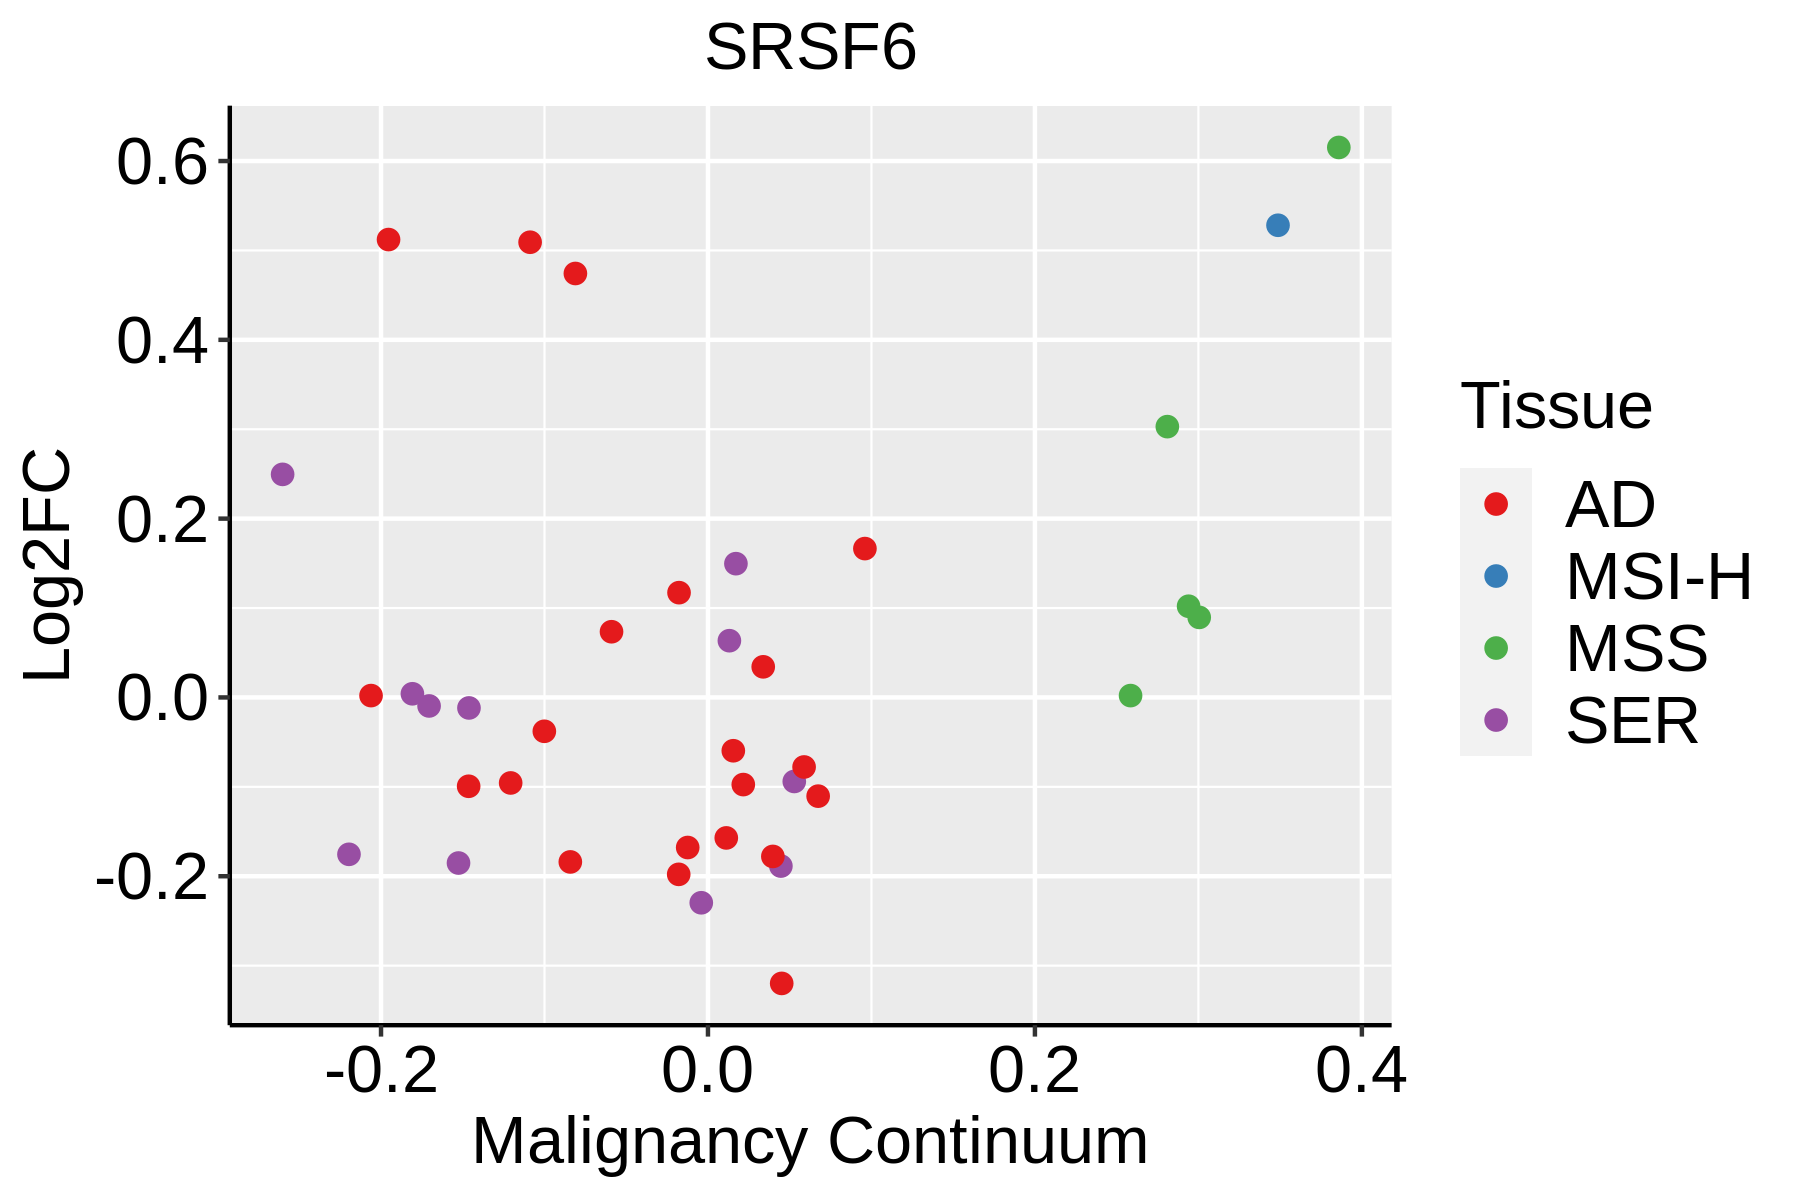 | AD: Adenomas |
| SER: Sessile serrated lesions | ||
| MSI-H: Microsatellite-high colorectal cancer | ||
| MSS: Microsatellite stable colorectal cancer | ||
| Endometrium | 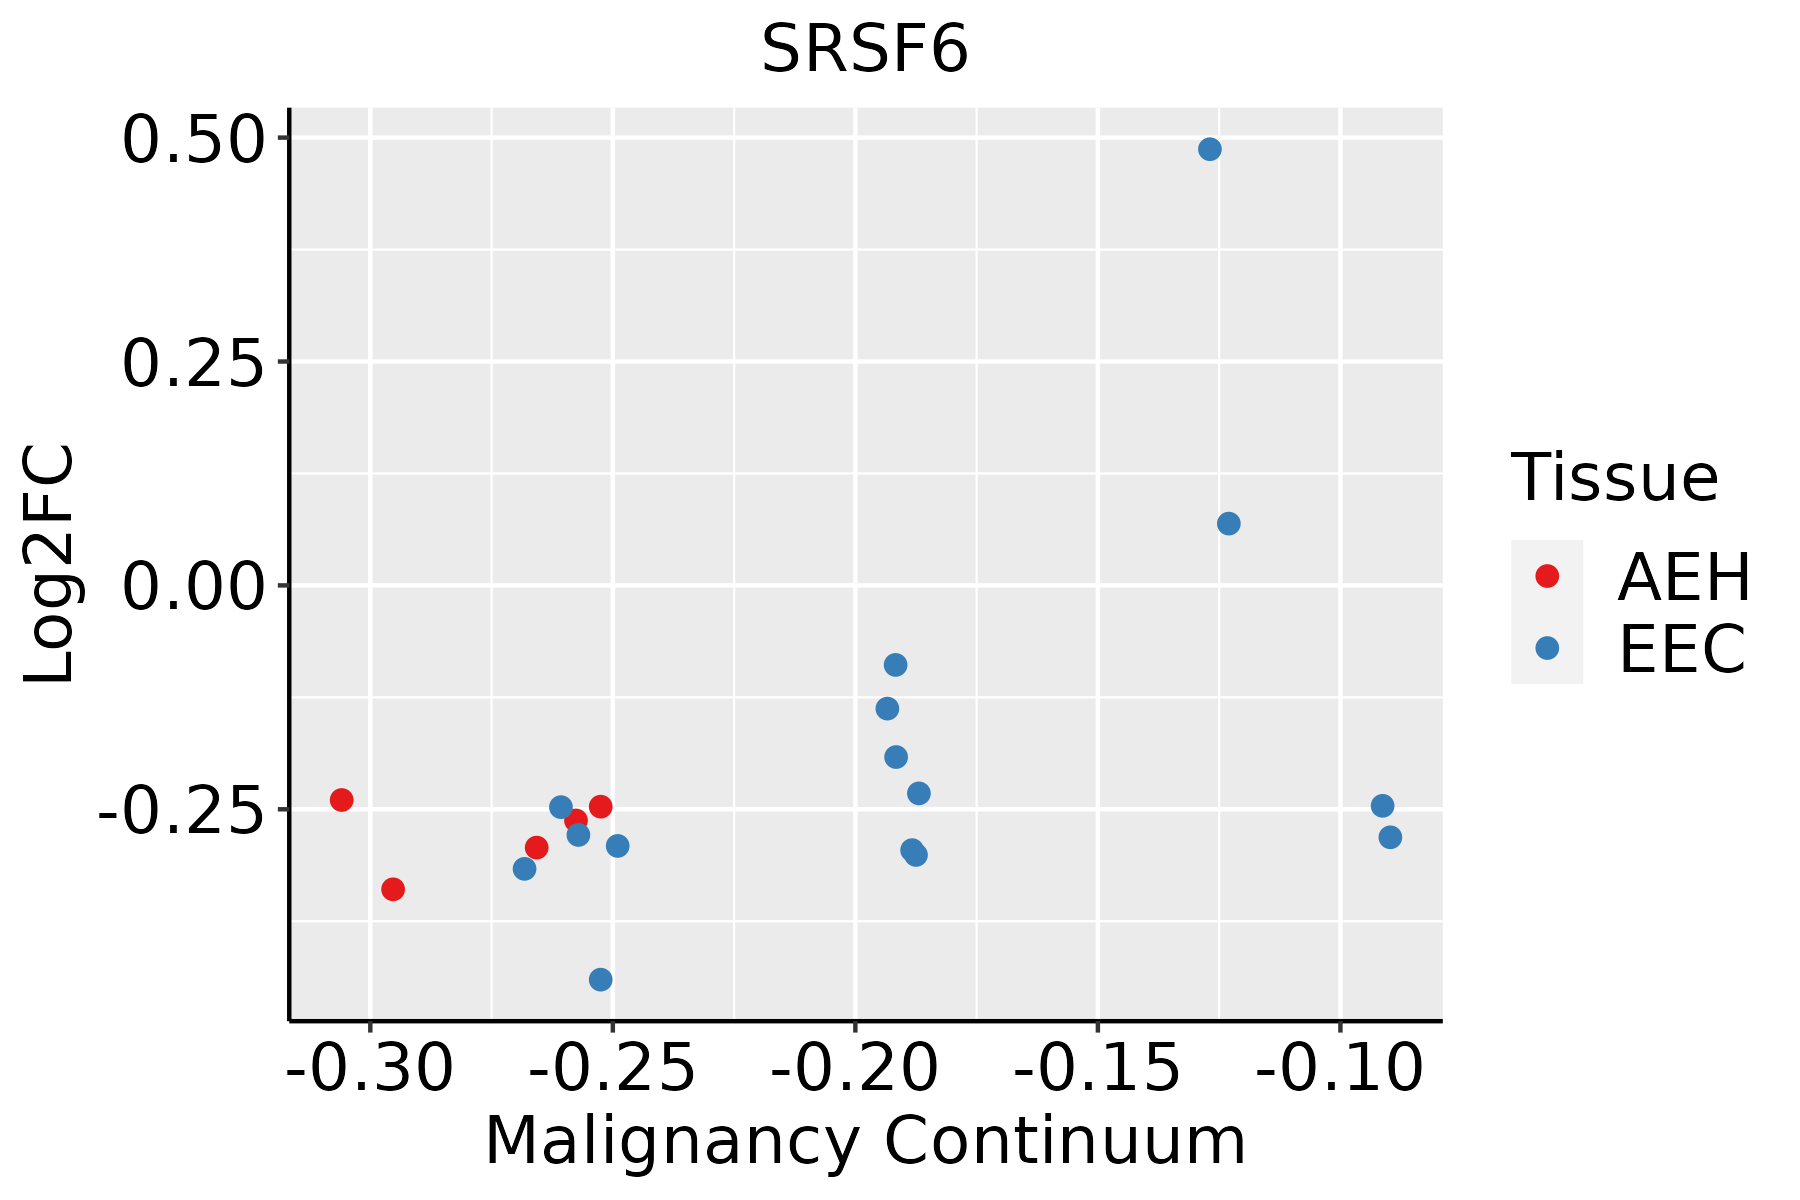 | AEH: Atypical endometrial hyperplasia |
| EEC: Endometrioid Cancer | ||
| Esophagus | 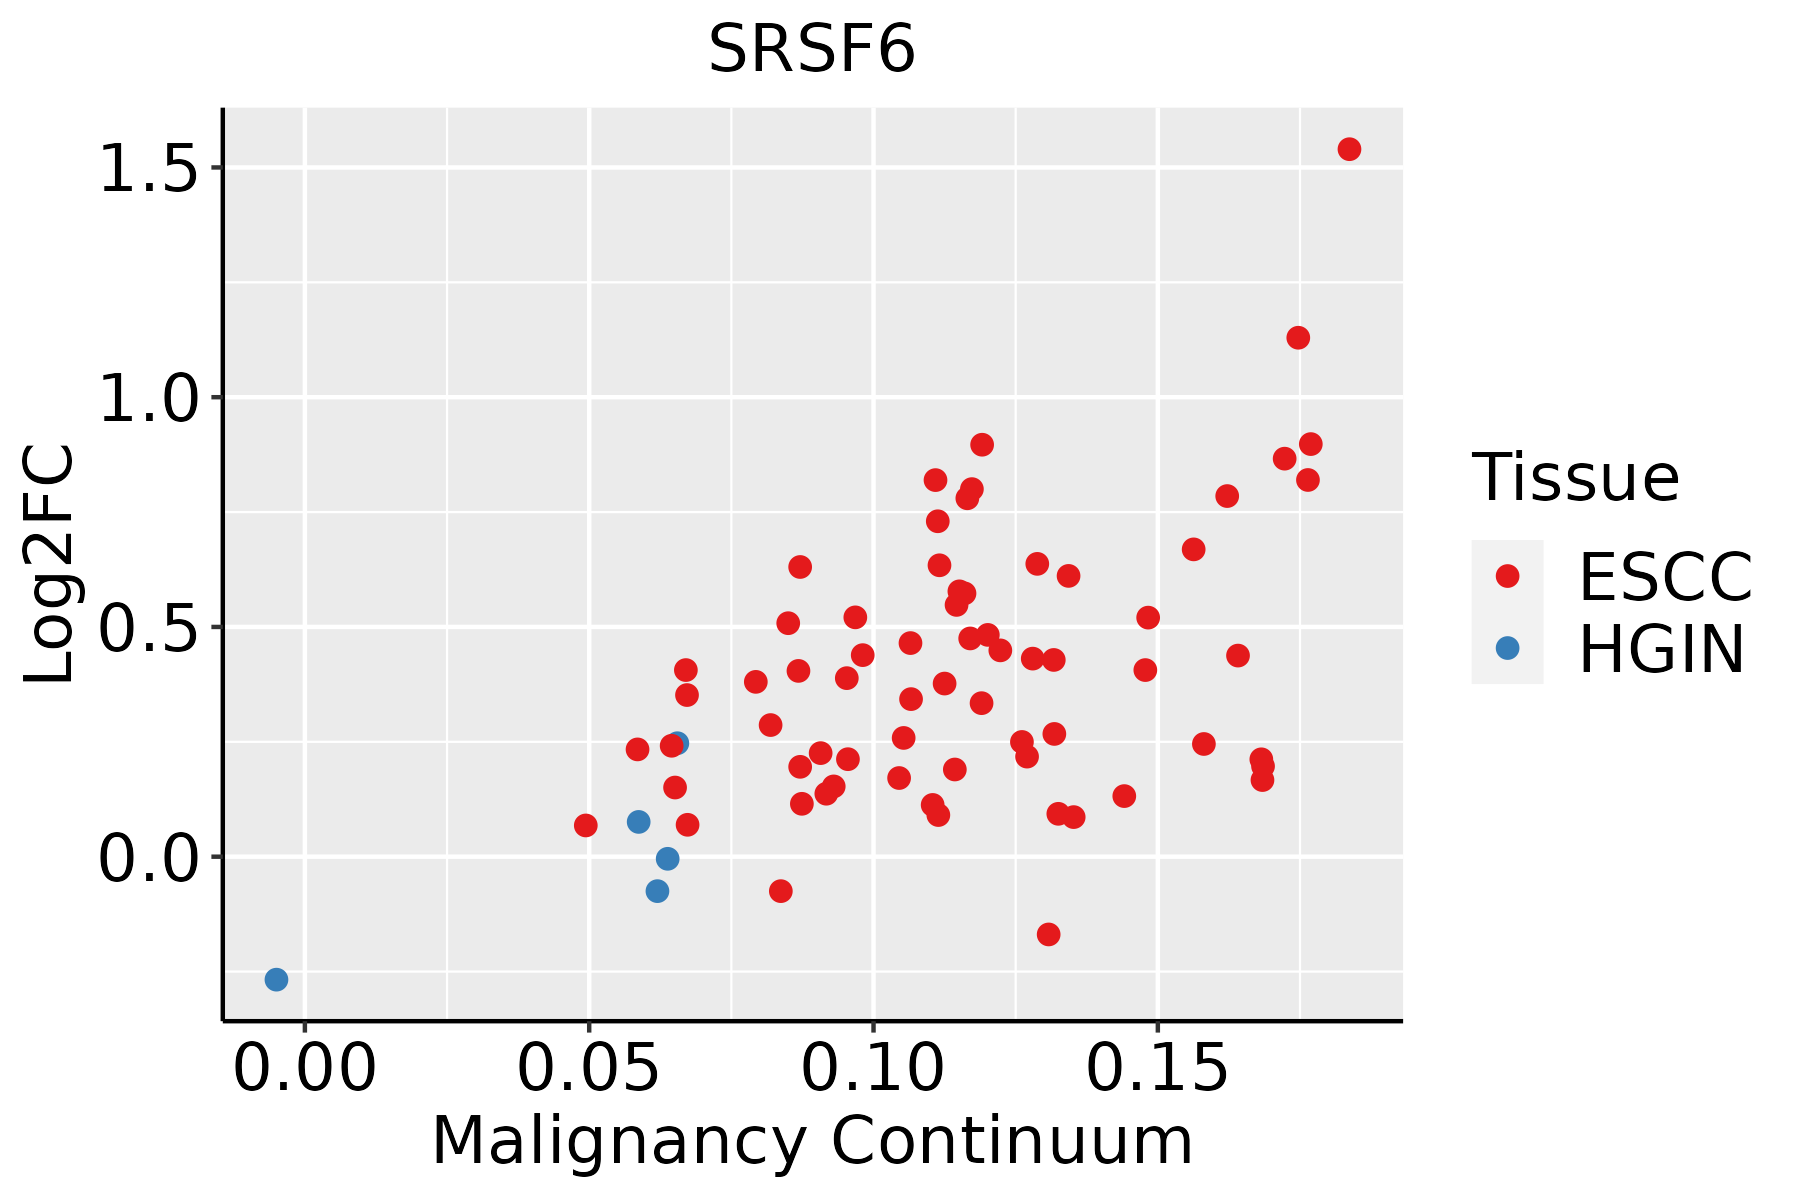 | ESCC: Esophageal squamous cell carcinoma |
| HGIN: High-grade intraepithelial neoplasias | ||
| LGIN: Low-grade intraepithelial neoplasias | ||
| Liver | 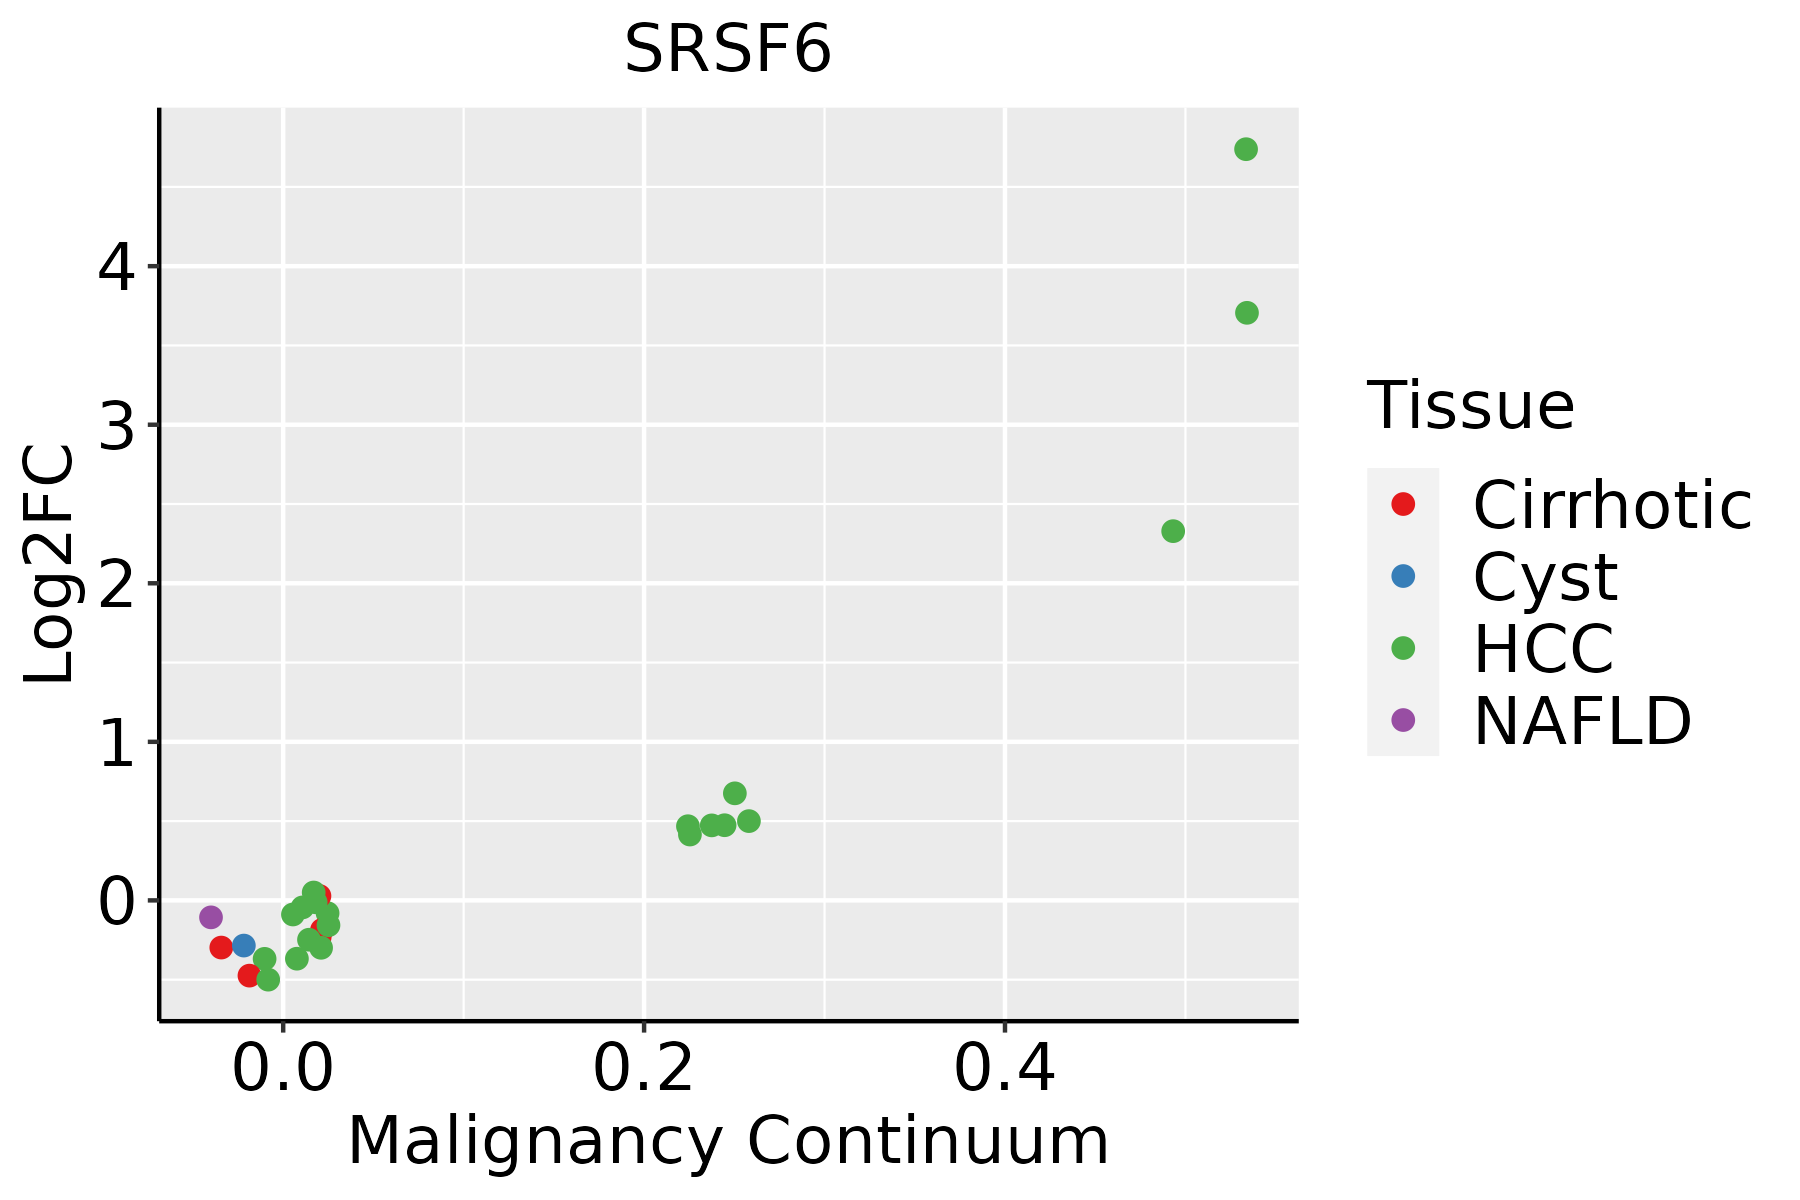 | HCC: Hepatocellular carcinoma |
| NAFLD: Non-alcoholic fatty liver disease | ||
| Oral Cavity | 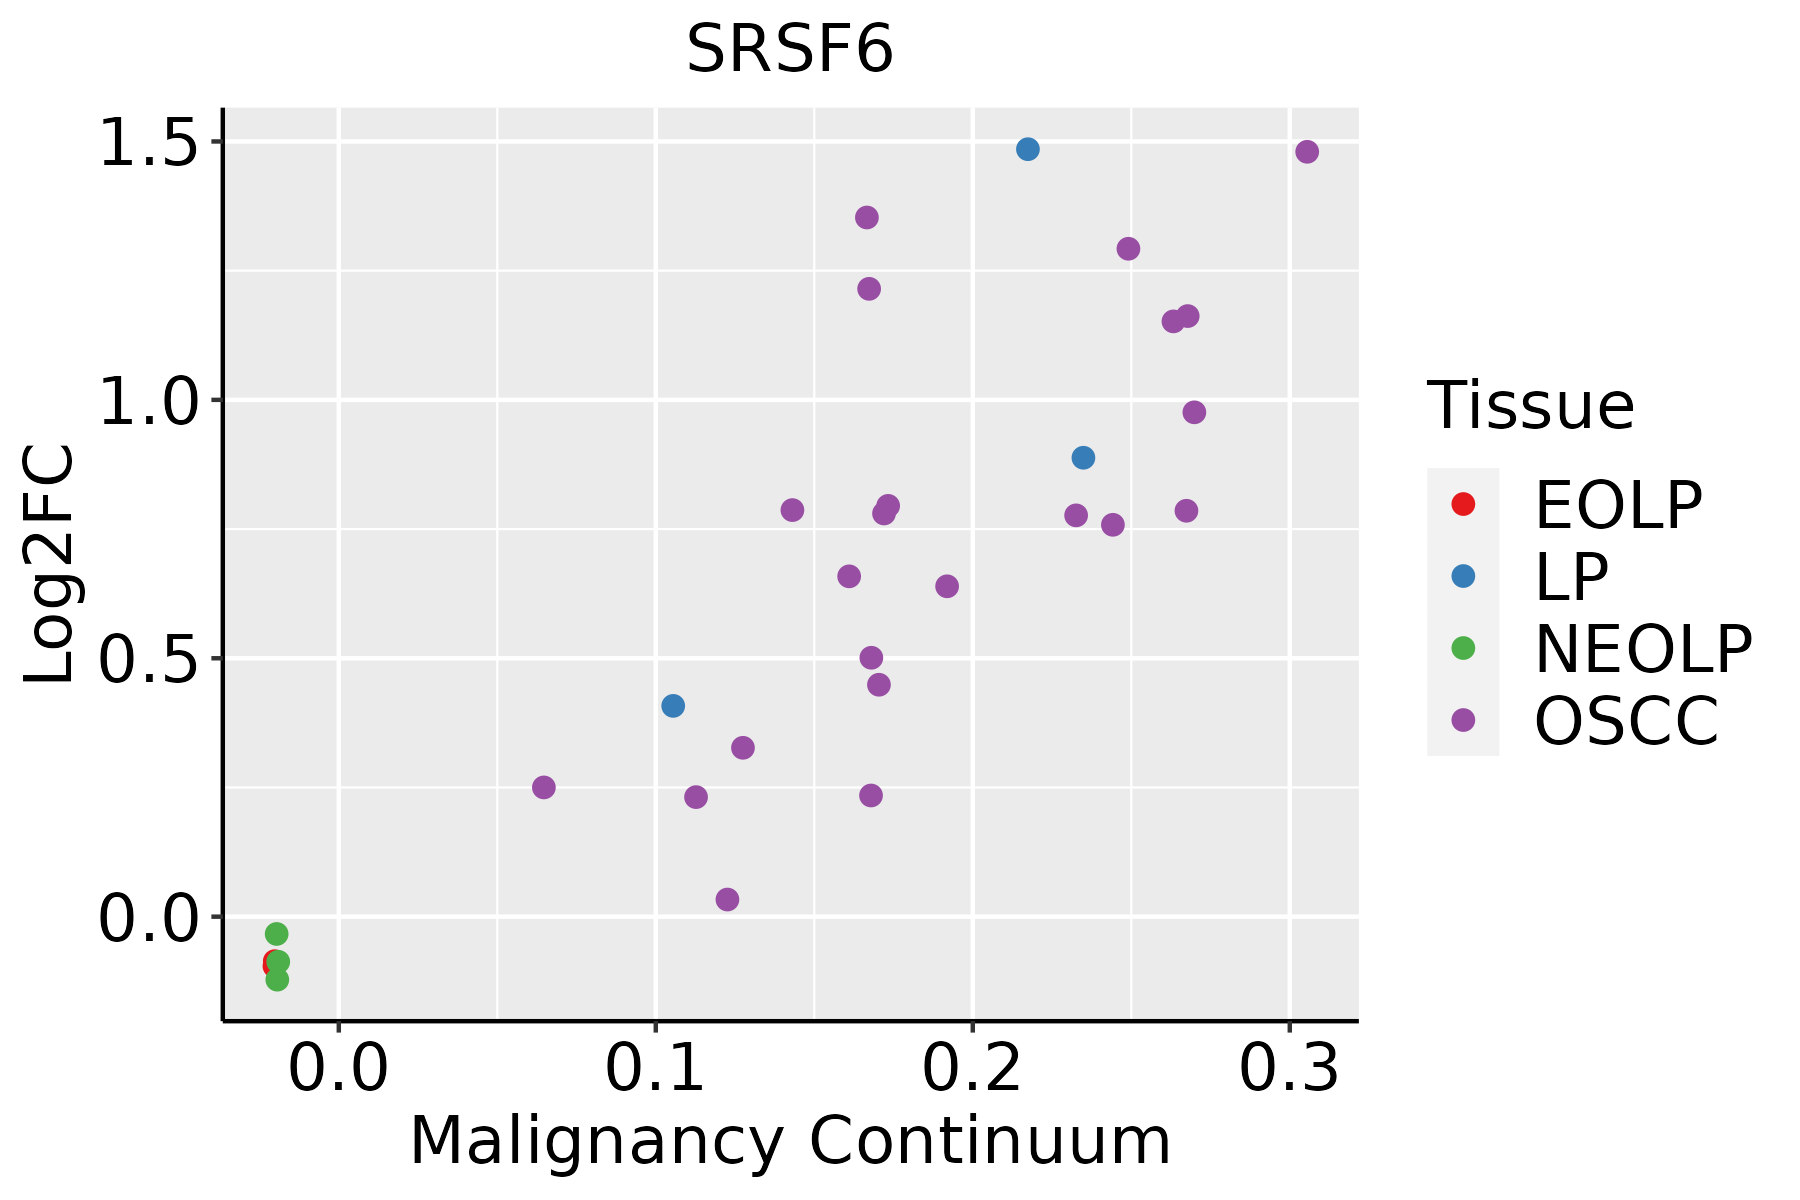 | EOLP: Erosive Oral lichen planus |
| LP: leukoplakia | ||
| NEOLP: Non-erosive oral lichen planus | ||
| OSCC: Oral squamous cell carcinoma | ||
| Prostate | 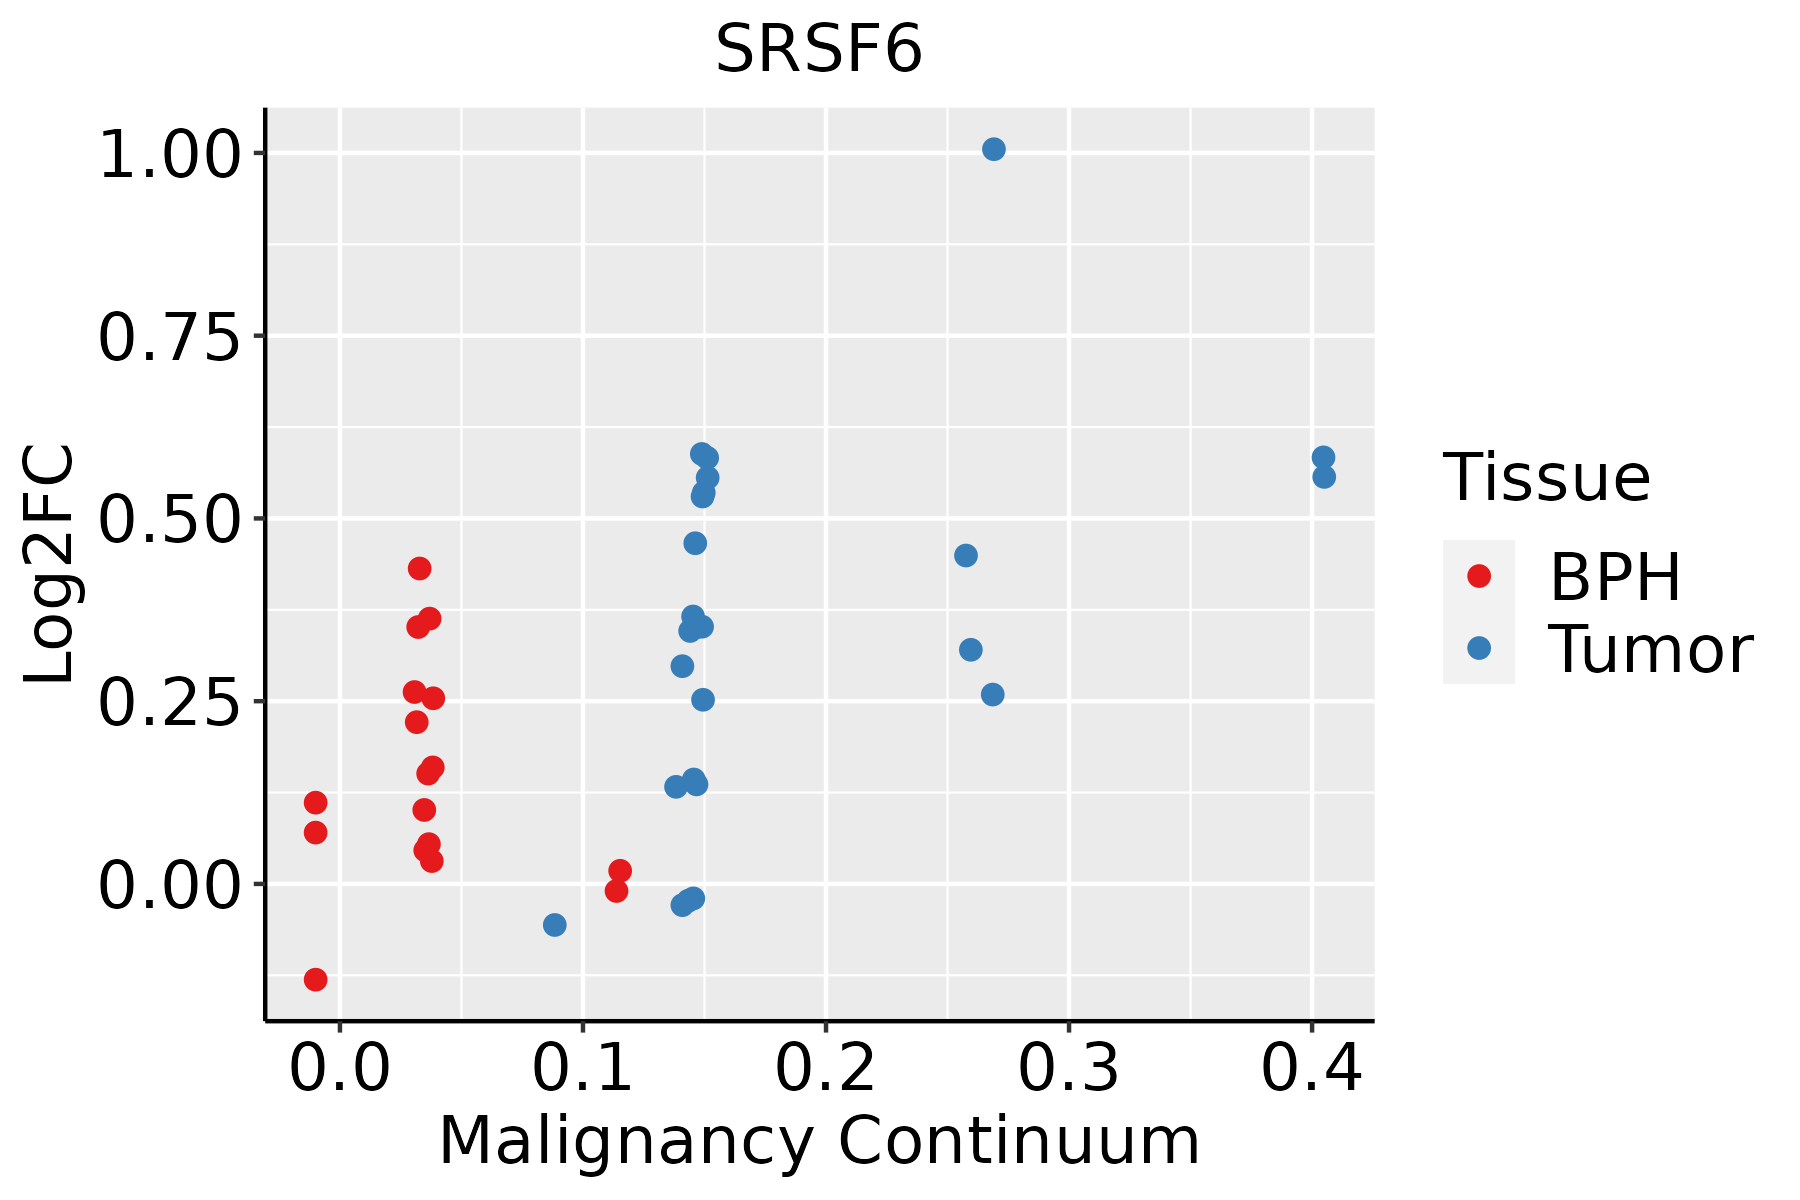 | BPH: Benign Prostatic Hyperplasia |
| Skin | 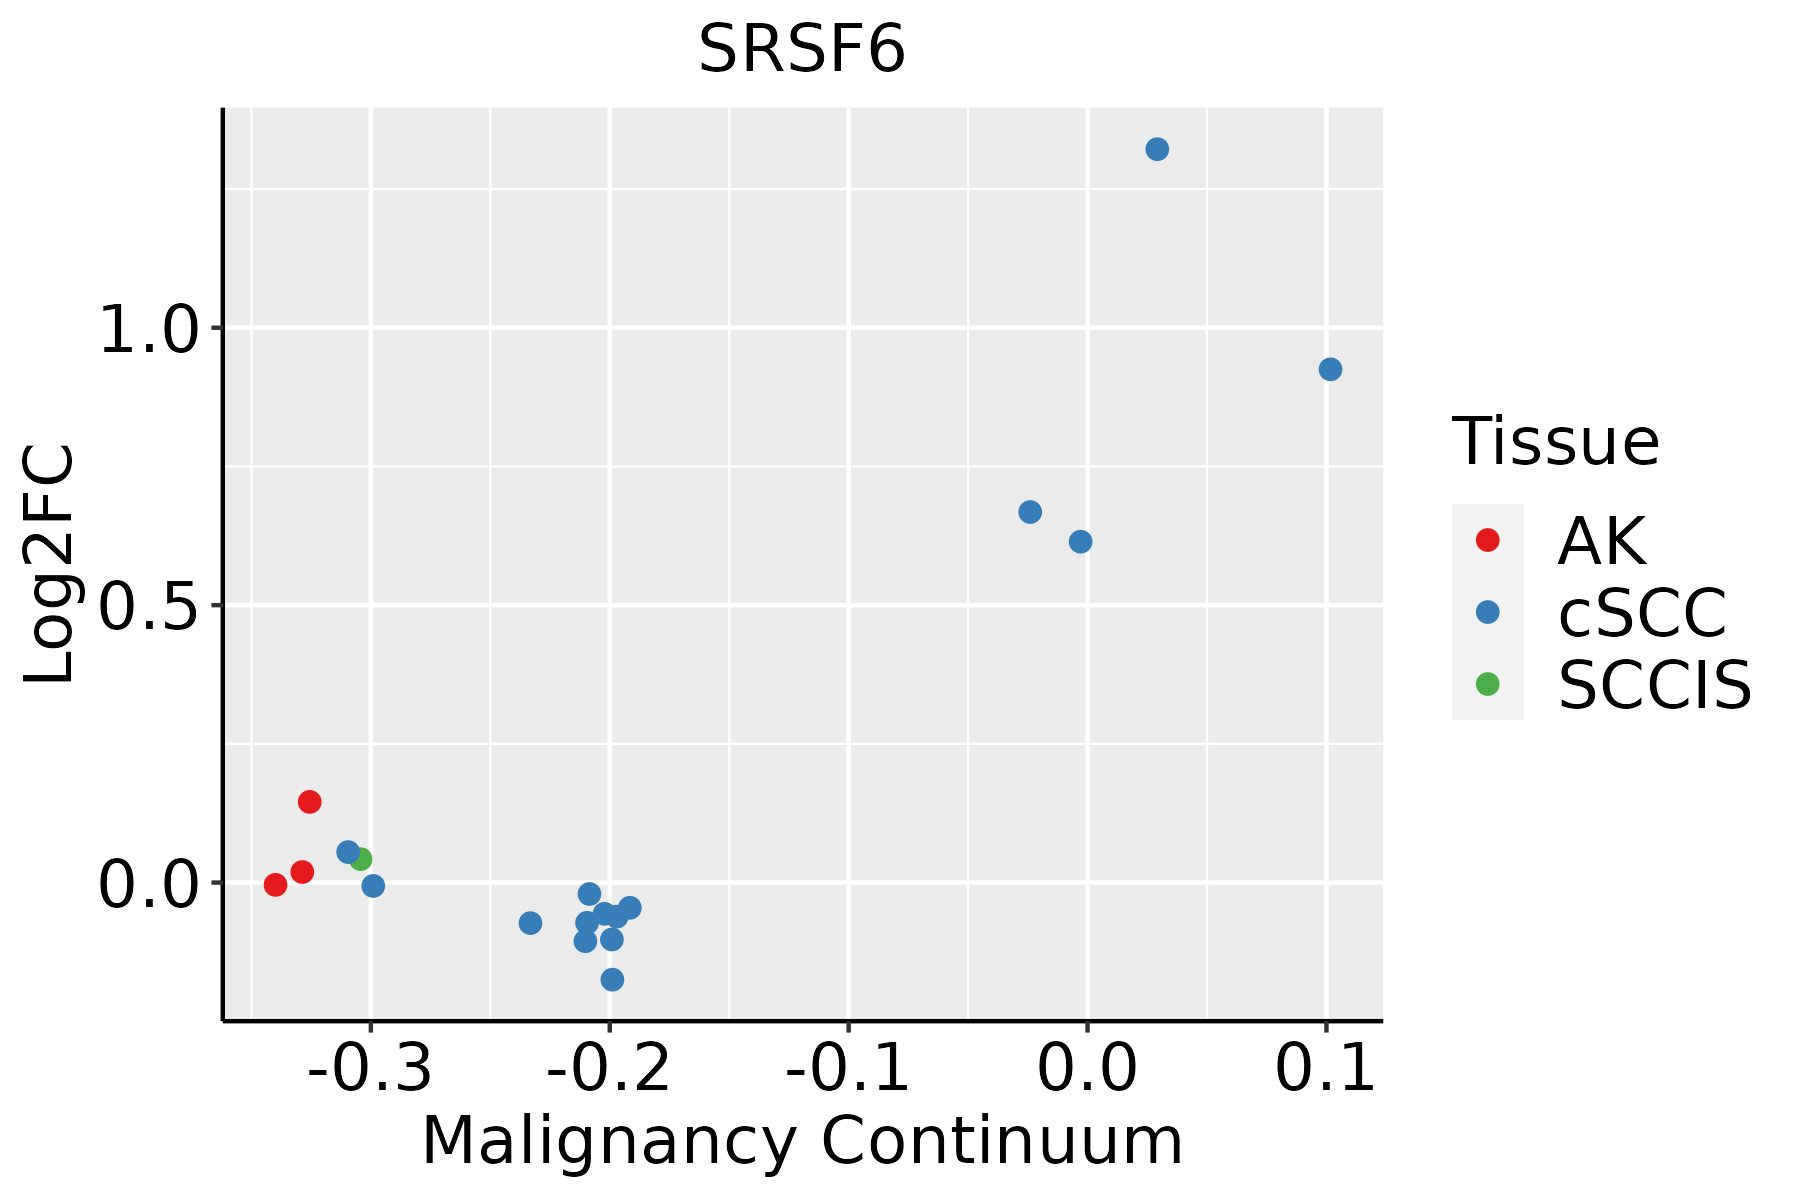 | AK: Actinic keratosis |
| cSCC: Cutaneous squamous cell carcinoma | ||
| SCCIS:squamous cell carcinoma in situ | ||
| Thyroid | 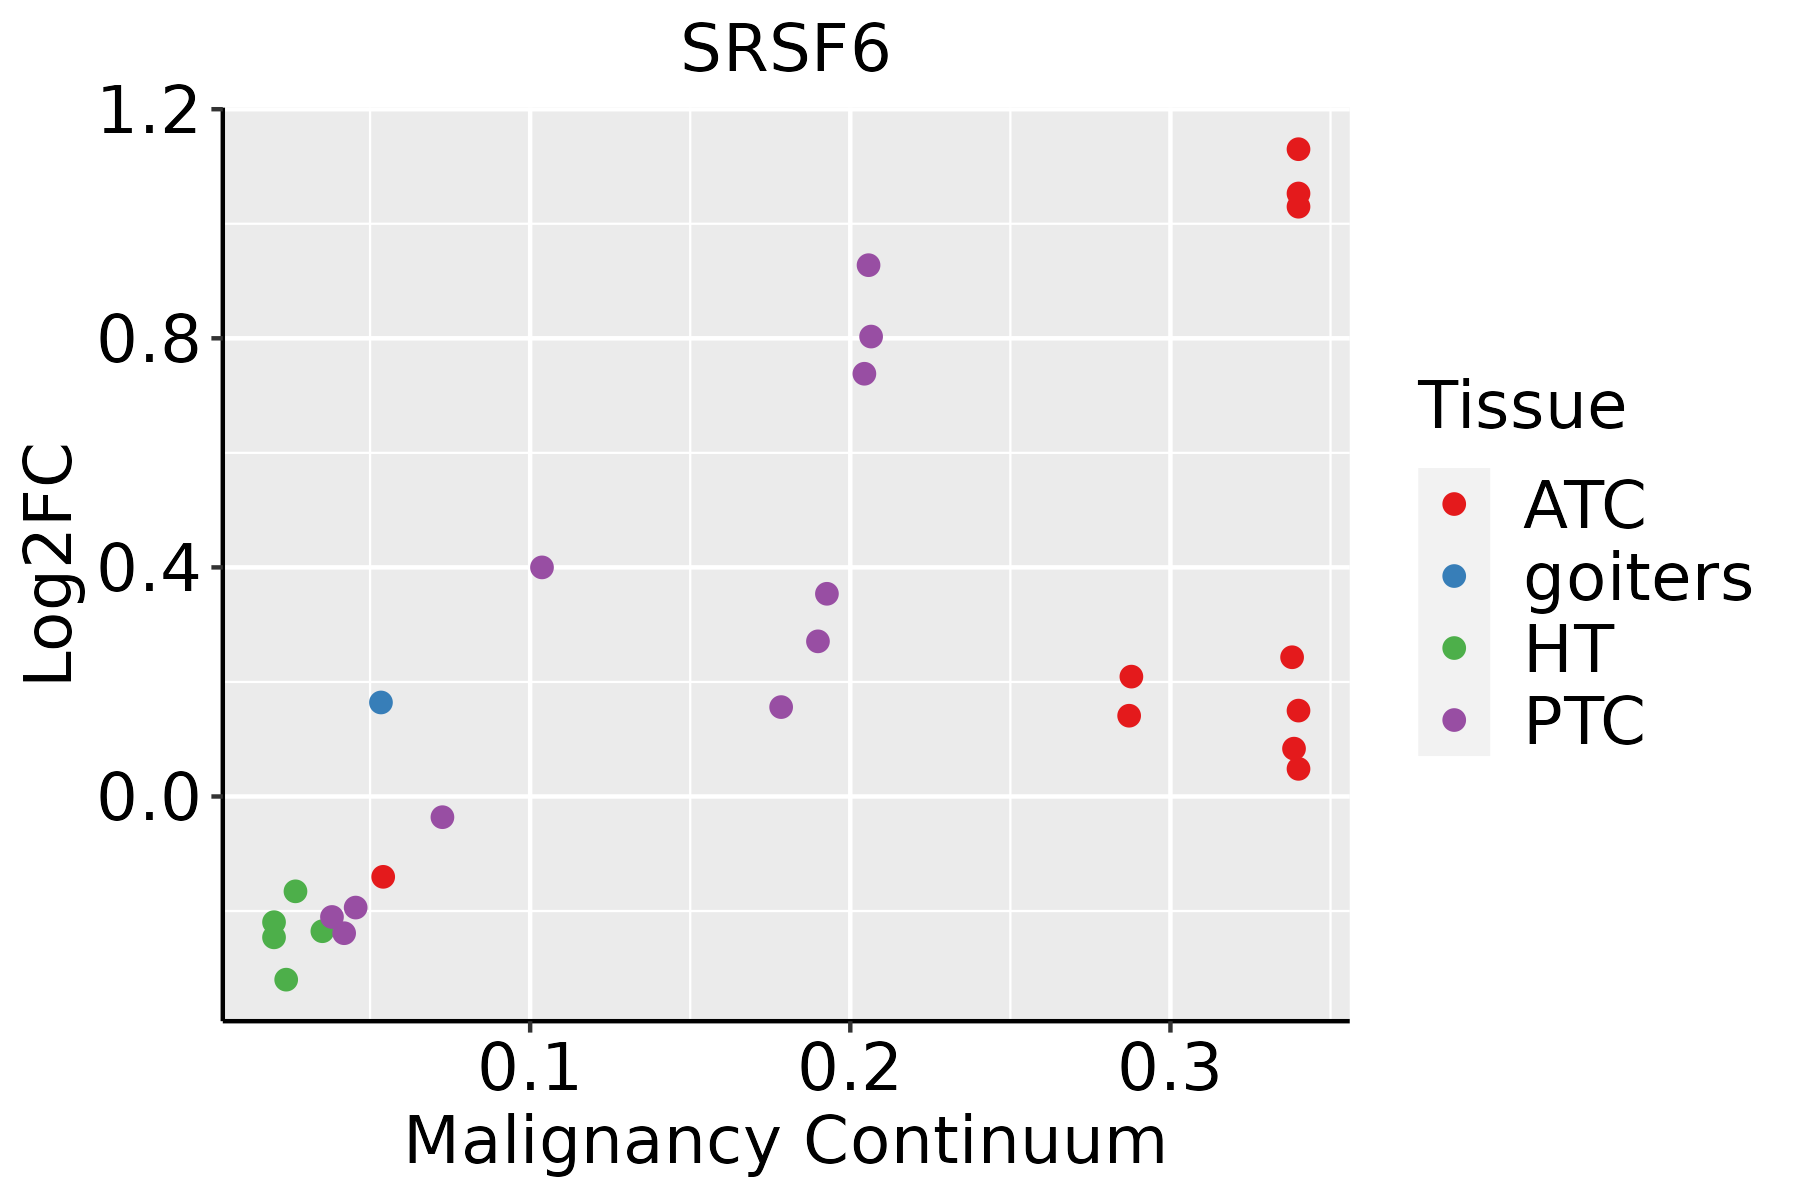 | ATC: Anaplastic thyroid cancer |
| HT: Hashimoto's thyroiditis | ||
| PTC: Papillary thyroid cancer |
| ∗log2FC in expression of this searched gene in stem-like cells from each diseased tissue sample relative to stem-like cells in normal samples in each tissue plotted against the malignancy continuum. Samples are colored based on if they are from different disease stage. |
Top |
Malignant transformation related pathway analysis |
| Find out the enriched GO biological processes and KEGG pathways involved in transition from healthy to precancer to cancer |
| Tissue | Disease Stage | Enriched GO biological Processes |
| Colorectum | AD |  |
| Colorectum | SER |  |
| Colorectum | MSS |  |
| Colorectum | MSI-H |  |
| Colorectum | FAP |  |
| ∗Top 15 enriched GO BP terms are showed in the bar plot of each disease state in each tissue. Each row represents a significant GO biological process which is colored according to the -log10(p.adjust). |
| Page: 1 2 3 4 5 6 7 8 9 |
| GO ID | Tissue | Disease Stage | Description | Gene Ratio | Bg Ratio | pvalue | p.adjust | Count |
| GO:0008380 | Colorectum | AD | RNA splicing | 169/3918 | 434/18723 | 3.59e-18 | 2.04e-15 | 169 |
| GO:0000377 | Colorectum | AD | RNA splicing, via transesterification reactions with bulged adenosine as nucleophile | 130/3918 | 320/18723 | 5.88e-16 | 2.16e-13 | 130 |
| GO:0000398 | Colorectum | AD | mRNA splicing, via spliceosome | 130/3918 | 320/18723 | 5.88e-16 | 2.16e-13 | 130 |
| GO:0000375 | Colorectum | AD | RNA splicing, via transesterification reactions | 131/3918 | 324/18723 | 7.11e-16 | 2.22e-13 | 131 |
| GO:1903311 | Colorectum | AD | regulation of mRNA metabolic process | 117/3918 | 288/18723 | 1.69e-14 | 4.23e-12 | 117 |
| GO:0043484 | Colorectum | AD | regulation of RNA splicing | 70/3918 | 148/18723 | 6.47e-13 | 1.16e-10 | 70 |
| GO:0022618 | Colorectum | AD | ribonucleoprotein complex assembly | 92/3918 | 220/18723 | 1.49e-12 | 2.60e-10 | 92 |
| GO:0071826 | Colorectum | AD | ribonucleoprotein complex subunit organization | 94/3918 | 227/18723 | 1.70e-12 | 2.87e-10 | 94 |
| GO:0048024 | Colorectum | AD | regulation of mRNA splicing, via spliceosome | 50/3918 | 101/18723 | 1.62e-10 | 1.56e-08 | 50 |
| GO:0050684 | Colorectum | AD | regulation of mRNA processing | 61/3918 | 137/18723 | 4.23e-10 | 3.58e-08 | 61 |
| GO:0022613 | Colorectum | AD | ribonucleoprotein complex biogenesis | 151/3918 | 463/18723 | 1.96e-09 | 1.39e-07 | 151 |
| GO:0032868 | Colorectum | AD | response to insulin | 91/3918 | 264/18723 | 2.02e-07 | 8.48e-06 | 91 |
| GO:0043434 | Colorectum | AD | response to peptide hormone | 126/3918 | 414/18723 | 2.70e-06 | 7.86e-05 | 126 |
| GO:0042060 | Colorectum | AD | wound healing | 128/3918 | 422/18723 | 2.73e-06 | 7.89e-05 | 128 |
| GO:0000380 | Colorectum | AD | alternative mRNA splicing, via spliceosome | 33/3918 | 77/18723 | 1.13e-05 | 2.55e-04 | 33 |
| GO:1903312 | Colorectum | AD | negative regulation of mRNA metabolic process | 37/3918 | 92/18723 | 1.95e-05 | 4.01e-04 | 37 |
| GO:0000245 | Colorectum | AD | spliceosomal complex assembly | 33/3918 | 79/18723 | 2.15e-05 | 4.33e-04 | 33 |
| GO:0033119 | Colorectum | AD | negative regulation of RNA splicing | 15/3918 | 25/18723 | 2.37e-05 | 4.62e-04 | 15 |
| GO:0000381 | Colorectum | AD | regulation of alternative mRNA splicing, via spliceosome | 27/3918 | 60/18723 | 2.41e-05 | 4.66e-04 | 27 |
| GO:0050673 | Colorectum | AD | epithelial cell proliferation | 119/3918 | 437/18723 | 8.75e-04 | 8.51e-03 | 119 |
| Page: 1 2 3 4 5 6 7 8 9 10 11 12 13 14 15 16 17 18 19 20 21 22 23 24 25 26 |
| Pathway ID | Tissue | Disease Stage | Description | Gene Ratio | Bg Ratio | pvalue | p.adjust | qvalue | Count |
| hsa03040 | Colorectum | AD | Spliceosome | 73/2092 | 217/8465 | 1.73e-03 | 9.68e-03 | 6.18e-03 | 73 |
| hsa030401 | Colorectum | AD | Spliceosome | 73/2092 | 217/8465 | 1.73e-03 | 9.68e-03 | 6.18e-03 | 73 |
| hsa030402 | Colorectum | MSS | Spliceosome | 66/1875 | 217/8465 | 2.58e-03 | 1.27e-02 | 7.81e-03 | 66 |
| hsa030403 | Colorectum | MSS | Spliceosome | 66/1875 | 217/8465 | 2.58e-03 | 1.27e-02 | 7.81e-03 | 66 |
| hsa030409 | Endometrium | AEH | Spliceosome | 54/1197 | 217/8465 | 1.47e-05 | 1.65e-04 | 1.21e-04 | 54 |
| hsa0304014 | Endometrium | AEH | Spliceosome | 54/1197 | 217/8465 | 1.47e-05 | 1.65e-04 | 1.21e-04 | 54 |
| hsa0304024 | Endometrium | EEC | Spliceosome | 54/1237 | 217/8465 | 3.78e-05 | 3.88e-04 | 2.89e-04 | 54 |
| hsa0304034 | Endometrium | EEC | Spliceosome | 54/1237 | 217/8465 | 3.78e-05 | 3.88e-04 | 2.89e-04 | 54 |
| hsa0304018 | Esophagus | HGIN | Spliceosome | 79/1383 | 217/8465 | 3.22e-13 | 7.00e-12 | 5.56e-12 | 79 |
| hsa0304019 | Esophagus | HGIN | Spliceosome | 79/1383 | 217/8465 | 3.22e-13 | 7.00e-12 | 5.56e-12 | 79 |
| hsa0304027 | Esophagus | ESCC | Spliceosome | 128/4205 | 217/8465 | 3.31e-03 | 8.79e-03 | 4.50e-03 | 128 |
| hsa0304037 | Esophagus | ESCC | Spliceosome | 128/4205 | 217/8465 | 3.31e-03 | 8.79e-03 | 4.50e-03 | 128 |
| hsa030407 | Liver | Cirrhotic | Spliceosome | 102/2530 | 217/8465 | 5.69e-08 | 9.47e-07 | 5.84e-07 | 102 |
| hsa0304012 | Liver | Cirrhotic | Spliceosome | 102/2530 | 217/8465 | 5.69e-08 | 9.47e-07 | 5.84e-07 | 102 |
| hsa0304022 | Liver | HCC | Spliceosome | 122/4020 | 217/8465 | 5.55e-03 | 1.60e-02 | 8.91e-03 | 122 |
| hsa0304032 | Liver | HCC | Spliceosome | 122/4020 | 217/8465 | 5.55e-03 | 1.60e-02 | 8.91e-03 | 122 |
| hsa0304016 | Oral cavity | OSCC | Spliceosome | 123/3704 | 217/8465 | 7.21e-05 | 2.74e-04 | 1.40e-04 | 123 |
| hsa0304017 | Oral cavity | OSCC | Spliceosome | 123/3704 | 217/8465 | 7.21e-05 | 2.74e-04 | 1.40e-04 | 123 |
| hsa0304026 | Oral cavity | LP | Spliceosome | 106/2418 | 217/8465 | 1.30e-10 | 2.40e-09 | 1.55e-09 | 106 |
| hsa0304036 | Oral cavity | LP | Spliceosome | 106/2418 | 217/8465 | 1.30e-10 | 2.40e-09 | 1.55e-09 | 106 |
| Page: 1 2 |
Top |
Cell-cell communication analysis |
| Identification of potential cell-cell interactions between two cell types and their ligand-receptor pairs for different disease states |
| Ligand | Receptor | LRpair | Pathway | Tissue | Disease Stage |
| Page: 1 |
Top |
Single-cell gene regulatory network inference analysis |
| Find out the significant the regulons (TFs) and the target genes of each regulon across cell types for different disease states |
| TF | Cell Type | Tissue | Disease Stage | Target Gene | RSS | Regulon Activity |
| ∗The dot plots of a searched regulon are shown for all cell subpopulations in each disease state of each tissue based on the regulon specific score inferred using pySCENIC and by calculating the average expression. |
| Page: 1 |
Top |
Somatic mutation of malignant transformation related genes |
| Annotation of somatic variants for genes involved in malignant transformation |
| Hugo Symbol | Variant Class | Variant Classification | dbSNP RS | HGVSc | HGVSp | HGVSp Short | SWISSPROT | BIOTYPE | SIFT | PolyPhen | Tumor Sample Barcode | Tissue | Histology | Sex | Age | Stage | Therapy Types | Drugs | Outcome |
| SRSF6 | SNV | Missense_Mutation | rs760768897 | c.962N>C | p.Arg321Thr | p.R321T | Q13247 | protein_coding | tolerated_low_confidence(0.12) | benign(0.156) | TCGA-BH-A0B6-01 | Breast | breast invasive carcinoma | Female | <65 | I/II | Unknown | Unknown | SD |
| SRSF6 | SNV | Missense_Mutation | c.88N>A | p.Glu30Lys | p.E30K | Q13247 | protein_coding | deleterious(0.01) | possibly_damaging(0.782) | TCGA-EK-A3GK-01 | Cervix | cervical & endocervical cancer | Female | <65 | I/II | Unknown | Unknown | SD | |
| SRSF6 | SNV | Missense_Mutation | novel | c.967N>C | p.Thr323Pro | p.T323P | Q13247 | protein_coding | tolerated_low_confidence(0.06) | benign(0.003) | TCGA-VS-A8EJ-01 | Cervix | cervical & endocervical cancer | Female | <65 | I/II | Chemotherapy | cisplatin | PD |
| SRSF6 | SNV | Missense_Mutation | rs773175595 | c.908C>T | p.Ser303Leu | p.S303L | Q13247 | protein_coding | deleterious_low_confidence(0) | benign(0.001) | TCGA-AA-A00N-01 | Colorectum | colon adenocarcinoma | Male | >=65 | I/II | Unknown | Unknown | PD |
| SRSF6 | SNV | Missense_Mutation | c.566G>A | p.Arg189Gln | p.R189Q | Q13247 | protein_coding | deleterious(0.05) | probably_damaging(0.978) | TCGA-AA-A010-01 | Colorectum | colon adenocarcinoma | Female | <65 | I/II | Chemotherapy | folinic | CR | |
| SRSF6 | SNV | Missense_Mutation | rs777495508 | c.992N>A | p.Arg331His | p.R331H | Q13247 | protein_coding | tolerated_low_confidence(0.06) | benign(0.001) | TCGA-AD-A5EJ-01 | Colorectum | colon adenocarcinoma | Female | >=65 | I/II | Unknown | Unknown | SD |
| SRSF6 | SNV | Missense_Mutation | rs773175595 | c.908N>T | p.Ser303Leu | p.S303L | Q13247 | protein_coding | deleterious_low_confidence(0) | benign(0.001) | TCGA-CA-6717-01 | Colorectum | colon adenocarcinoma | Male | <65 | I/II | Chemotherapy | oxaliplatin | CR |
| SRSF6 | insertion | Frame_Shift_Ins | novel | c.932dupA | p.Ala312GlyfsTer18 | p.A312Gfs*18 | Q13247 | protein_coding | TCGA-AA-3866-01 | Colorectum | colon adenocarcinoma | Female | >=65 | I/II | Unknown | Unknown | SD | ||
| SRSF6 | insertion | Nonsense_Mutation | novel | c.616_617insATTAAATACACT | p.Ser206delinsAsnTerIleHisCys | p.S206delinsN*IHC | Q13247 | protein_coding | TCGA-AM-5820-01 | Colorectum | colon adenocarcinoma | Female | <65 | I/II | Unknown | Unknown | SD | ||
| SRSF6 | insertion | In_Frame_Ins | novel | c.137_138insCGACGCCGA | p.Asp49_Ala51dup | p.D49_A51dup | Q13247 | protein_coding | TCGA-EI-6510-01 | Colorectum | rectum adenocarcinoma | Female | >=65 | I/II | Unknown | Unknown | SD |
| Page: 1 2 3 4 5 6 |
Top |
Related drugs of malignant transformation related genes |
| Identification of chemicals and drugs interact with genes involved in malignant transfromation |
| (DGIdb 4.0) |
| Entrez ID | Symbol | Category | Interaction Types | Drug Claim Name | Drug Name | PMIDs |
| Page: 1 |

Copyright 2023-Present -The University of Texas Health Science Center at Houston |