| Tissue | Expression Dynamics | Abbreviation |
| Colorectum (GSE201348) |  | FAP: Familial adenomatous polyposis |
| CRC: Colorectal cancer |
| Colorectum (HTA11) |  | AD: Adenomas |
| SER: Sessile serrated lesions |
| MSI-H: Microsatellite-high colorectal cancer |
| MSS: Microsatellite stable colorectal cancer |
| Endometrium |  | AEH: Atypical endometrial hyperplasia |
| EEC: Endometrioid Cancer |
| Esophagus | 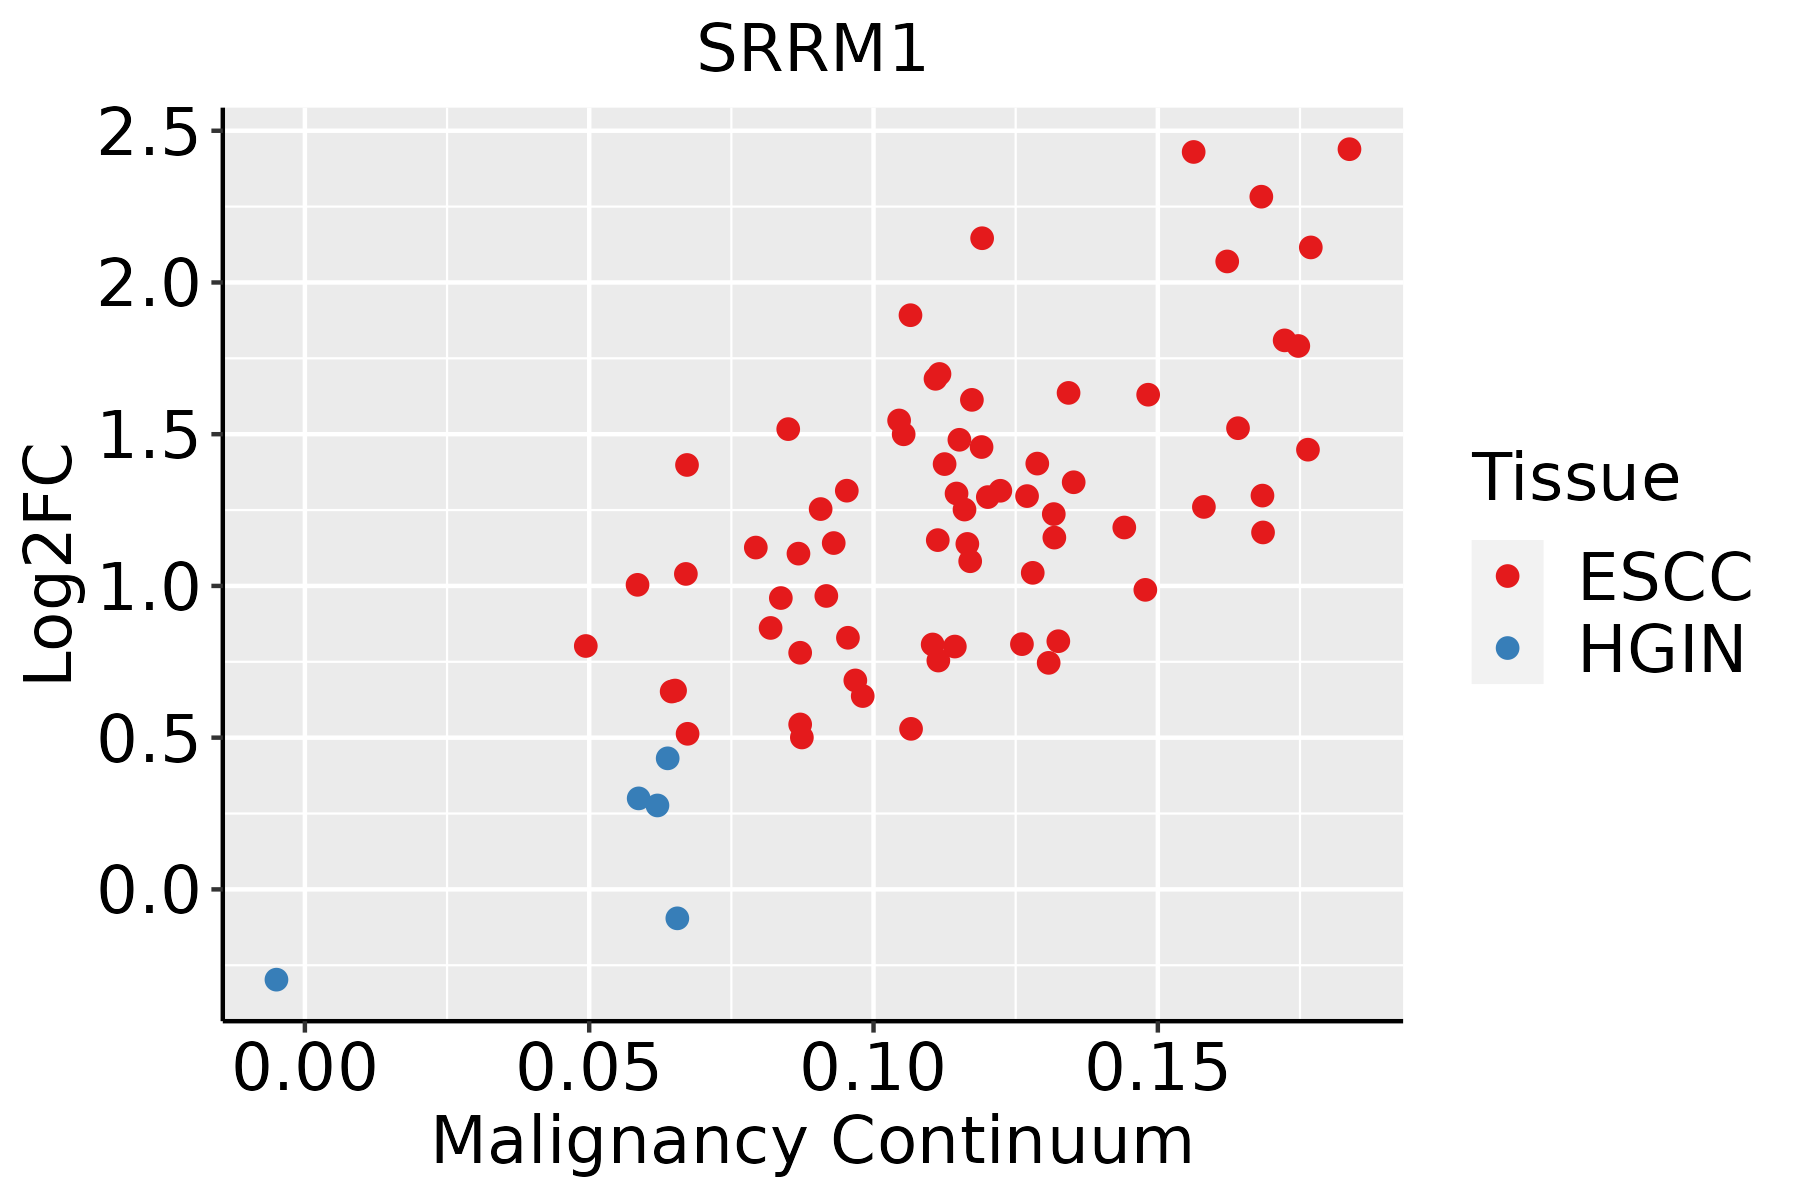 | ESCC: Esophageal squamous cell carcinoma |
| HGIN: High-grade intraepithelial neoplasias |
| LGIN: Low-grade intraepithelial neoplasias |
| GC | 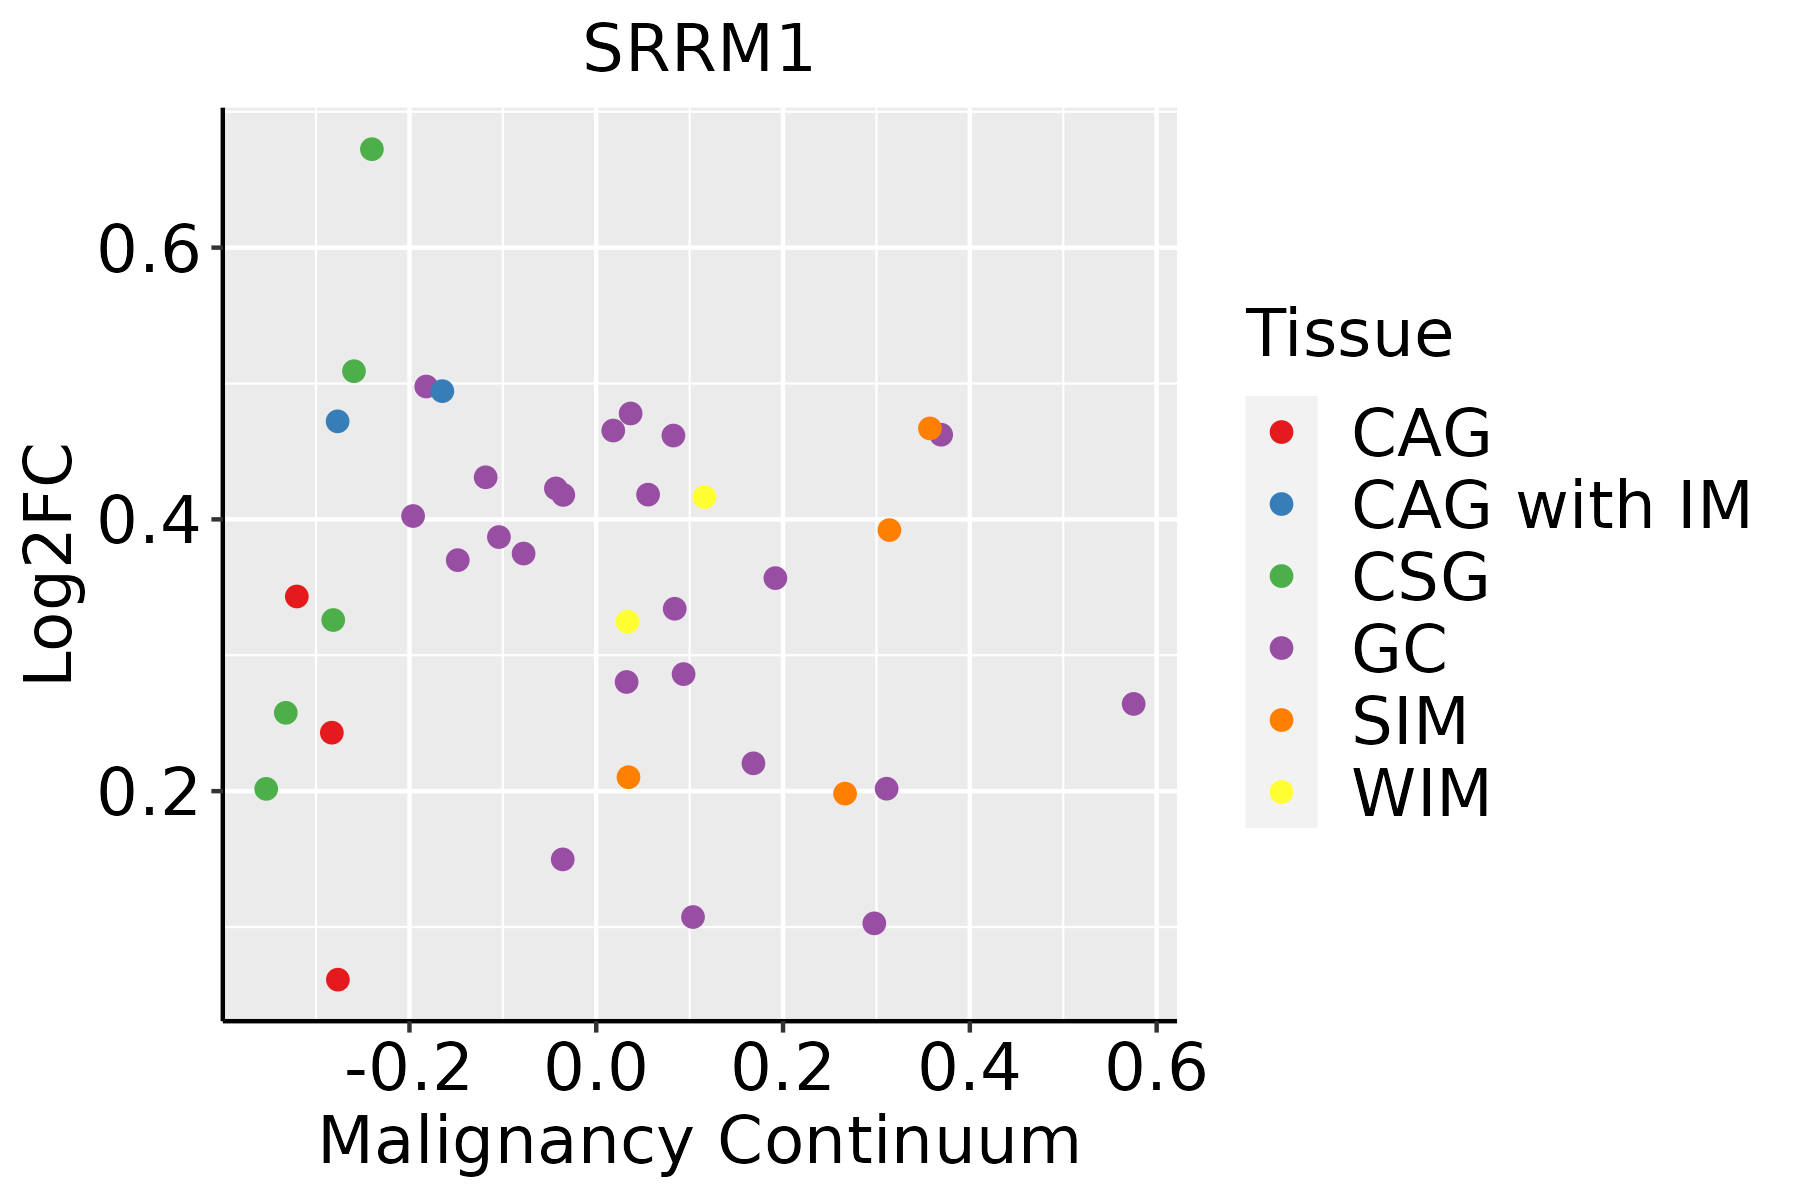 | CAG: Chronic atrophic gastritis |
| CAG with IM: Chronic atrophic gastritis with intestinal metaplasia |
| CSG: Chronic superficial gastritis |
| GC: Gastric cancer |
| SIM: Severe intestinal metaplasia |
| WIM: Wild intestinal metaplasia |
| Liver | 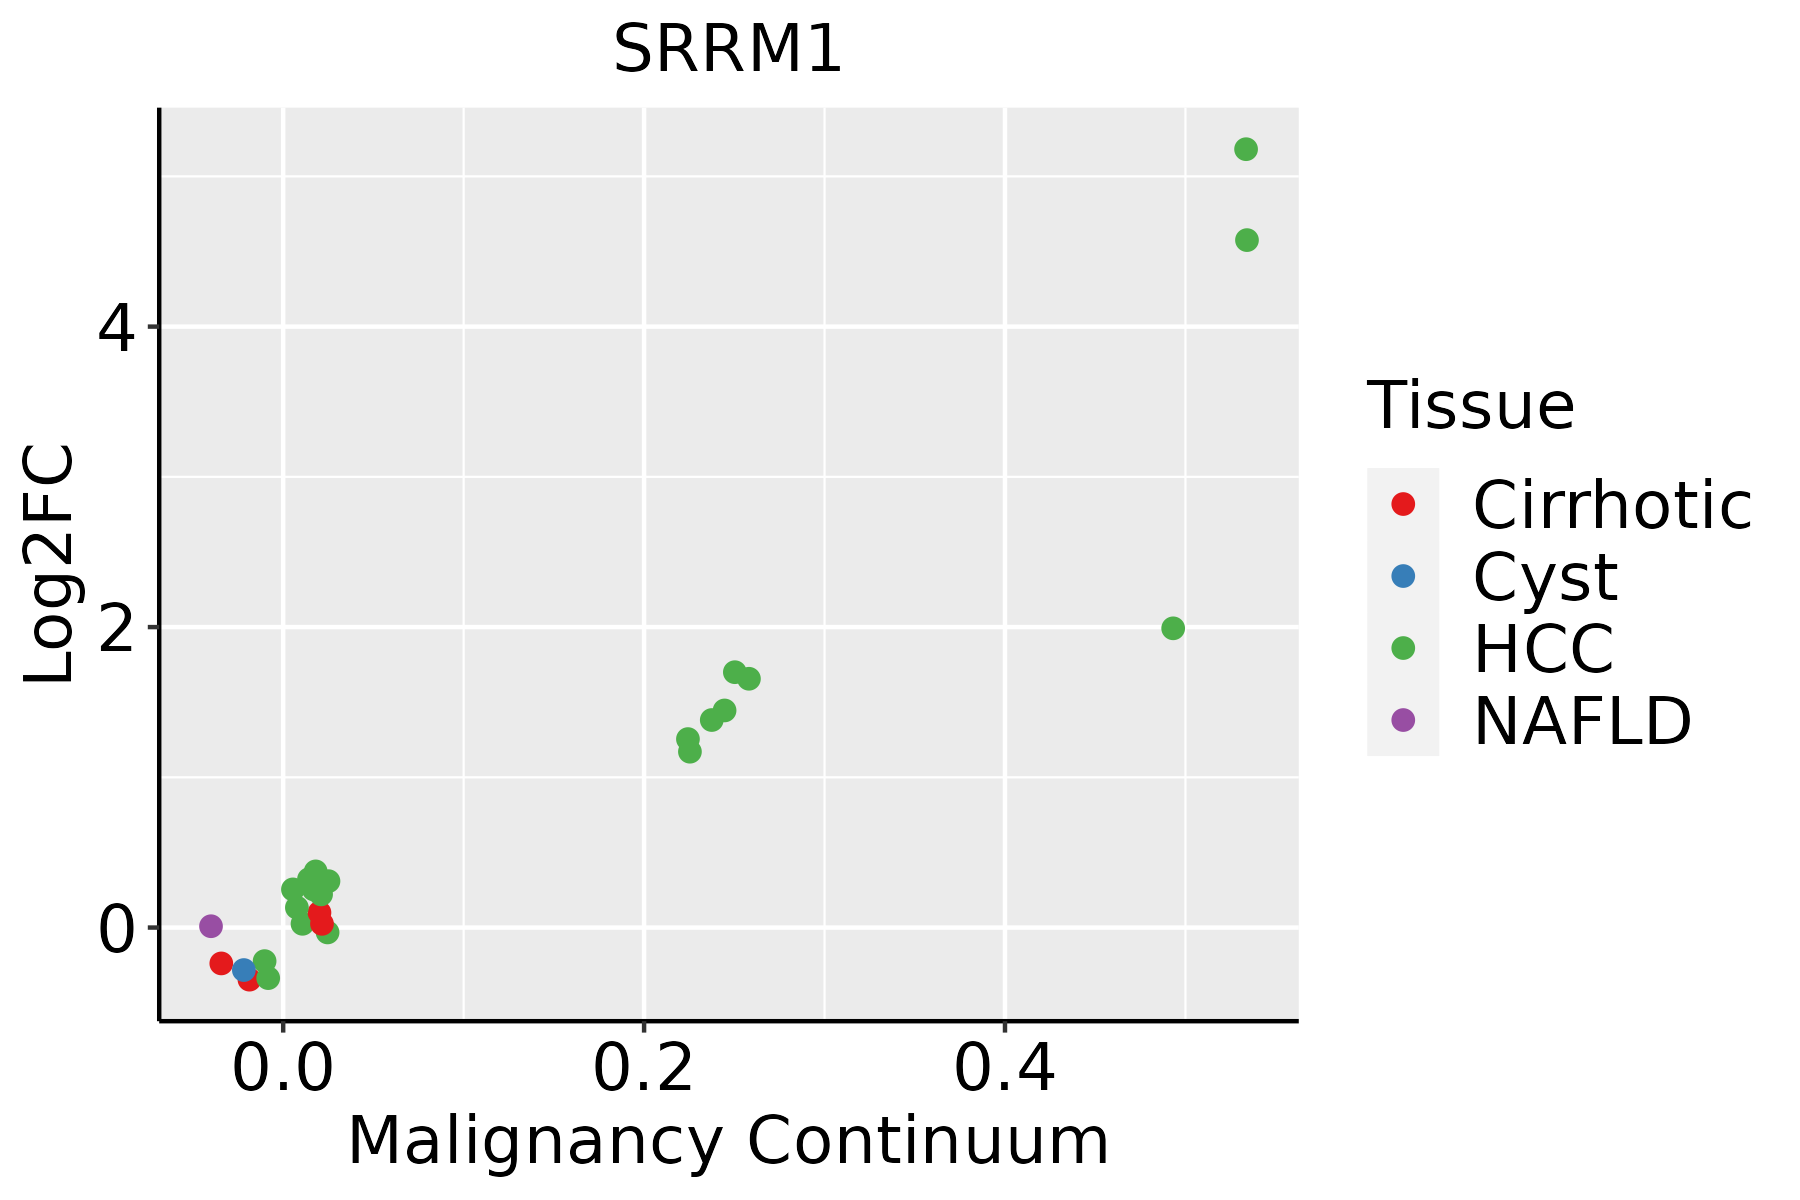 | HCC: Hepatocellular carcinoma |
| NAFLD: Non-alcoholic fatty liver disease |
| Oral Cavity | 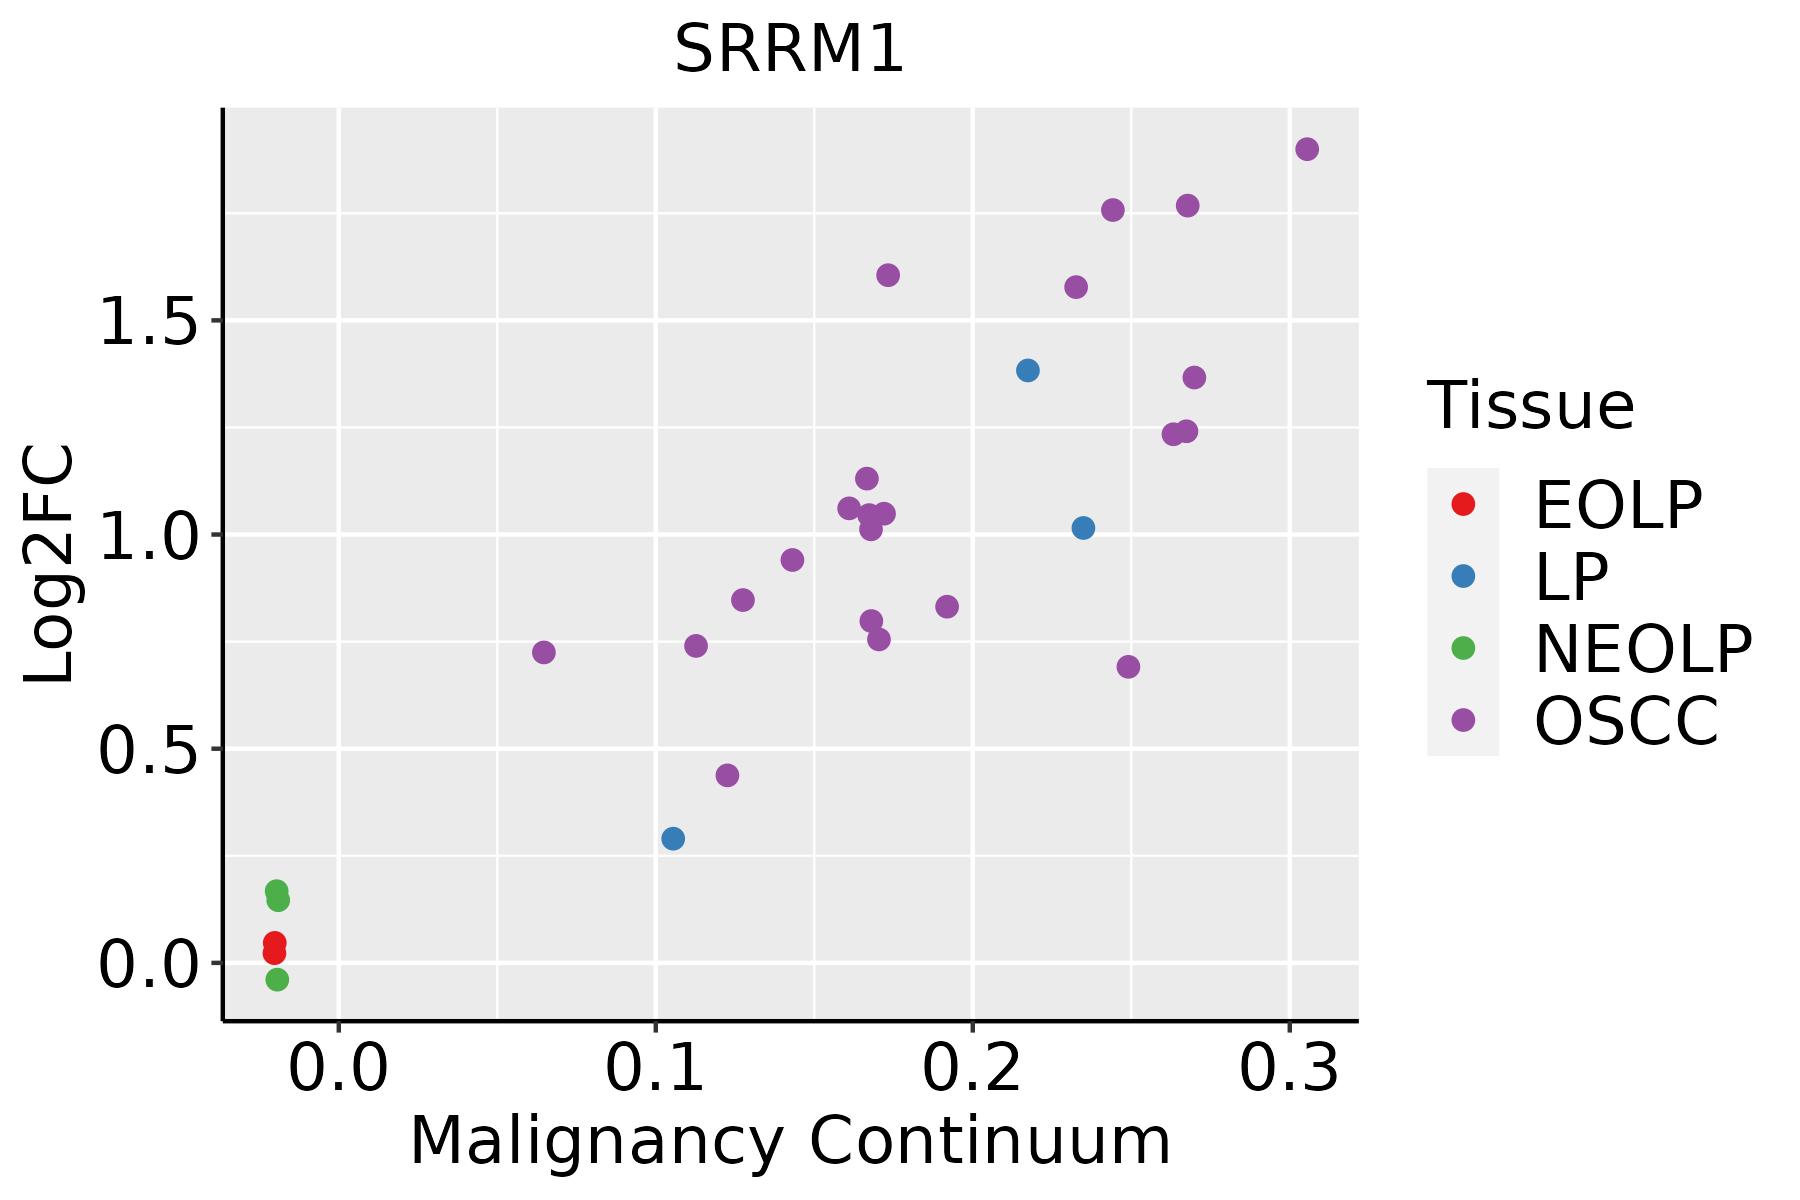 | EOLP: Erosive Oral lichen planus |
| LP: leukoplakia |
| NEOLP: Non-erosive oral lichen planus |
| OSCC: Oral squamous cell carcinoma |
| Prostate | 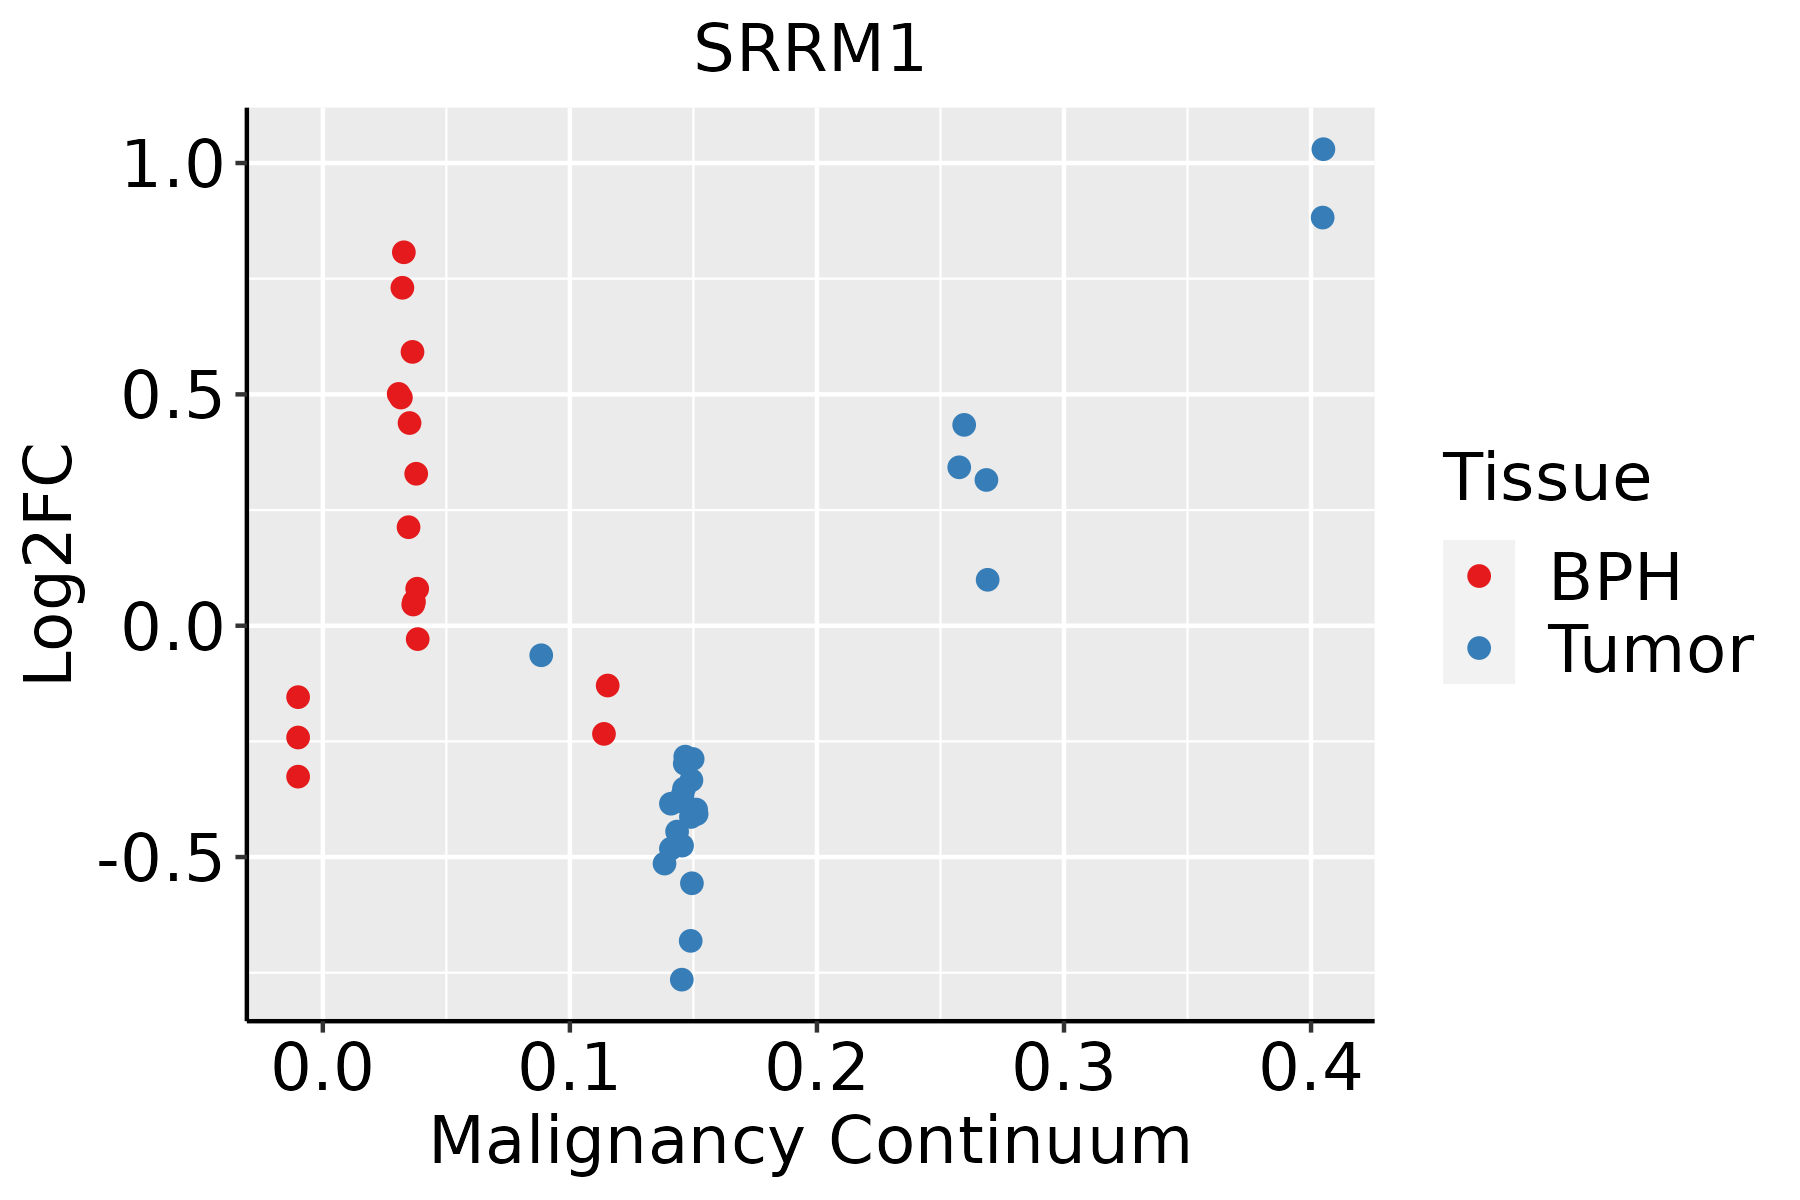 | BPH: Benign Prostatic Hyperplasia |
| Skin |  | AK: Actinic keratosis |
| cSCC: Cutaneous squamous cell carcinoma |
| SCCIS:squamous cell carcinoma in situ |
| Thyroid | 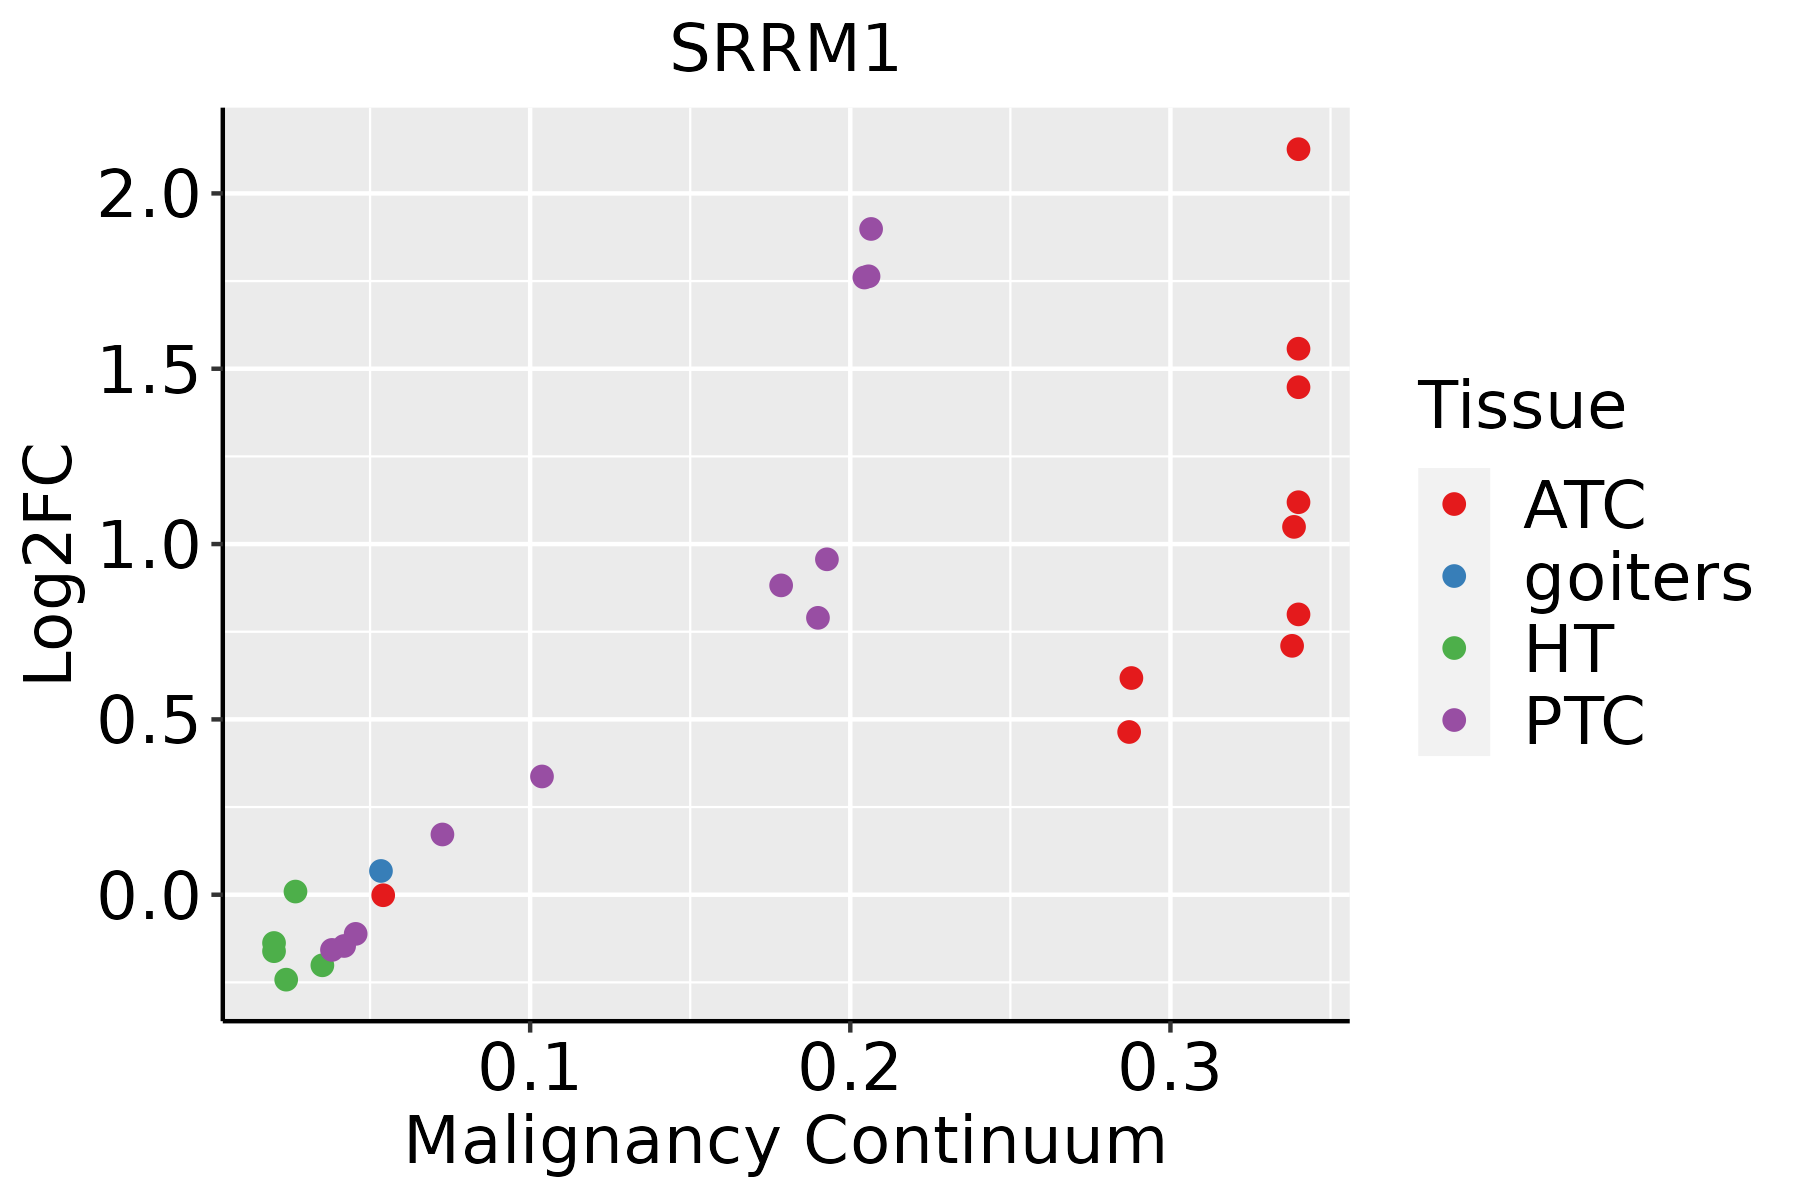 | ATC: Anaplastic thyroid cancer |
| HT: Hashimoto's thyroiditis |
| PTC: Papillary thyroid cancer |
| GO ID | Tissue | Disease Stage | Description | Gene Ratio | Bg Ratio | pvalue | p.adjust | Count |
| GO:0008380 | Colorectum | AD | RNA splicing | 169/3918 | 434/18723 | 3.59e-18 | 2.04e-15 | 169 |
| GO:0000377 | Colorectum | AD | RNA splicing, via transesterification reactions with bulged adenosine as nucleophile | 130/3918 | 320/18723 | 5.88e-16 | 2.16e-13 | 130 |
| GO:0000398 | Colorectum | AD | mRNA splicing, via spliceosome | 130/3918 | 320/18723 | 5.88e-16 | 2.16e-13 | 130 |
| GO:0000375 | Colorectum | AD | RNA splicing, via transesterification reactions | 131/3918 | 324/18723 | 7.11e-16 | 2.22e-13 | 131 |
| GO:00083804 | Colorectum | FAP | RNA splicing | 108/2622 | 434/18723 | 7.90e-10 | 1.86e-07 | 108 |
| GO:00003754 | Colorectum | FAP | RNA splicing, via transesterification reactions | 84/2622 | 324/18723 | 8.06e-09 | 1.10e-06 | 84 |
| GO:00003774 | Colorectum | FAP | RNA splicing, via transesterification reactions with bulged adenosine as nucleophile | 83/2622 | 320/18723 | 9.66e-09 | 1.23e-06 | 83 |
| GO:00003984 | Colorectum | FAP | mRNA splicing, via spliceosome | 83/2622 | 320/18723 | 9.66e-09 | 1.23e-06 | 83 |
| GO:00083805 | Colorectum | CRC | RNA splicing | 90/2078 | 434/18723 | 2.80e-09 | 7.97e-07 | 90 |
| GO:00003775 | Colorectum | CRC | RNA splicing, via transesterification reactions with bulged adenosine as nucleophile | 66/2078 | 320/18723 | 4.39e-07 | 3.37e-05 | 66 |
| GO:00003985 | Colorectum | CRC | mRNA splicing, via spliceosome | 66/2078 | 320/18723 | 4.39e-07 | 3.37e-05 | 66 |
| GO:00003755 | Colorectum | CRC | RNA splicing, via transesterification reactions | 66/2078 | 324/18723 | 7.00e-07 | 4.61e-05 | 66 |
| GO:000838016 | Endometrium | AEH | RNA splicing | 111/2100 | 434/18723 | 2.42e-17 | 1.12e-14 | 111 |
| GO:000037515 | Endometrium | AEH | RNA splicing, via transesterification reactions | 88/2100 | 324/18723 | 1.11e-15 | 3.91e-13 | 88 |
| GO:000037715 | Endometrium | AEH | RNA splicing, via transesterification reactions with bulged adenosine as nucleophile | 87/2100 | 320/18723 | 1.51e-15 | 4.78e-13 | 87 |
| GO:000039815 | Endometrium | AEH | mRNA splicing, via spliceosome | 87/2100 | 320/18723 | 1.51e-15 | 4.78e-13 | 87 |
| GO:000838017 | Endometrium | EEC | RNA splicing | 111/2168 | 434/18723 | 2.45e-16 | 1.13e-13 | 111 |
| GO:000037516 | Endometrium | EEC | RNA splicing, via transesterification reactions | 88/2168 | 324/18723 | 7.46e-15 | 2.63e-12 | 88 |
| GO:000037716 | Endometrium | EEC | RNA splicing, via transesterification reactions with bulged adenosine as nucleophile | 87/2168 | 320/18723 | 9.97e-15 | 3.15e-12 | 87 |
| GO:000039816 | Endometrium | EEC | mRNA splicing, via spliceosome | 87/2168 | 320/18723 | 9.97e-15 | 3.15e-12 | 87 |
| Pathway ID | Tissue | Disease Stage | Description | Gene Ratio | Bg Ratio | pvalue | p.adjust | qvalue | Count |
| hsa03015 | Colorectum | AD | mRNA surveillance pathway | 35/2092 | 97/8465 | 7.95e-03 | 3.13e-02 | 2.00e-02 | 35 |
| hsa030151 | Colorectum | AD | mRNA surveillance pathway | 35/2092 | 97/8465 | 7.95e-03 | 3.13e-02 | 2.00e-02 | 35 |
| hsa030152 | Colorectum | FAP | mRNA surveillance pathway | 26/1404 | 97/8465 | 7.11e-03 | 2.64e-02 | 1.60e-02 | 26 |
| hsa030153 | Colorectum | FAP | mRNA surveillance pathway | 26/1404 | 97/8465 | 7.11e-03 | 2.64e-02 | 1.60e-02 | 26 |
| hsa0301321 | Esophagus | ESCC | Nucleocytoplasmic transport | 89/4205 | 108/8465 | 1.20e-12 | 2.37e-11 | 1.21e-11 | 89 |
| hsa0301524 | Esophagus | ESCC | mRNA surveillance pathway | 72/4205 | 97/8465 | 6.12e-07 | 4.10e-06 | 2.10e-06 | 72 |
| hsa0301331 | Esophagus | ESCC | Nucleocytoplasmic transport | 89/4205 | 108/8465 | 1.20e-12 | 2.37e-11 | 1.21e-11 | 89 |
| hsa0301534 | Esophagus | ESCC | mRNA surveillance pathway | 72/4205 | 97/8465 | 6.12e-07 | 4.10e-06 | 2.10e-06 | 72 |
| hsa030154 | Liver | Cirrhotic | mRNA surveillance pathway | 46/2530 | 97/8465 | 1.92e-04 | 1.30e-03 | 8.03e-04 | 46 |
| hsa0301511 | Liver | Cirrhotic | mRNA surveillance pathway | 46/2530 | 97/8465 | 1.92e-04 | 1.30e-03 | 8.03e-04 | 46 |
| hsa03013 | Liver | HCC | Nucleocytoplasmic transport | 81/4020 | 108/8465 | 4.28e-09 | 6.83e-08 | 3.80e-08 | 81 |
| hsa0301521 | Liver | HCC | mRNA surveillance pathway | 66/4020 | 97/8465 | 3.16e-05 | 1.88e-04 | 1.04e-04 | 66 |
| hsa030131 | Liver | HCC | Nucleocytoplasmic transport | 81/4020 | 108/8465 | 4.28e-09 | 6.83e-08 | 3.80e-08 | 81 |
| hsa0301531 | Liver | HCC | mRNA surveillance pathway | 66/4020 | 97/8465 | 3.16e-05 | 1.88e-04 | 1.04e-04 | 66 |
| hsa030136 | Oral cavity | OSCC | Nucleocytoplasmic transport | 82/3704 | 108/8465 | 7.93e-12 | 1.33e-10 | 6.77e-11 | 82 |
| hsa030158 | Oral cavity | OSCC | mRNA surveillance pathway | 75/3704 | 97/8465 | 1.30e-11 | 2.01e-10 | 1.02e-10 | 75 |
| hsa0301311 | Oral cavity | OSCC | Nucleocytoplasmic transport | 82/3704 | 108/8465 | 7.93e-12 | 1.33e-10 | 6.77e-11 | 82 |
| hsa0301513 | Oral cavity | OSCC | mRNA surveillance pathway | 75/3704 | 97/8465 | 1.30e-11 | 2.01e-10 | 1.02e-10 | 75 |
| hsa0301523 | Oral cavity | LP | mRNA surveillance pathway | 50/2418 | 97/8465 | 1.39e-06 | 1.50e-05 | 9.66e-06 | 50 |
| hsa030132 | Oral cavity | LP | Nucleocytoplasmic transport | 53/2418 | 108/8465 | 4.68e-06 | 4.10e-05 | 2.64e-05 | 53 |
| Hugo Symbol | Variant Class | Variant Classification | dbSNP RS | HGVSc | HGVSp | HGVSp Short | SWISSPROT | BIOTYPE | SIFT | PolyPhen | Tumor Sample Barcode | Tissue | Histology | Sex | Age | Stage | Therapy Types | Drugs | Outcome |
| SRRM1 | SNV | Missense_Mutation | | c.94G>A | p.Glu32Lys | p.E32K | Q8IYB3 | protein_coding | tolerated_low_confidence(0.07) | probably_damaging(0.932) | TCGA-A2-A25D-01 | Breast | breast invasive carcinoma | Female | >=65 | III/IV | Hormone Therapy | tamoxiphen | SD |
| SRRM1 | SNV | Missense_Mutation | rs377349401 | c.730N>G | p.Ile244Val | p.I244V | Q8IYB3 | protein_coding | tolerated_low_confidence(0.15) | benign(0) | TCGA-AN-A0AK-01 | Breast | breast invasive carcinoma | Female | >=65 | I/II | Unknown | Unknown | SD |
| SRRM1 | SNV | Missense_Mutation | novel | c.599N>G | p.Ser200Cys | p.S200C | Q8IYB3 | protein_coding | deleterious_low_confidence(0.01) | probably_damaging(0.984) | TCGA-BH-A0B6-01 | Breast | breast invasive carcinoma | Female | <65 | I/II | Unknown | Unknown | SD |
| SRRM1 | SNV | Missense_Mutation | novel | c.763N>A | p.Glu255Lys | p.E255K | Q8IYB3 | protein_coding | tolerated_low_confidence(0.07) | benign(0.052) | TCGA-C8-A12Q-01 | Breast | breast invasive carcinoma | Female | >=65 | III/IV | Unknown | Unknown | PD |
| SRRM1 | SNV | Missense_Mutation | rs150723178 | c.2327C>T | p.Pro776Leu | p.P776L | Q8IYB3 | protein_coding | deleterious_low_confidence(0) | benign(0.086) | TCGA-E2-A1B1-01 | Breast | breast invasive carcinoma | Female | <65 | I/II | Other, specify in notesbiphosphonate | zoledronic | SD |
| SRRM1 | SNV | Missense_Mutation | novel | c.958C>T | p.Arg320Trp | p.R320W | Q8IYB3 | protein_coding | deleterious_low_confidence(0) | probably_damaging(0.985) | TCGA-2W-A8YY-01 | Cervix | cervical & endocervical cancer | Female | <65 | I/II | Chemotherapy | cisplatin | CR |
| SRRM1 | SNV | Missense_Mutation | rs760382573 | c.1049G>A | p.Arg350His | p.R350H | Q8IYB3 | protein_coding | deleterious_low_confidence(0) | benign(0.001) | TCGA-2W-A8YY-01 | Cervix | cervical & endocervical cancer | Female | <65 | I/II | Chemotherapy | cisplatin | CR |
| SRRM1 | SNV | Missense_Mutation | novel | c.2399N>A | p.Arg800Lys | p.R800K | Q8IYB3 | protein_coding | tolerated_low_confidence(0.31) | benign(0.009) | TCGA-DG-A2KM-01 | Cervix | cervical & endocervical cancer | Female | <65 | I/II | Chemotherapy | cisplatin | SD |
| SRRM1 | SNV | Missense_Mutation | novel | c.835C>T | p.Arg279Trp | p.R279W | Q8IYB3 | protein_coding | tolerated_low_confidence(0.07) | possibly_damaging(0.545) | TCGA-DS-A1OC-01 | Cervix | cervical & endocervical cancer | Female | <65 | I/II | Chemotherapy | gemcitabine | SD |
| SRRM1 | insertion | Frame_Shift_Ins | novel | c.836_837insATTT | p.Ser280PhefsTer21 | p.S280Ffs*21 | Q8IYB3 | protein_coding | | | TCGA-DS-A1OC-01 | Cervix | cervical & endocervical cancer | Female | <65 | I/II | Chemotherapy | gemcitabine | SD |


