
|
|||||
|
 | |
| |
| |
| |
| |
| |
|
Gene: SRPX2 |
Gene summary for SRPX2 |
| Gene information | Species | Human | Gene symbol | SRPX2 | Gene ID | 27286 |
| Gene name | sushi repeat containing protein X-linked 2 | |
| Gene Alias | BPP | |
| Cytomap | Xq22.1 | |
| Gene Type | protein-coding | GO ID | GO:0001525 | UniProtAcc | O60687 |
Top |
Malignant transformation analysis |
| Identification of the aberrant gene expression in precancerous and cancerous lesions by comparing the gene expression of stem-like cells in diseased tissues with normal stem cells |
| Entrez ID | Symbol | Replicates | Species | Organ | Tissue | Adj P-value | Log2FC | Malignancy |
| 27286 | SRPX2 | HTA11_347_2000001011 | Human | Colorectum | AD | 2.34e-16 | 6.36e-01 | -0.1954 |
| 27286 | SRPX2 | HTA11_696_2000001011 | Human | Colorectum | AD | 6.82e-08 | 3.47e-01 | -0.1464 |
| 27286 | SRPX2 | HTA11_7469_2000001011 | Human | Colorectum | AD | 2.77e-18 | 1.81e+00 | -0.0124 |
| 27286 | SRPX2 | HTA11_99999971662_82457 | Human | Colorectum | MSS | 8.57e-04 | 2.54e-01 | 0.3859 |
| 27286 | SRPX2 | HTA11_99999973899_84307 | Human | Colorectum | MSS | 2.60e-03 | 3.49e-01 | 0.2585 |
| 27286 | SRPX2 | HTA11_99999974143_84620 | Human | Colorectum | MSS | 5.53e-04 | 2.54e-01 | 0.3005 |
| 27286 | SRPX2 | A001-C-108 | Human | Colorectum | FAP | 3.61e-02 | -1.05e-01 | -0.0272 |
| 27286 | SRPX2 | A015-C-104 | Human | Colorectum | FAP | 3.61e-02 | -1.11e-01 | -0.1899 |
| 27286 | SRPX2 | A001-C-203 | Human | Colorectum | FAP | 1.71e-02 | -1.11e-01 | -0.0481 |
| 27286 | SRPX2 | LZE8T | Human | Esophagus | ESCC | 1.37e-02 | 1.48e-01 | 0.067 |
| 27286 | SRPX2 | LZE20T | Human | Esophagus | ESCC | 2.62e-07 | 3.54e-01 | 0.0662 |
| 27286 | SRPX2 | LZE24T | Human | Esophagus | ESCC | 2.80e-02 | 2.65e-01 | 0.0596 |
| 27286 | SRPX2 | LZE21T | Human | Esophagus | ESCC | 1.63e-04 | 5.40e-01 | 0.0655 |
| 27286 | SRPX2 | P1T-E | Human | Esophagus | ESCC | 1.29e-06 | 5.92e-01 | 0.0875 |
| 27286 | SRPX2 | P5T-E | Human | Esophagus | ESCC | 4.17e-05 | 1.36e-01 | 0.1327 |
| 27286 | SRPX2 | P8T-E | Human | Esophagus | ESCC | 1.59e-30 | 7.14e-01 | 0.0889 |
| 27286 | SRPX2 | P9T-E | Human | Esophagus | ESCC | 6.72e-09 | 3.07e-01 | 0.1131 |
| 27286 | SRPX2 | P11T-E | Human | Esophagus | ESCC | 3.20e-05 | 4.83e-01 | 0.1426 |
| 27286 | SRPX2 | P15T-E | Human | Esophagus | ESCC | 2.67e-02 | 1.10e-01 | 0.1149 |
| 27286 | SRPX2 | P19T-E | Human | Esophagus | ESCC | 1.53e-10 | 8.71e-01 | 0.1662 |
| Page: 1 2 3 |
| Tissue | Expression Dynamics | Abbreviation |
| Colorectum (GSE201348) |  | FAP: Familial adenomatous polyposis |
| CRC: Colorectal cancer | ||
| Colorectum (HTA11) |  | AD: Adenomas |
| SER: Sessile serrated lesions | ||
| MSI-H: Microsatellite-high colorectal cancer | ||
| MSS: Microsatellite stable colorectal cancer | ||
| Esophagus | 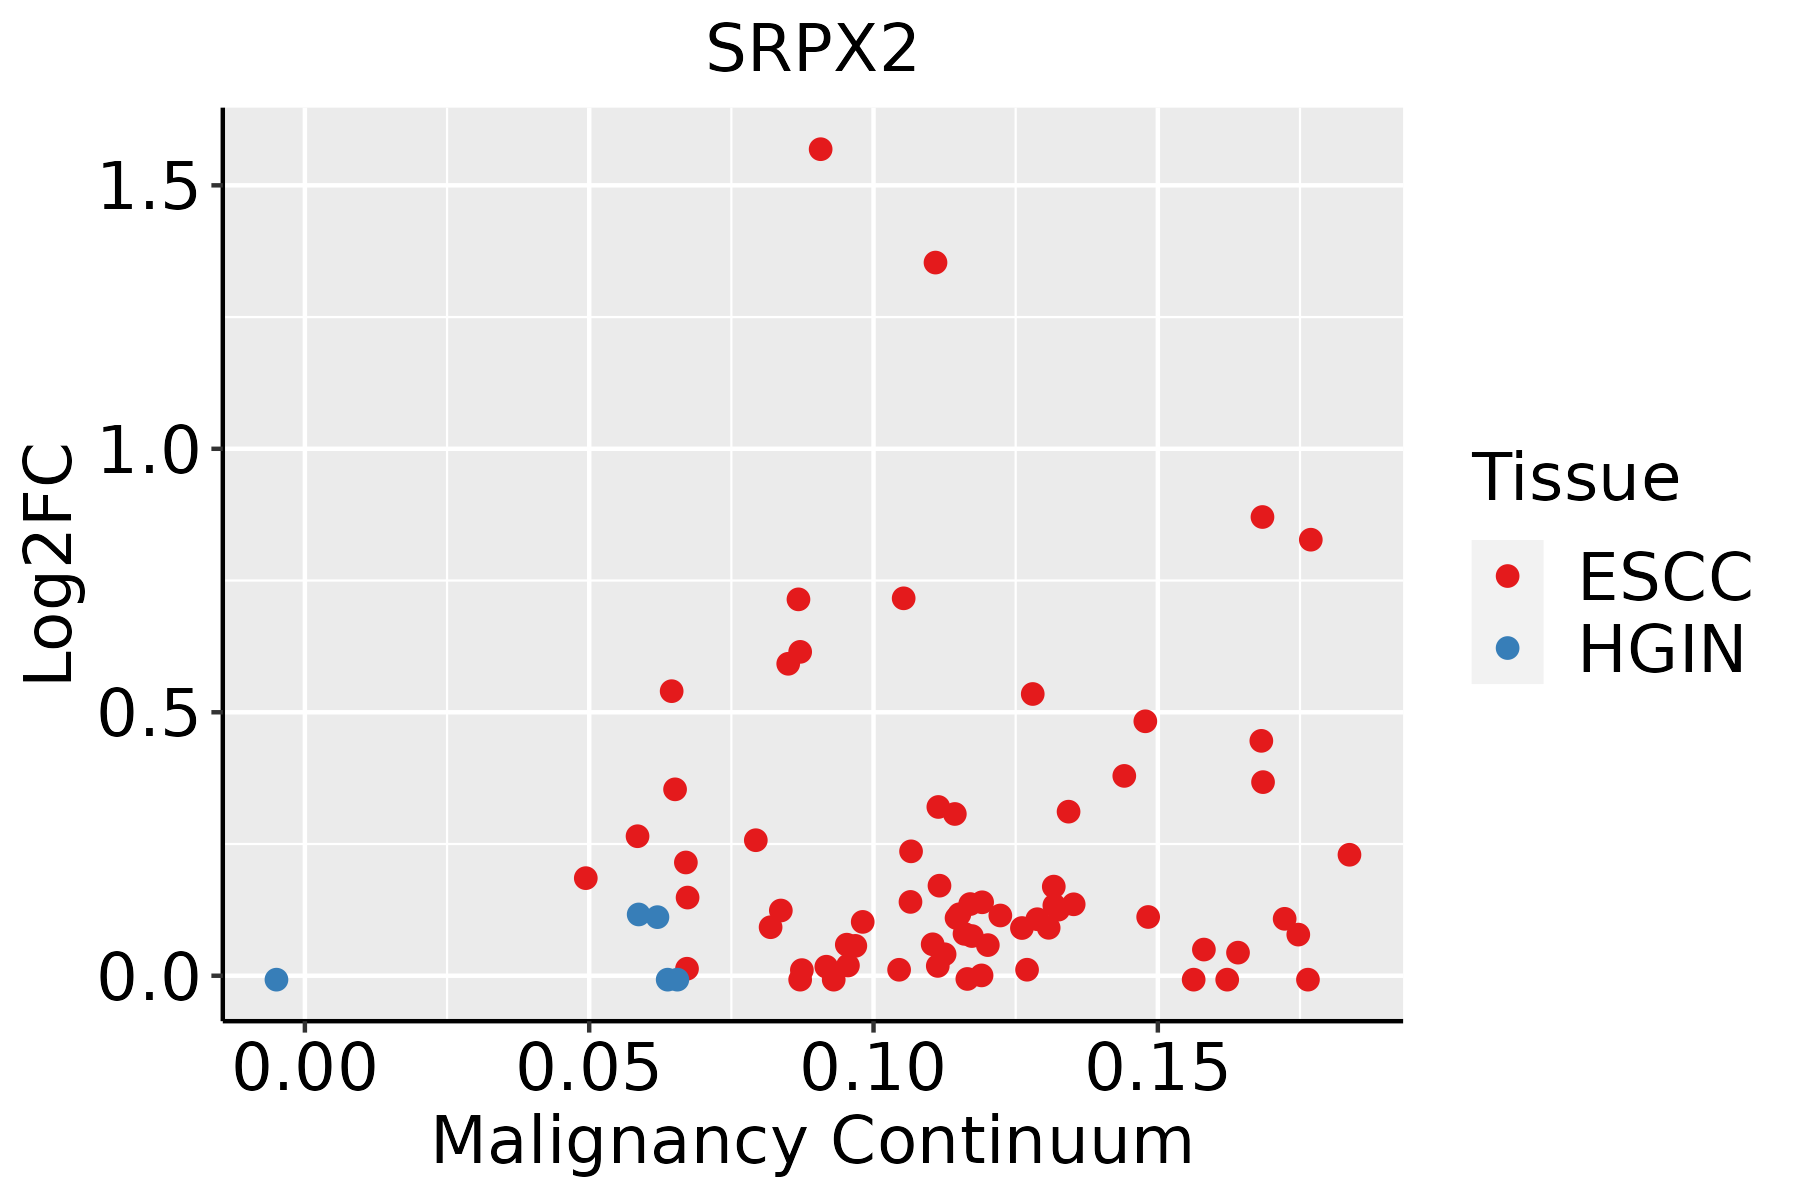 | ESCC: Esophageal squamous cell carcinoma |
| HGIN: High-grade intraepithelial neoplasias | ||
| LGIN: Low-grade intraepithelial neoplasias | ||
| Liver | 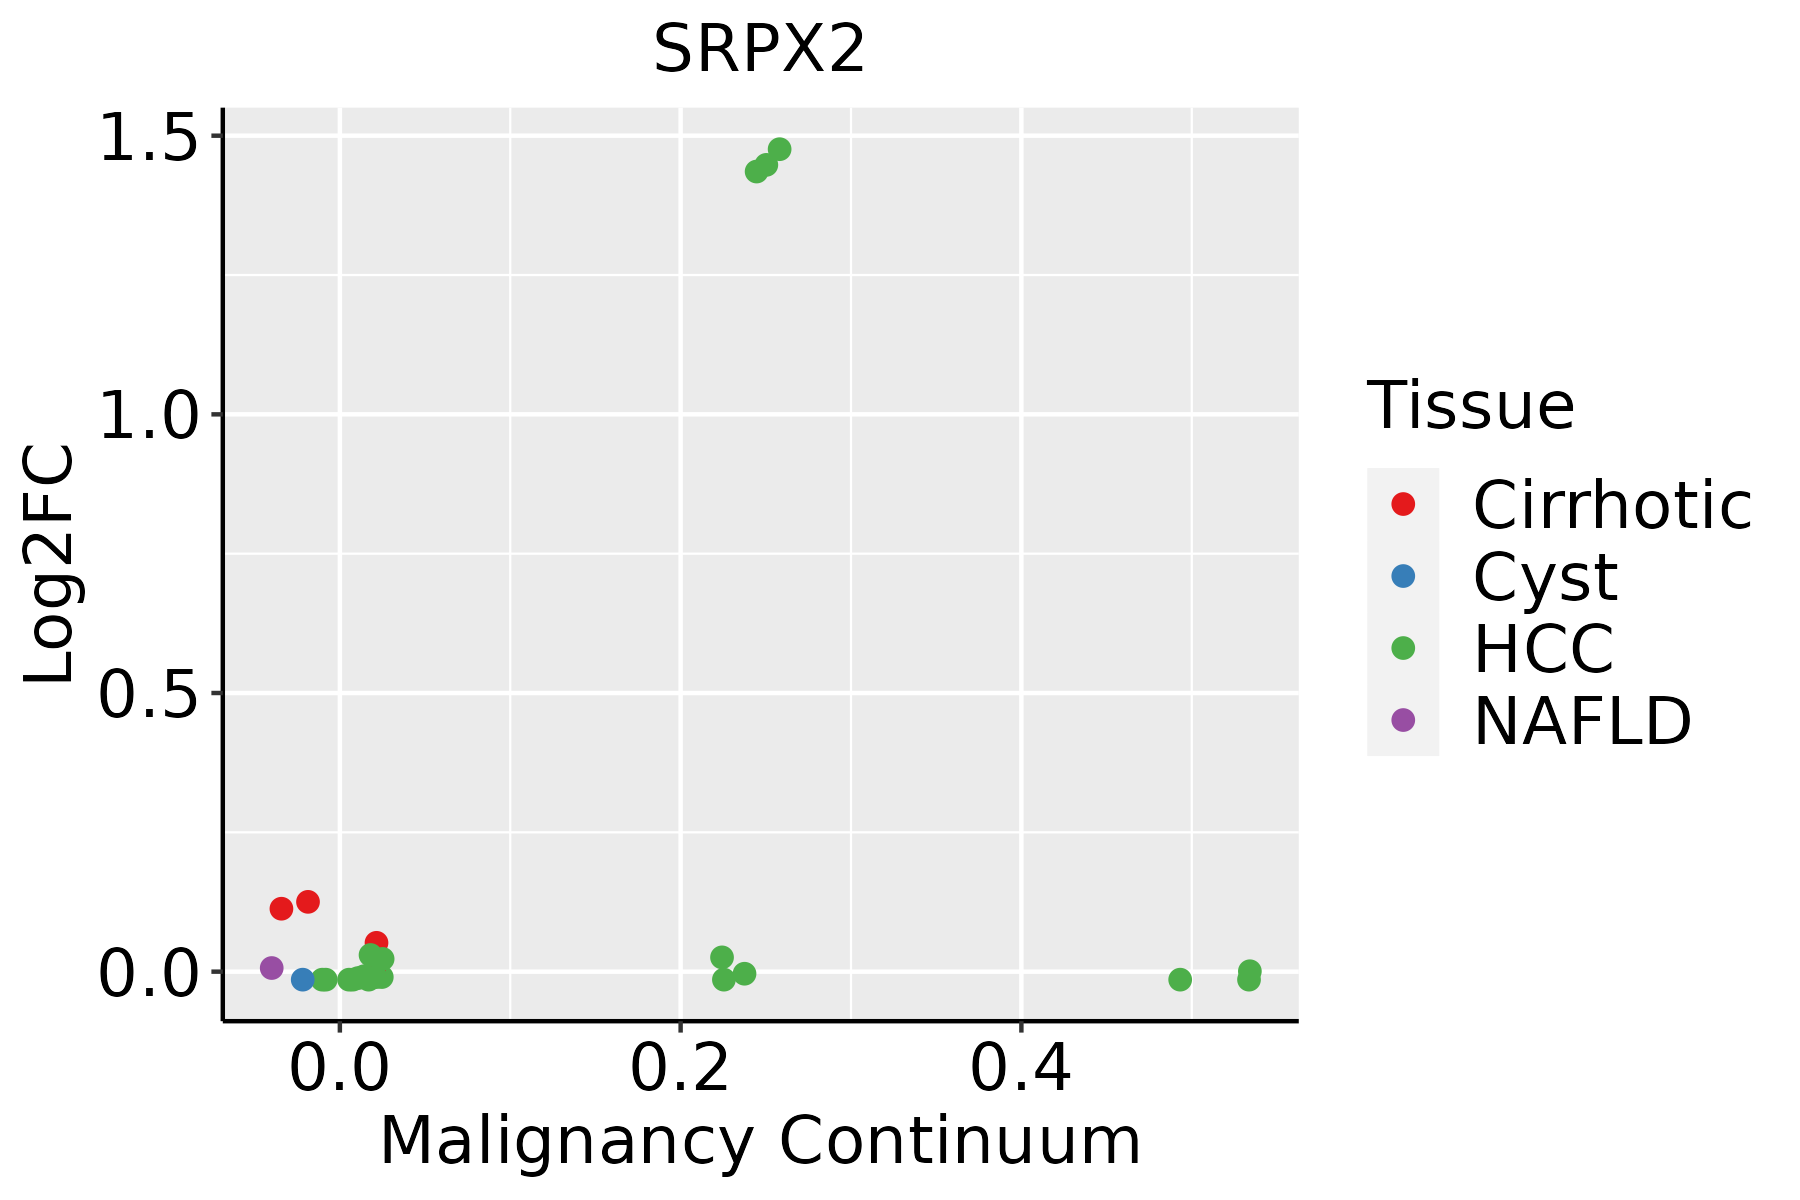 | HCC: Hepatocellular carcinoma |
| NAFLD: Non-alcoholic fatty liver disease | ||
| Thyroid | 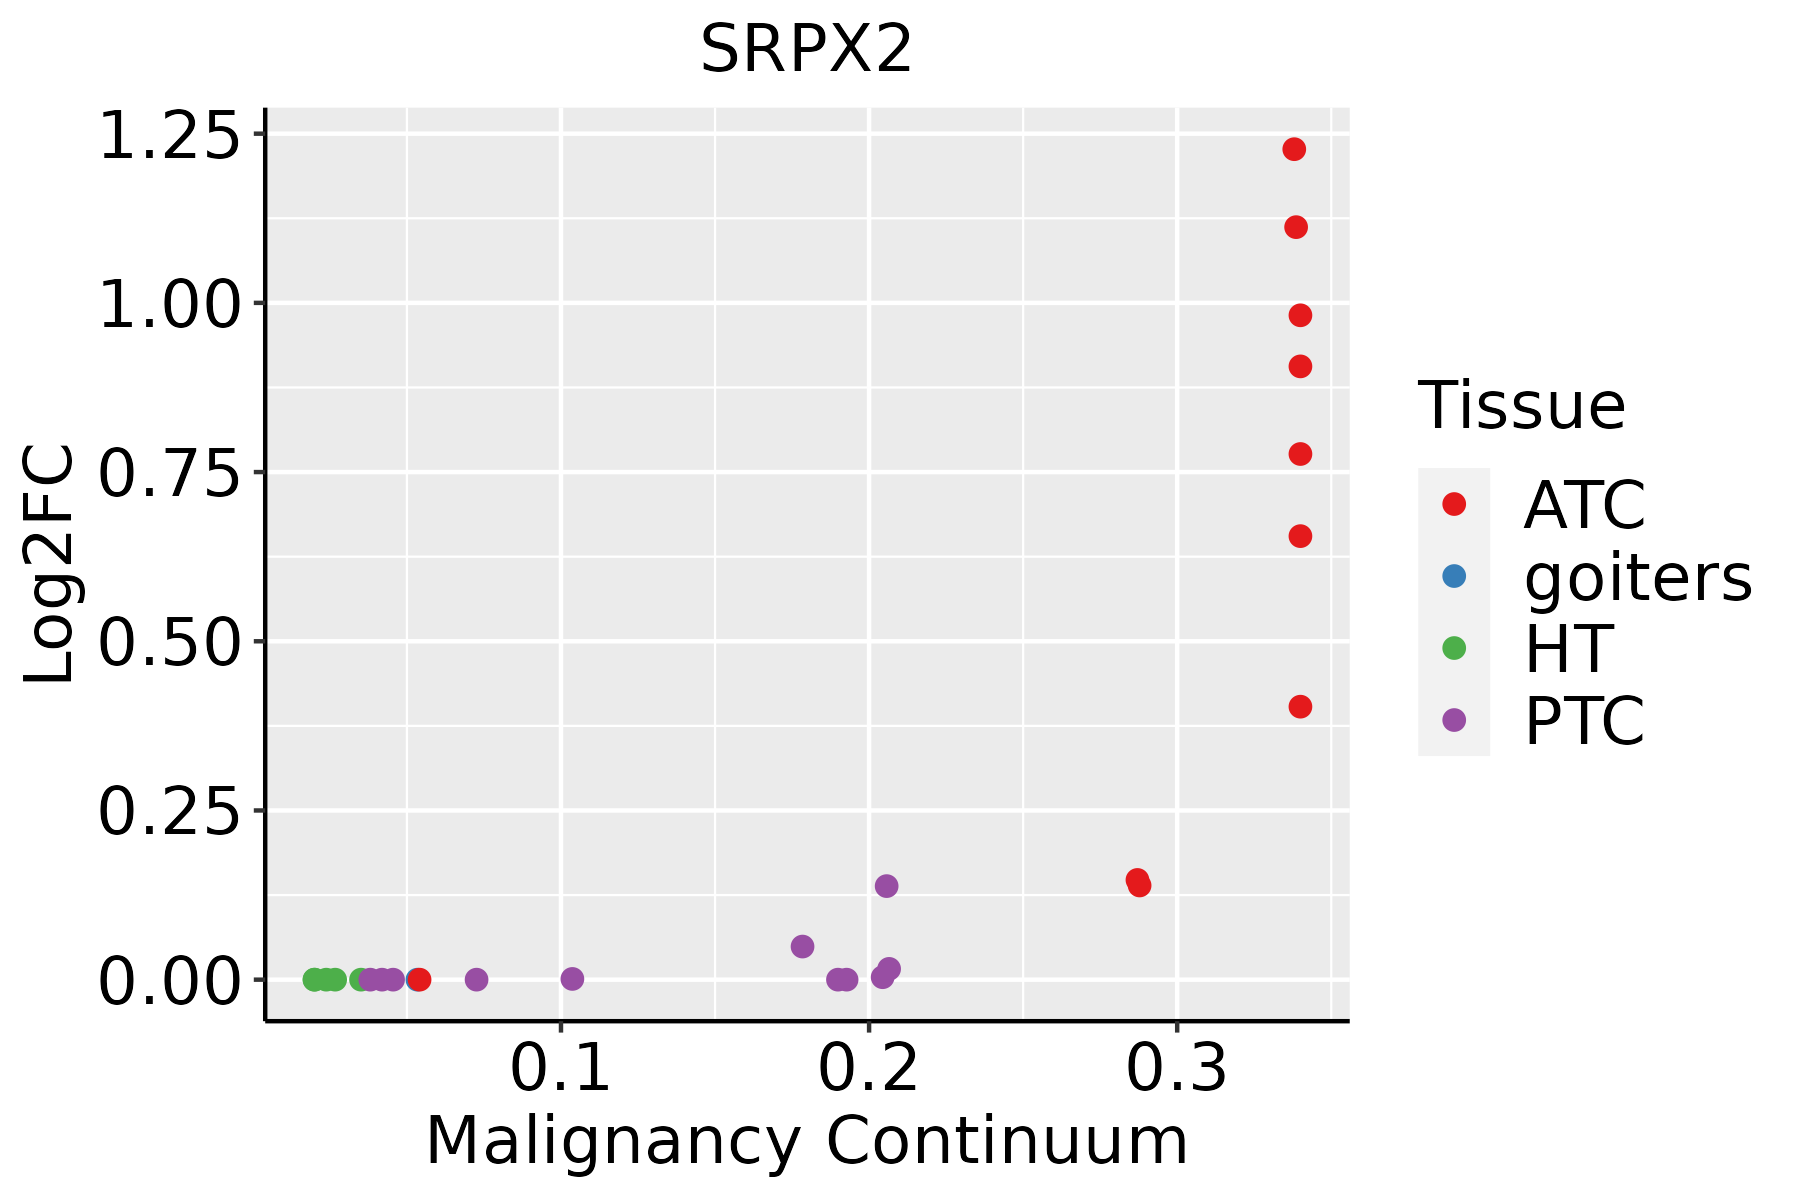 | ATC: Anaplastic thyroid cancer |
| HT: Hashimoto's thyroiditis | ||
| PTC: Papillary thyroid cancer |
| ∗log2FC in expression of this searched gene in stem-like cells from each diseased tissue sample relative to stem-like cells in normal samples in each tissue plotted against the malignancy continuum. Samples are colored based on if they are from different disease stage. |
Top |
Malignant transformation related pathway analysis |
| Find out the enriched GO biological processes and KEGG pathways involved in transition from healthy to precancer to cancer |
| Tissue | Disease Stage | Enriched GO biological Processes |
| Colorectum | AD |  |
| Colorectum | SER |  |
| Colorectum | MSS |  |
| Colorectum | MSI-H |  |
| Colorectum | FAP |  |
| ∗Top 15 enriched GO BP terms are showed in the bar plot of each disease state in each tissue. Each row represents a significant GO biological process which is colored according to the -log10(p.adjust). |
| Page: 1 2 3 4 5 6 7 8 9 |
| GO ID | Tissue | Disease Stage | Description | Gene Ratio | Bg Ratio | pvalue | p.adjust | Count |
| GO:0034329 | Colorectum | AD | cell junction assembly | 136/3918 | 420/18723 | 2.02e-08 | 1.15e-06 | 136 |
| GO:0001667 | Colorectum | AD | ameboidal-type cell migration | 137/3918 | 475/18723 | 2.17e-05 | 4.33e-04 | 137 |
| GO:0090132 | Colorectum | AD | epithelium migration | 105/3918 | 360/18723 | 1.18e-04 | 1.73e-03 | 105 |
| GO:0010632 | Colorectum | AD | regulation of epithelial cell migration | 88/3918 | 292/18723 | 1.19e-04 | 1.75e-03 | 88 |
| GO:0010631 | Colorectum | AD | epithelial cell migration | 104/3918 | 357/18723 | 1.33e-04 | 1.90e-03 | 104 |
| GO:0090130 | Colorectum | AD | tissue migration | 105/3918 | 365/18723 | 2.10e-04 | 2.77e-03 | 105 |
| GO:0010634 | Colorectum | AD | positive regulation of epithelial cell migration | 56/3918 | 176/18723 | 4.51e-04 | 5.03e-03 | 56 |
| GO:1901888 | Colorectum | AD | regulation of cell junction assembly | 61/3918 | 204/18723 | 1.50e-03 | 1.27e-02 | 61 |
| GO:0043542 | Colorectum | AD | endothelial cell migration | 78/3918 | 279/18723 | 2.97e-03 | 2.22e-02 | 78 |
| GO:0050808 | Colorectum | AD | synapse organization | 112/3918 | 426/18723 | 4.25e-03 | 2.92e-02 | 112 |
| GO:0050807 | Colorectum | AD | regulation of synapse organization | 60/3918 | 211/18723 | 5.67e-03 | 3.64e-02 | 60 |
| GO:0010595 | Colorectum | AD | positive regulation of endothelial cell migration | 40/3918 | 133/18723 | 8.01e-03 | 4.73e-02 | 40 |
| GO:00343292 | Colorectum | MSS | cell junction assembly | 120/3467 | 420/18723 | 2.51e-07 | 1.07e-05 | 120 |
| GO:00016672 | Colorectum | MSS | ameboidal-type cell migration | 120/3467 | 475/18723 | 1.37e-04 | 2.05e-03 | 120 |
| GO:00901322 | Colorectum | MSS | epithelium migration | 93/3467 | 360/18723 | 3.30e-04 | 4.24e-03 | 93 |
| GO:00106312 | Colorectum | MSS | epithelial cell migration | 92/3467 | 357/18723 | 3.87e-04 | 4.86e-03 | 92 |
| GO:00106322 | Colorectum | MSS | regulation of epithelial cell migration | 77/3467 | 292/18723 | 5.39e-04 | 6.04e-03 | 77 |
| GO:00901302 | Colorectum | MSS | tissue migration | 93/3467 | 365/18723 | 5.42e-04 | 6.06e-03 | 93 |
| GO:00106342 | Colorectum | MSS | positive regulation of epithelial cell migration | 50/3467 | 176/18723 | 8.50e-04 | 8.75e-03 | 50 |
| GO:00435422 | Colorectum | MSS | endothelial cell migration | 70/3467 | 279/18723 | 3.69e-03 | 2.71e-02 | 70 |
| Page: 1 2 3 |
| Pathway ID | Tissue | Disease Stage | Description | Gene Ratio | Bg Ratio | pvalue | p.adjust | qvalue | Count |
| Page: 1 |
Top |
Cell-cell communication analysis |
| Identification of potential cell-cell interactions between two cell types and their ligand-receptor pairs for different disease states |
| Ligand | Receptor | LRpair | Pathway | Tissue | Disease Stage |
| Page: 1 |
Top |
Single-cell gene regulatory network inference analysis |
| Find out the significant the regulons (TFs) and the target genes of each regulon across cell types for different disease states |
| TF | Cell Type | Tissue | Disease Stage | Target Gene | RSS | Regulon Activity |
| ∗The dot plots of a searched regulon are shown for all cell subpopulations in each disease state of each tissue based on the regulon specific score inferred using pySCENIC and by calculating the average expression. |
| Page: 1 |
Top |
Somatic mutation of malignant transformation related genes |
| Annotation of somatic variants for genes involved in malignant transformation |
| Hugo Symbol | Variant Class | Variant Classification | dbSNP RS | HGVSc | HGVSp | HGVSp Short | SWISSPROT | BIOTYPE | SIFT | PolyPhen | Tumor Sample Barcode | Tissue | Histology | Sex | Age | Stage | Therapy Types | Drugs | Outcome |
| SRPX2 | SNV | Missense_Mutation | novel | c.817N>T | p.Gly273Cys | p.G273C | O60687 | protein_coding | deleterious(0) | probably_damaging(1) | TCGA-A2-A0CR-01 | Breast | breast invasive carcinoma | Female | <65 | I/II | Chemotherapy | adriamycin | CR |
| SRPX2 | SNV | Missense_Mutation | c.517G>C | p.Glu173Gln | p.E173Q | O60687 | protein_coding | tolerated(0.45) | benign(0.037) | TCGA-AO-A128-01 | Breast | breast invasive carcinoma | Female | <65 | I/II | Chemotherapy | doxorubicin | SD | |
| SRPX2 | SNV | Missense_Mutation | rs771790252 | c.568N>T | p.Arg190Cys | p.R190C | O60687 | protein_coding | deleterious(0) | probably_damaging(0.993) | TCGA-GM-A2DC-01 | Breast | breast invasive carcinoma | Female | <65 | I/II | Chemotherapy | xeloda | CR |
| SRPX2 | SNV | Missense_Mutation | rs370080258 | c.553N>T | p.Arg185Cys | p.R185C | O60687 | protein_coding | deleterious(0) | benign(0.438) | TCGA-2W-A8YY-01 | Cervix | cervical & endocervical cancer | Female | <65 | I/II | Chemotherapy | cisplatin | CR |
| SRPX2 | SNV | Missense_Mutation | c.638N>T | p.Ser213Phe | p.S213F | O60687 | protein_coding | deleterious(0) | possibly_damaging(0.583) | TCGA-EK-A2RC-01 | Cervix | cervical & endocervical cancer | Female | <65 | I/II | Unknown | Unknown | SD | |
| SRPX2 | SNV | Missense_Mutation | novel | c.1138N>A | p.Glu380Lys | p.E380K | O60687 | protein_coding | deleterious(0) | probably_damaging(0.998) | TCGA-VS-A94Z-01 | Cervix | cervical & endocervical cancer | Female | <65 | I/II | Chemotherapy | cisplatin | CR |
| SRPX2 | SNV | Missense_Mutation | novel | c.1297N>A | p.Glu433Lys | p.E433K | O60687 | protein_coding | tolerated(0.37) | benign(0.026) | TCGA-ZX-AA5X-01 | Cervix | cervical & endocervical cancer | Female | <65 | III/IV | Unknown | Unknown | SD |
| SRPX2 | SNV | Missense_Mutation | rs148735447 | c.809N>T | p.Pro270Leu | p.P270L | O60687 | protein_coding | tolerated(0.09) | probably_damaging(0.999) | TCGA-AY-4071-01 | Colorectum | colon adenocarcinoma | Female | <65 | I/II | Unknown | Unknown | SD |
| SRPX2 | SNV | Missense_Mutation | rs370685595 | c.1120C>T | p.Arg374Trp | p.R374W | O60687 | protein_coding | deleterious(0) | probably_damaging(0.997) | TCGA-CK-5916-01 | Colorectum | colon adenocarcinoma | Female | >=65 | I/II | Unknown | Unknown | PD |
| SRPX2 | SNV | Missense_Mutation | rs374870686 | c.98N>T | p.Pro33Leu | p.P33L | O60687 | protein_coding | tolerated(0.45) | benign(0) | TCGA-G4-6304-01 | Colorectum | colon adenocarcinoma | Female | >=65 | I/II | Chemotherapy | fluorouracil | PD |
| Page: 1 2 3 4 5 6 7 |
Top |
Related drugs of malignant transformation related genes |
| Identification of chemicals and drugs interact with genes involved in malignant transfromation |
| (DGIdb 4.0) |
| Entrez ID | Symbol | Category | Interaction Types | Drug Claim Name | Drug Name | PMIDs |
| Page: 1 |

Copyright 2023-Present -The University of Texas Health Science Center at Houston |