
|
|||||
|
 | |
| |
| |
| |
| |
| |
|
Gene: SRPX |
Gene summary for SRPX |
| Gene information | Species | Human | Gene symbol | SRPX | Gene ID | 8406 |
| Gene name | sushi repeat containing protein X-linked | |
| Gene Alias | DRS | |
| Cytomap | Xp11.4 | |
| Gene Type | protein-coding | GO ID | GO:0001845 | UniProtAcc | P78539 |
Top |
Malignant transformation analysis |
| Identification of the aberrant gene expression in precancerous and cancerous lesions by comparing the gene expression of stem-like cells in diseased tissues with normal stem cells |
| Entrez ID | Symbol | Replicates | Species | Organ | Tissue | Adj P-value | Log2FC | Malignancy |
| 8406 | SRPX | P10T-E | Human | Esophagus | ESCC | 7.40e-07 | 1.43e-01 | 0.116 |
| 8406 | SRPX | P15T-E | Human | Esophagus | ESCC | 9.10e-04 | -4.40e-02 | 0.1149 |
| 8406 | SRPX | P16T-E | Human | Esophagus | ESCC | 5.53e-11 | 1.77e-01 | 0.1153 |
| 8406 | SRPX | P19T-E | Human | Esophagus | ESCC | 1.47e-02 | 6.49e-01 | 0.1662 |
| 8406 | SRPX | P21T-E | Human | Esophagus | ESCC | 1.45e-12 | 3.49e-01 | 0.1617 |
| 8406 | SRPX | P24T-E | Human | Esophagus | ESCC | 5.93e-06 | 3.60e-01 | 0.1287 |
| 8406 | SRPX | P26T-E | Human | Esophagus | ESCC | 1.51e-40 | 1.08e+00 | 0.1276 |
| 8406 | SRPX | P28T-E | Human | Esophagus | ESCC | 4.44e-06 | 2.89e-01 | 0.1149 |
| 8406 | SRPX | P31T-E | Human | Esophagus | ESCC | 4.59e-02 | -1.64e-02 | 0.1251 |
| 8406 | SRPX | P32T-E | Human | Esophagus | ESCC | 1.69e-64 | 1.42e+00 | 0.1666 |
| 8406 | SRPX | P37T-E | Human | Esophagus | ESCC | 1.22e-61 | 2.19e+00 | 0.1371 |
| 8406 | SRPX | P39T-E | Human | Esophagus | ESCC | 3.93e-02 | -6.65e-02 | 0.0894 |
| 8406 | SRPX | P40T-E | Human | Esophagus | ESCC | 6.26e-07 | 7.49e-01 | 0.109 |
| 8406 | SRPX | P44T-E | Human | Esophagus | ESCC | 2.67e-04 | 3.20e-01 | 0.1096 |
| 8406 | SRPX | P52T-E | Human | Esophagus | ESCC | 5.07e-21 | 7.67e-01 | 0.1555 |
| 8406 | SRPX | P76T-E | Human | Esophagus | ESCC | 6.37e-25 | 7.27e-01 | 0.1207 |
| 8406 | SRPX | P83T-E | Human | Esophagus | ESCC | 1.08e-11 | 5.20e-01 | 0.1738 |
| 8406 | SRPX | P89T-E | Human | Esophagus | ESCC | 1.89e-06 | 5.25e-01 | 0.1752 |
| 8406 | SRPX | P91T-E | Human | Esophagus | ESCC | 2.53e-09 | 1.34e+00 | 0.1828 |
| 8406 | SRPX | C04 | Human | Oral cavity | OSCC | 5.51e-04 | 6.10e-01 | 0.2633 |
| Page: 1 2 |
| Tissue | Expression Dynamics | Abbreviation |
| Esophagus | 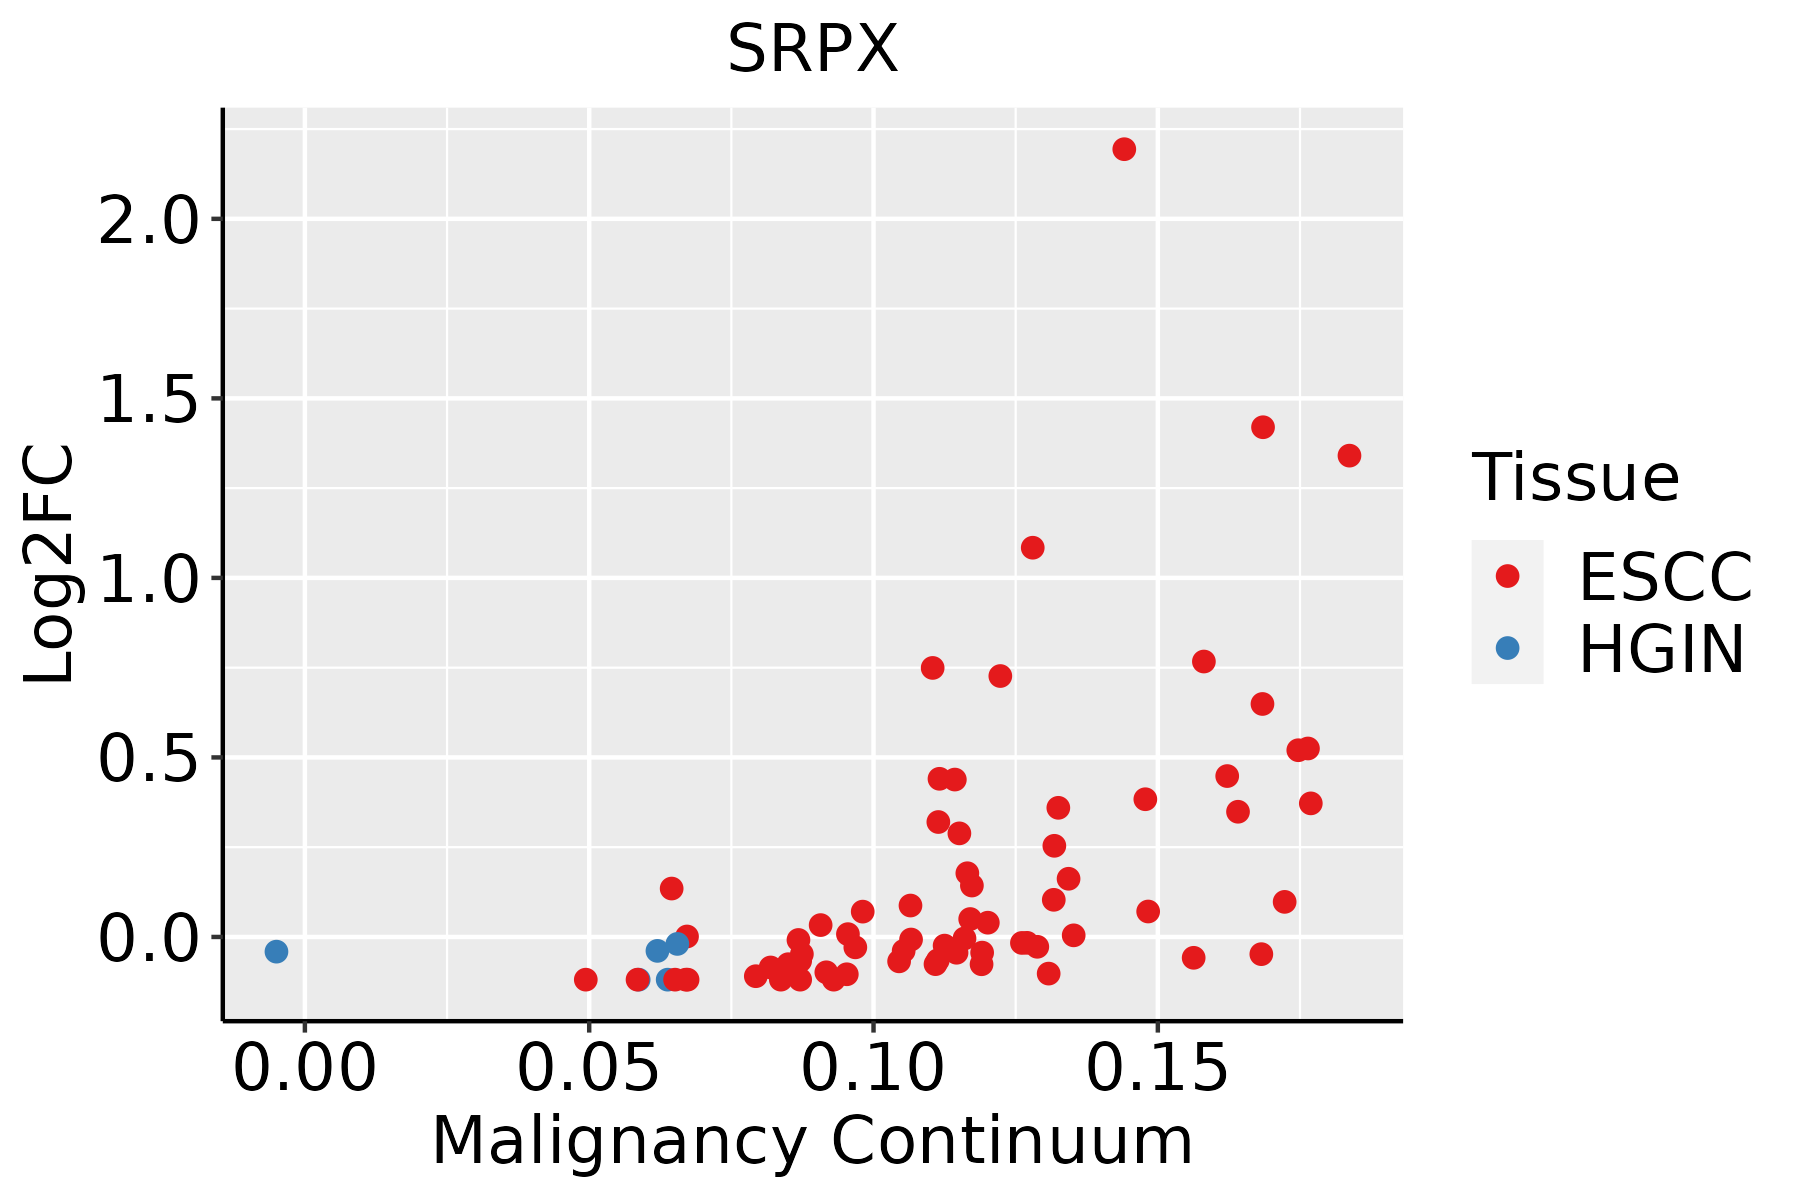 | ESCC: Esophageal squamous cell carcinoma |
| HGIN: High-grade intraepithelial neoplasias | ||
| LGIN: Low-grade intraepithelial neoplasias | ||
| Oral Cavity |  | EOLP: Erosive Oral lichen planus |
| LP: leukoplakia | ||
| NEOLP: Non-erosive oral lichen planus | ||
| OSCC: Oral squamous cell carcinoma | ||
| Thyroid | 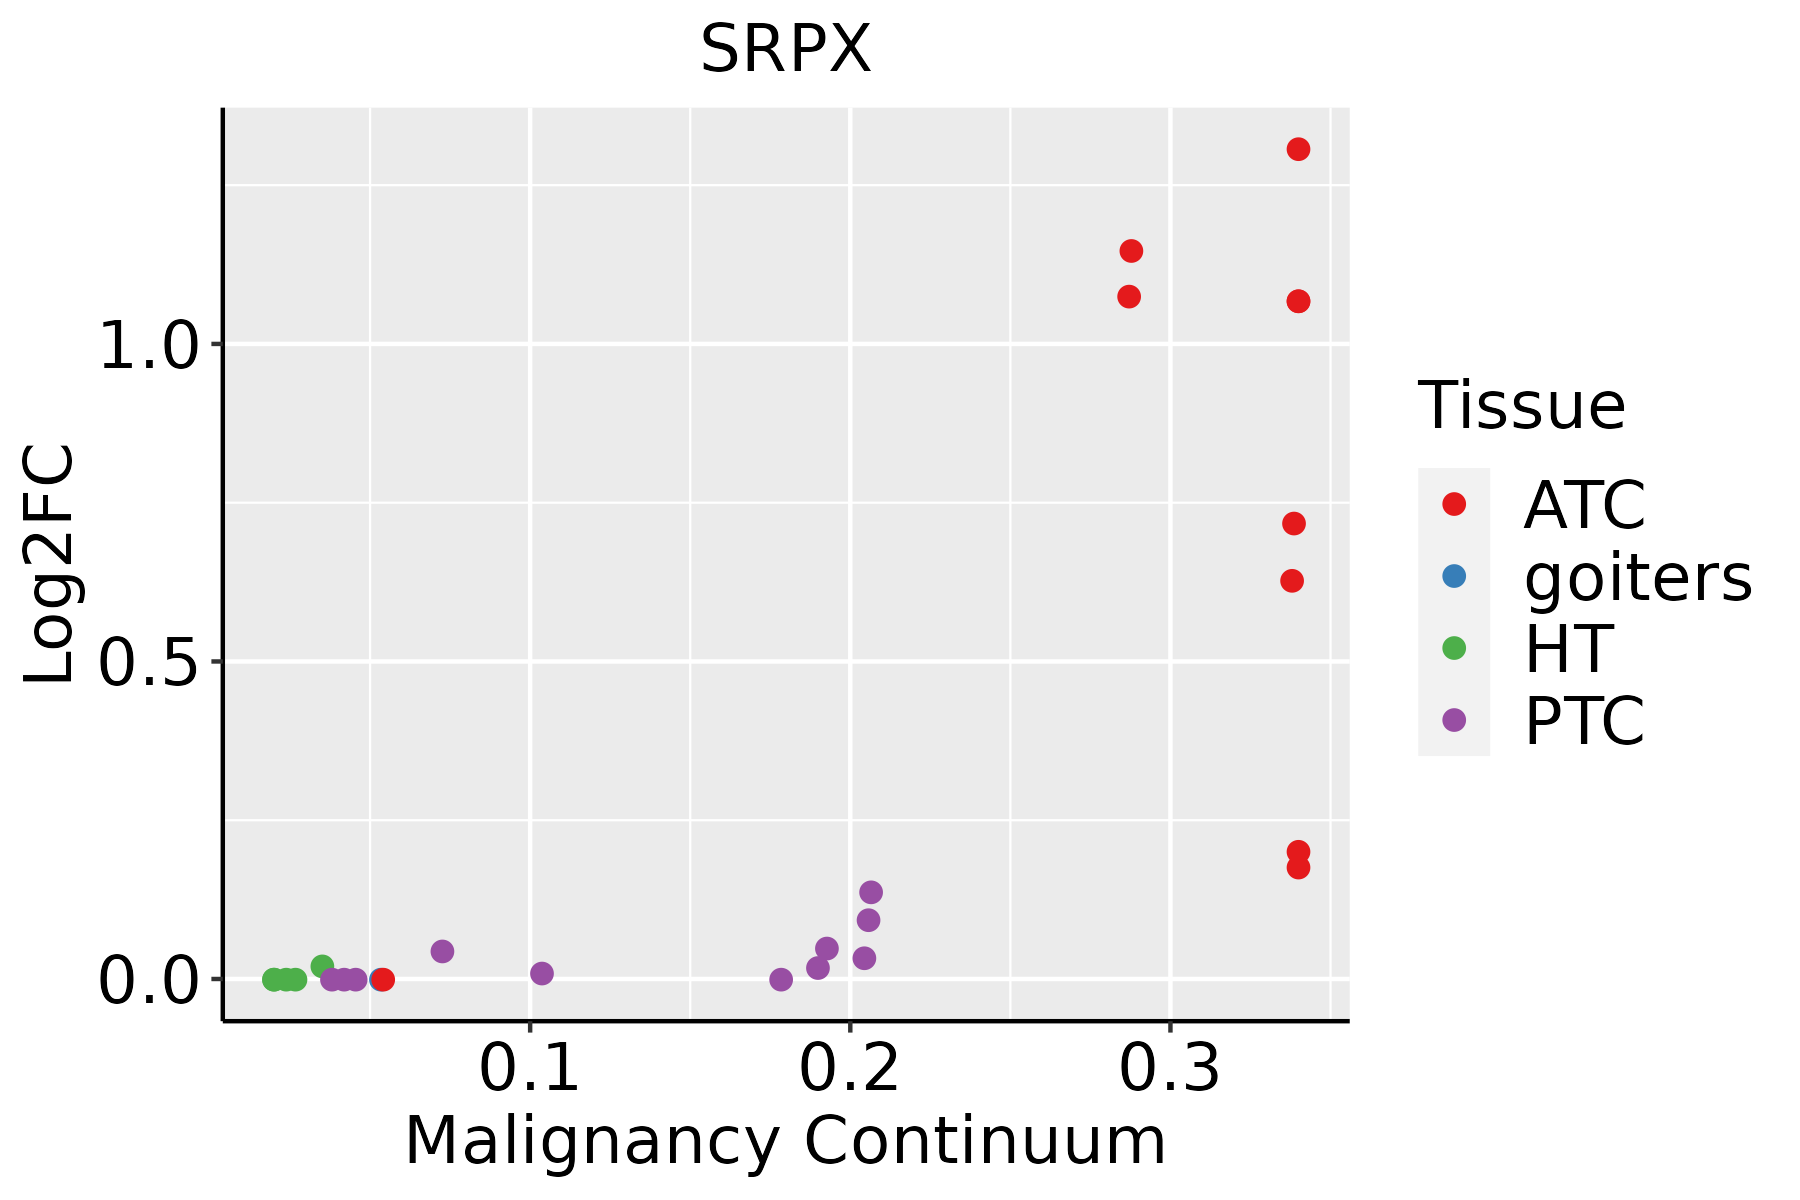 | ATC: Anaplastic thyroid cancer |
| HT: Hashimoto's thyroiditis | ||
| PTC: Papillary thyroid cancer |
| ∗log2FC in expression of this searched gene in stem-like cells from each diseased tissue sample relative to stem-like cells in normal samples in each tissue plotted against the malignancy continuum. Samples are colored based on if they are from different disease stage. |
Top |
Malignant transformation related pathway analysis |
| Find out the enriched GO biological processes and KEGG pathways involved in transition from healthy to precancer to cancer |
| Tissue | Disease Stage | Enriched GO biological Processes |
| Colorectum | AD |  |
| Colorectum | SER |  |
| Colorectum | MSS |  |
| Colorectum | MSI-H |  |
| Colorectum | FAP |  |
| ∗Top 15 enriched GO BP terms are showed in the bar plot of each disease state in each tissue. Each row represents a significant GO biological process which is colored according to the -log10(p.adjust). |
| Page: 1 2 3 4 5 6 7 8 9 |
| GO ID | Tissue | Disease Stage | Description | Gene Ratio | Bg Ratio | pvalue | p.adjust | Count |
| GO:0034329 | Colorectum | AD | cell junction assembly | 136/3918 | 420/18723 | 2.02e-08 | 1.15e-06 | 136 |
| GO:0001667 | Colorectum | AD | ameboidal-type cell migration | 137/3918 | 475/18723 | 2.17e-05 | 4.33e-04 | 137 |
| GO:0090132 | Colorectum | AD | epithelium migration | 105/3918 | 360/18723 | 1.18e-04 | 1.73e-03 | 105 |
| GO:0010632 | Colorectum | AD | regulation of epithelial cell migration | 88/3918 | 292/18723 | 1.19e-04 | 1.75e-03 | 88 |
| GO:0010631 | Colorectum | AD | epithelial cell migration | 104/3918 | 357/18723 | 1.33e-04 | 1.90e-03 | 104 |
| GO:0090130 | Colorectum | AD | tissue migration | 105/3918 | 365/18723 | 2.10e-04 | 2.77e-03 | 105 |
| GO:0010634 | Colorectum | AD | positive regulation of epithelial cell migration | 56/3918 | 176/18723 | 4.51e-04 | 5.03e-03 | 56 |
| GO:1901888 | Colorectum | AD | regulation of cell junction assembly | 61/3918 | 204/18723 | 1.50e-03 | 1.27e-02 | 61 |
| GO:0043542 | Colorectum | AD | endothelial cell migration | 78/3918 | 279/18723 | 2.97e-03 | 2.22e-02 | 78 |
| GO:0050808 | Colorectum | AD | synapse organization | 112/3918 | 426/18723 | 4.25e-03 | 2.92e-02 | 112 |
| GO:0050807 | Colorectum | AD | regulation of synapse organization | 60/3918 | 211/18723 | 5.67e-03 | 3.64e-02 | 60 |
| GO:0010595 | Colorectum | AD | positive regulation of endothelial cell migration | 40/3918 | 133/18723 | 8.01e-03 | 4.73e-02 | 40 |
| GO:00343292 | Colorectum | MSS | cell junction assembly | 120/3467 | 420/18723 | 2.51e-07 | 1.07e-05 | 120 |
| GO:00016672 | Colorectum | MSS | ameboidal-type cell migration | 120/3467 | 475/18723 | 1.37e-04 | 2.05e-03 | 120 |
| GO:00901322 | Colorectum | MSS | epithelium migration | 93/3467 | 360/18723 | 3.30e-04 | 4.24e-03 | 93 |
| GO:00106312 | Colorectum | MSS | epithelial cell migration | 92/3467 | 357/18723 | 3.87e-04 | 4.86e-03 | 92 |
| GO:00106322 | Colorectum | MSS | regulation of epithelial cell migration | 77/3467 | 292/18723 | 5.39e-04 | 6.04e-03 | 77 |
| GO:00901302 | Colorectum | MSS | tissue migration | 93/3467 | 365/18723 | 5.42e-04 | 6.06e-03 | 93 |
| GO:00106342 | Colorectum | MSS | positive regulation of epithelial cell migration | 50/3467 | 176/18723 | 8.50e-04 | 8.75e-03 | 50 |
| GO:00435422 | Colorectum | MSS | endothelial cell migration | 70/3467 | 279/18723 | 3.69e-03 | 2.71e-02 | 70 |
| Page: 1 2 3 4 5 6 |
| Pathway ID | Tissue | Disease Stage | Description | Gene Ratio | Bg Ratio | pvalue | p.adjust | qvalue | Count |
| Page: 1 |
Top |
Cell-cell communication analysis |
| Identification of potential cell-cell interactions between two cell types and their ligand-receptor pairs for different disease states |
| Ligand | Receptor | LRpair | Pathway | Tissue | Disease Stage |
| Page: 1 |
Top |
Single-cell gene regulatory network inference analysis |
| Find out the significant the regulons (TFs) and the target genes of each regulon across cell types for different disease states |
| TF | Cell Type | Tissue | Disease Stage | Target Gene | RSS | Regulon Activity |
| ∗The dot plots of a searched regulon are shown for all cell subpopulations in each disease state of each tissue based on the regulon specific score inferred using pySCENIC and by calculating the average expression. |
| Page: 1 |
Top |
Somatic mutation of malignant transformation related genes |
| Annotation of somatic variants for genes involved in malignant transformation |
| Hugo Symbol | Variant Class | Variant Classification | dbSNP RS | HGVSc | HGVSp | HGVSp Short | SWISSPROT | BIOTYPE | SIFT | PolyPhen | Tumor Sample Barcode | Tissue | Histology | Sex | Age | Stage | Therapy Types | Drugs | Outcome |
| SRPX | SNV | Missense_Mutation | c.614N>T | p.Thr205Ile | p.T205I | P78539 | protein_coding | deleterious(0.02) | possibly_damaging(0.792) | TCGA-AN-A0AK-01 | Breast | breast invasive carcinoma | Female | >=65 | I/II | Unknown | Unknown | SD | |
| SRPX | insertion | Nonsense_Mutation | novel | c.1228_1229insAGGGGGTCTGAGTCTTTGACT | p.Pro410delinsGlnGlyValTerValPheAspSer | p.P410delinsQGV*VFDS | P78539 | protein_coding | TCGA-AO-A0JB-01 | Breast | breast invasive carcinoma | Female | <65 | III/IV | Chemotherapy | cyclophosphamide | SD | ||
| SRPX | insertion | In_Frame_Ins | novel | c.1226_1227insGATTGG | p.Ile409delinsMetIleGly | p.I409delinsMIG | P78539 | protein_coding | TCGA-AO-A0JB-01 | Breast | breast invasive carcinoma | Female | <65 | III/IV | Chemotherapy | cyclophosphamide | SD | ||
| SRPX | SNV | Missense_Mutation | novel | c.76C>G | p.Pro26Ala | p.P26A | P78539 | protein_coding | tolerated(0.76) | benign(0.003) | TCGA-JW-AAVH-01 | Cervix | cervical & endocervical cancer | Female | <65 | I/II | Unknown | Unknown | SD |
| SRPX | SNV | Missense_Mutation | c.375N>A | p.Met125Ile | p.M125I | P78539 | protein_coding | tolerated(0.17) | probably_damaging(0.977) | TCGA-A6-5659-01 | Colorectum | colon adenocarcinoma | Male | >=65 | I/II | Unknown | Unknown | SD | |
| SRPX | SNV | Missense_Mutation | c.391N>C | p.Phe131Leu | p.F131L | P78539 | protein_coding | tolerated(0.13) | possibly_damaging(0.524) | TCGA-AA-3492-01 | Colorectum | colon adenocarcinoma | Female | >=65 | I/II | Unknown | Unknown | SD | |
| SRPX | SNV | Missense_Mutation | c.569N>A | p.Arg190His | p.R190H | P78539 | protein_coding | deleterious(0) | possibly_damaging(0.841) | TCGA-AA-3672-01 | Colorectum | colon adenocarcinoma | Female | >=65 | III/IV | Unknown | Unknown | SD | |
| SRPX | SNV | Missense_Mutation | rs761387679 | c.263N>A | p.Arg88His | p.R88H | P78539 | protein_coding | tolerated(0.14) | possibly_damaging(0.882) | TCGA-AA-A00N-01 | Colorectum | colon adenocarcinoma | Male | >=65 | I/II | Unknown | Unknown | PD |
| SRPX | SNV | Missense_Mutation | c.793C>A | p.Leu265Ile | p.L265I | P78539 | protein_coding | deleterious(0.01) | probably_damaging(0.998) | TCGA-CA-6715-01 | Colorectum | colon adenocarcinoma | Male | <65 | III/IV | Chemotherapy | oxaliplatin | CR | |
| SRPX | SNV | Missense_Mutation | rs771233820 | c.197N>T | p.Asp66Val | p.D66V | P78539 | protein_coding | tolerated(0.17) | benign(0.227) | TCGA-CK-4951-01 | Colorectum | colon adenocarcinoma | Female | >=65 | I/II | Unknown | Unknown | PD |
| Page: 1 2 3 4 5 6 7 |
Top |
Related drugs of malignant transformation related genes |
| Identification of chemicals and drugs interact with genes involved in malignant transfromation |
| (DGIdb 4.0) |
| Entrez ID | Symbol | Category | Interaction Types | Drug Claim Name | Drug Name | PMIDs |
| Page: 1 |

Copyright 2023-Present -The University of Texas Health Science Center at Houston |