Schematic overview of the cellular and molecular mechanisms involved in the cancer progression, including the proposed cellular and molecular mechanisms in cancer cells trajectory. AT1: alveolar type 1 cells; AT2: alveolar type 2 cells; AAH: atypical adenomatous hyperplasia; AIS: adenocarcinoma in situ; MIA: minimally invasive adenocarcinoma; IA: invasive adenocarcinoma; EMT: epithelial-mesenchymal transition

Home

Download

Statistics

Help

Contact

Center for Computational Systems Medicine
leaf

Gene summary

leaf

Malignant transformation analysis

leaf

Malignant transformation related pathway analysis

leaf

Cell-cell communication analysis

leaf

Single-cell gene regulatory network inference analysis

leaf

Somatic mutation of malignant transformation related genes

leaf

Related drugs of malignant transformation related genes

Gene: SRPK1

Gene summary for SRPK1

check button Gene summary.

Gene informationSpeciesHuman
Gene symbol

SRPK1

Gene ID

6732

Gene nameSRSF protein kinase 1
Gene AliasSFRSK1
Cytomap6p21.31
Gene Typeprotein-coding
GO ID

GO:0000003

UniProtAcc

Q96SB4


Top

Malignant transformation analysis

check button Identification of the aberrant gene expression in precancerous and cancerous lesions by comparing the gene expression of stem-like cells in diseased tissues with normal stem cells
check button Malignant transformation involving gene list.
Entrez IDSymbolReplicatesSpeciesOrganTissueAdj P-valueLog2FCMalignancy
6732SRPK1CA_HPV_3HumanCervixCC3.29e-028.55e-020.0414
6732SRPK1CCI_1HumanCervixCC2.03e-036.00e-010.528
6732SRPK1CCI_2HumanCervixCC1.21e-036.95e-010.5249
6732SRPK1CCI_3HumanCervixCC1.30e-024.39e-010.516
6732SRPK1HTA11_3410_2000001011HumanColorectumAD7.19e-11-4.37e-010.0155
6732SRPK1HTA11_2487_2000001011HumanColorectumSER9.38e-06-5.00e-01-0.1808
6732SRPK1HTA11_5216_2000001011HumanColorectumSER6.63e-06-6.00e-01-0.1462
6732SRPK1HTA11_99999965062_69753HumanColorectumMSI-H1.51e-086.60e-010.3487
6732SRPK1HTA11_99999965104_69814HumanColorectumMSS5.02e-055.61e-010.281
6732SRPK1HTA11_99999974143_84620HumanColorectumMSS5.03e-04-3.54e-010.3005
6732SRPK1A002-C-010HumanColorectumFAP3.98e-023.79e-020.242
6732SRPK1A001-C-207HumanColorectumFAP1.32e-06-2.45e-010.1278
6732SRPK1A015-C-203HumanColorectumFAP3.20e-31-1.16e-01-0.1294
6732SRPK1A015-C-204HumanColorectumFAP1.27e-10-3.56e-01-0.0228
6732SRPK1A014-C-040HumanColorectumFAP1.06e-06-2.71e-01-0.1184
6732SRPK1A002-C-201HumanColorectumFAP2.04e-17-2.91e-010.0324
6732SRPK1A002-C-203HumanColorectumFAP2.71e-07-3.35e-010.2786
6732SRPK1A001-C-119HumanColorectumFAP1.07e-11-5.02e-02-0.1557
6732SRPK1A001-C-108HumanColorectumFAP1.12e-16-1.97e-01-0.0272
6732SRPK1A002-C-205HumanColorectumFAP1.53e-29-7.03e-02-0.1236
Page: 1 2 3 4 5 6 7 8 9 10 

check button Transcriptomic changes along malignancy continuum.
TissueExpression DynamicsAbbreviation
CervixThe image shows the transcriptomic changes along malignancy continuum.log2FC in expression of this searched gene in stem-like cells from each diseased tissue sample relative to stem-like cells in normal samples in each tissue plotted against the malignancy continuum. Samples are colored based on if they are from different disease stage.CC: Cervix cancer
HSIL_HPV: HPV-infected high-grade squamous intraepithelial lesions
N_HPV: HPV-infected normal cervix
Colorectum (GSE201348)The image shows the transcriptomic changes along malignancy continuum.log2FC in expression of this searched gene in stem-like cells from each diseased tissue sample relative to stem-like cells in normal samples in each tissue plotted against the malignancy continuum. Samples are colored based on if they are from different disease stage.FAP: Familial adenomatous polyposis
CRC: Colorectal cancer
Colorectum (HTA11)The image shows the transcriptomic changes along malignancy continuum.log2FC in expression of this searched gene in stem-like cells from each diseased tissue sample relative to stem-like cells in normal samples in each tissue plotted against the malignancy continuum. Samples are colored based on if they are from different disease stage.AD: Adenomas
SER: Sessile serrated lesions
MSI-H: Microsatellite-high colorectal cancer
MSS: Microsatellite stable colorectal cancer
EsophagusThe image shows the transcriptomic changes along malignancy continuum.log2FC in expression of this searched gene in stem-like cells from each diseased tissue sample relative to stem-like cells in normal samples in each tissue plotted against the malignancy continuum. Samples are colored based on if they are from different disease stage.
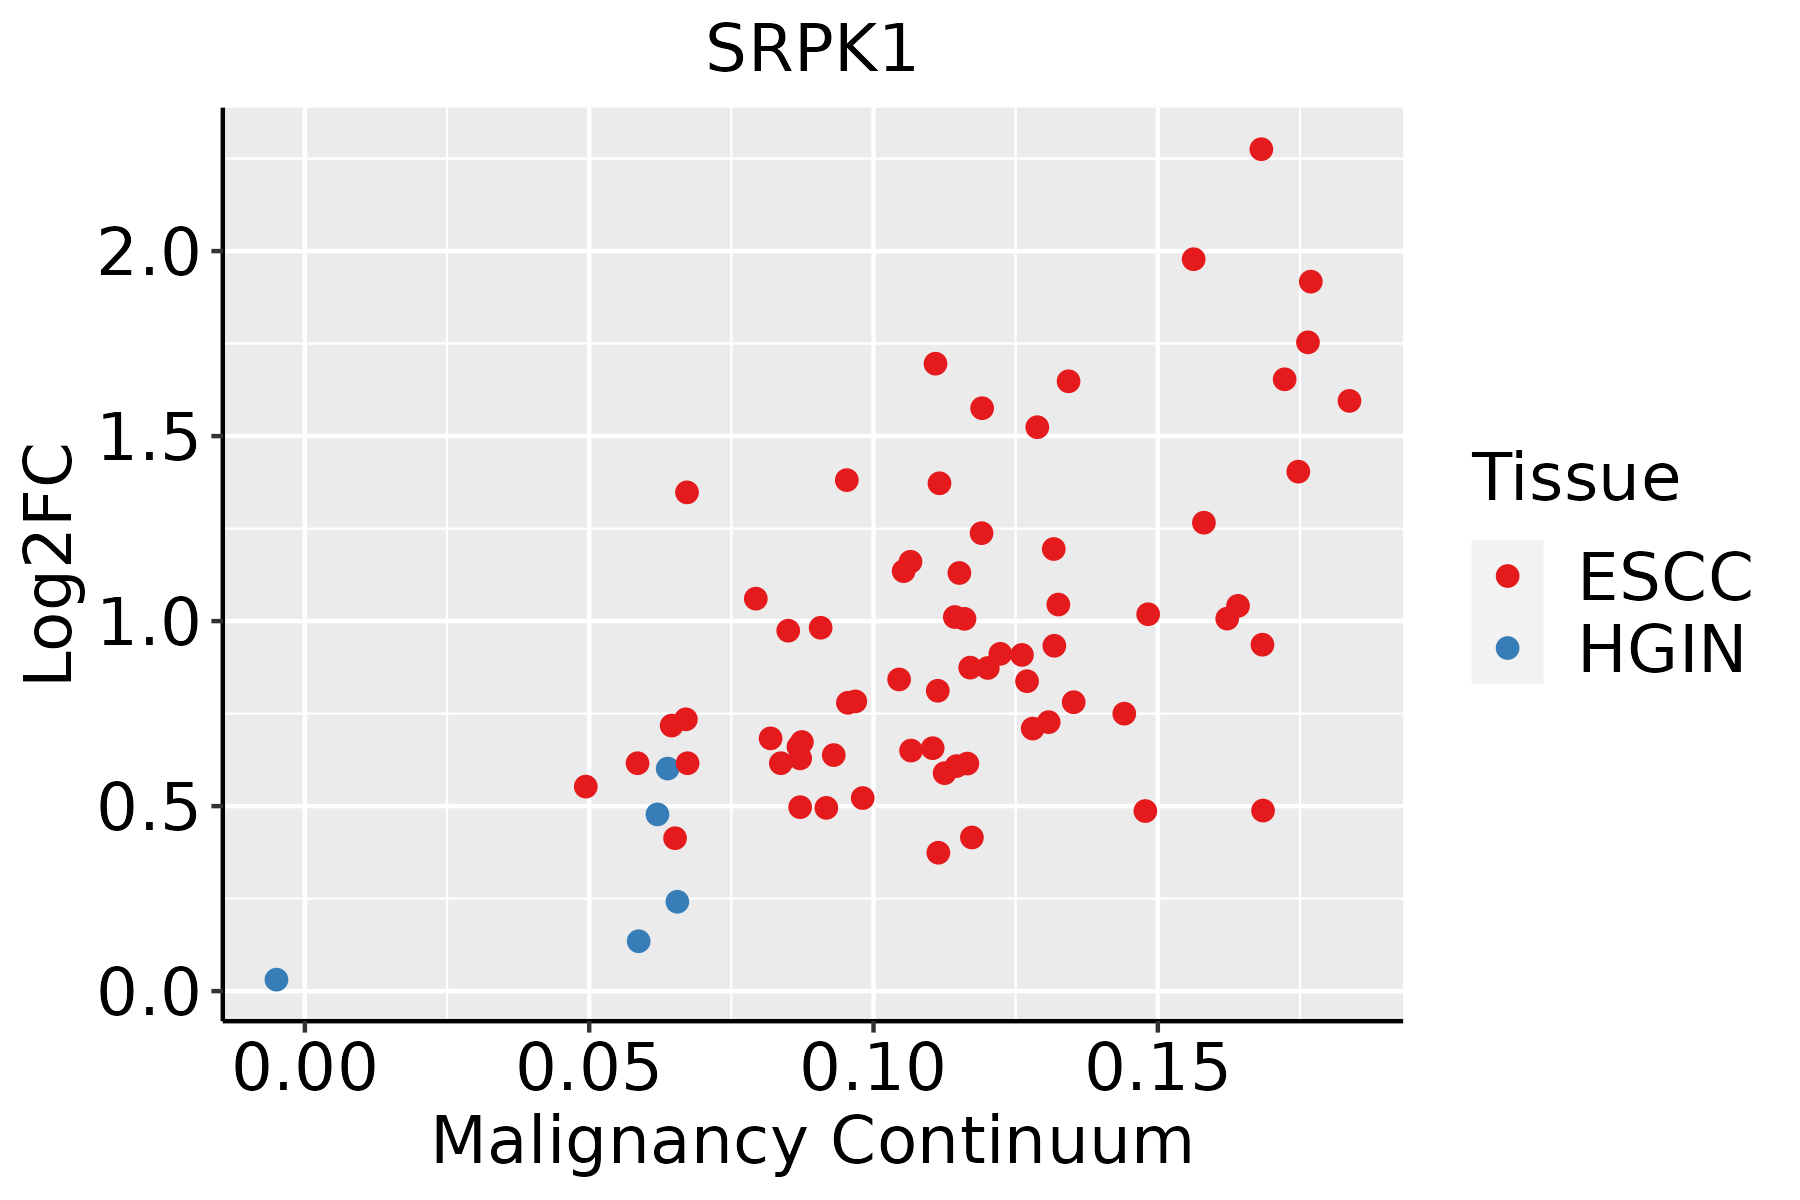
ESCC: Esophageal squamous cell carcinoma
HGIN: High-grade intraepithelial neoplasias
LGIN: Low-grade intraepithelial neoplasias
LiverThe image shows the transcriptomic changes along malignancy continuum.log2FC in expression of this searched gene in stem-like cells from each diseased tissue sample relative to stem-like cells in normal samples in each tissue plotted against the malignancy continuum. Samples are colored based on if they are from different disease stage.HCC: Hepatocellular carcinoma
NAFLD: Non-alcoholic fatty liver disease
LungThe image shows the transcriptomic changes along malignancy continuum.log2FC in expression of this searched gene in stem-like cells from each diseased tissue sample relative to stem-like cells in normal samples in each tissue plotted against the malignancy continuum. Samples are colored based on if they are from different disease stage.
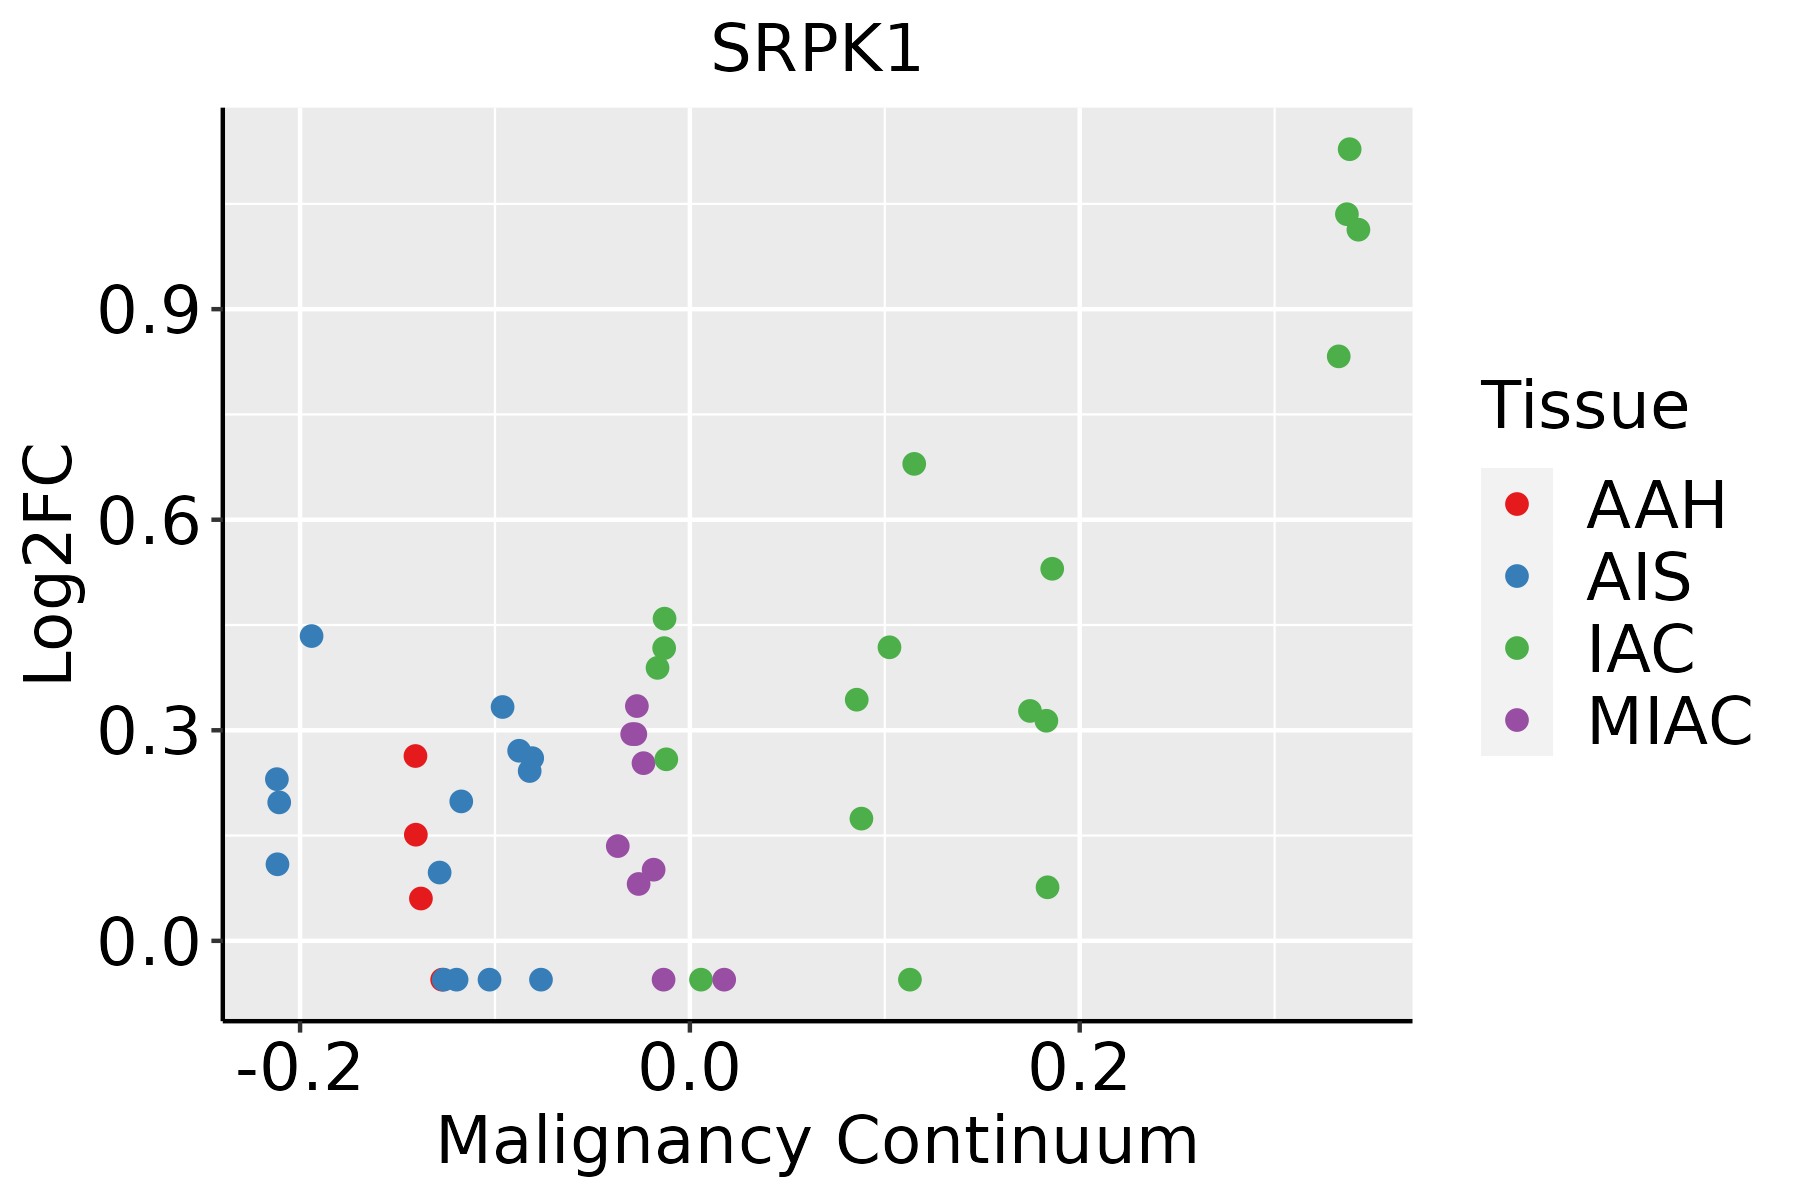
AAH: Atypical adenomatous hyperplasia
AIS: Adenocarcinoma in situ
IAC: Invasive lung adenocarcinoma
MIA: Minimally invasive adenocarcinoma
Oral CavityThe image shows the transcriptomic changes along malignancy continuum.log2FC in expression of this searched gene in stem-like cells from each diseased tissue sample relative to stem-like cells in normal samples in each tissue plotted against the malignancy continuum. Samples are colored based on if they are from different disease stage.
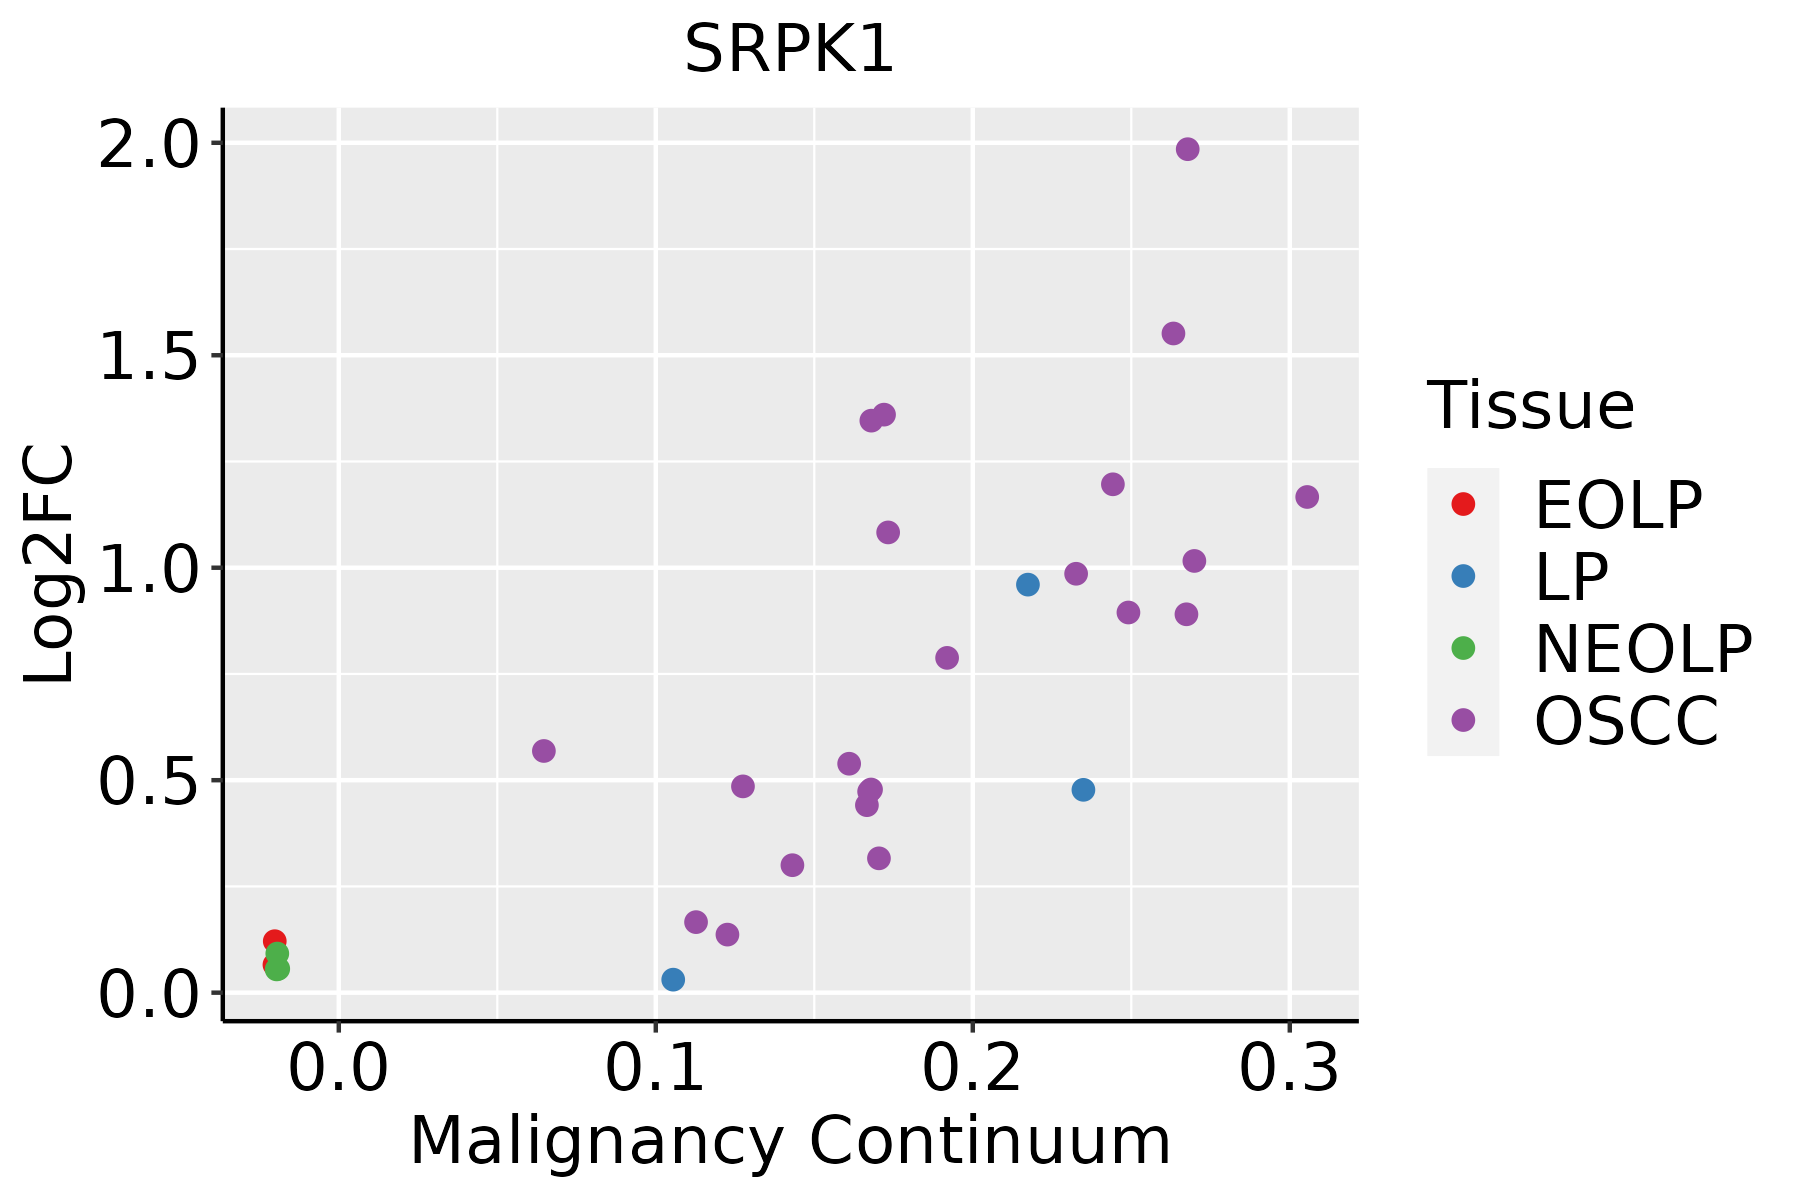
EOLP: Erosive Oral lichen planus
LP: leukoplakia
NEOLP: Non-erosive oral lichen planus
OSCC: Oral squamous cell carcinoma
ProstateThe image shows the transcriptomic changes along malignancy continuum.log2FC in expression of this searched gene in stem-like cells from each diseased tissue sample relative to stem-like cells in normal samples in each tissue plotted against the malignancy continuum. Samples are colored based on if they are from different disease stage.
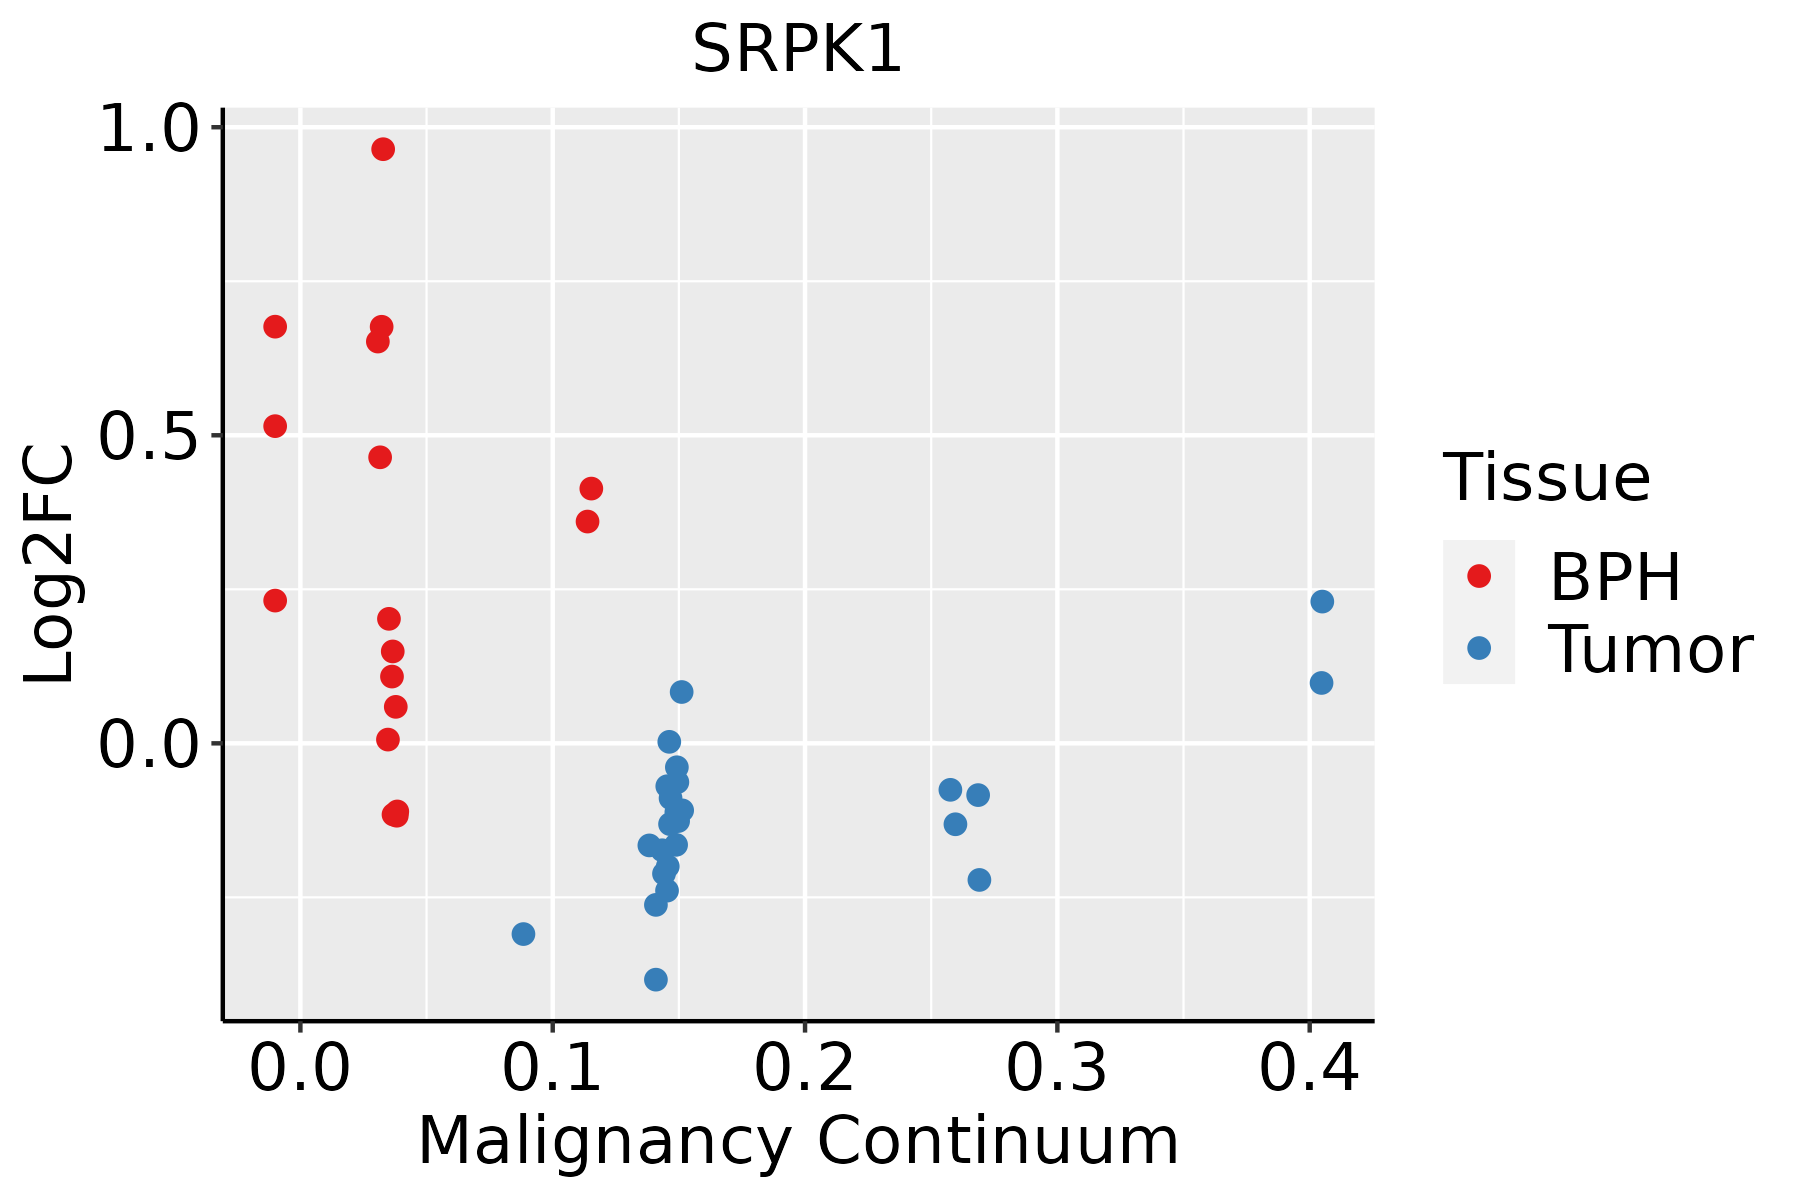
BPH: Benign Prostatic Hyperplasia
SkinThe image shows the transcriptomic changes along malignancy continuum.log2FC in expression of this searched gene in stem-like cells from each diseased tissue sample relative to stem-like cells in normal samples in each tissue plotted against the malignancy continuum. Samples are colored based on if they are from different disease stage.AK: Actinic keratosis
cSCC: Cutaneous squamous cell carcinoma
SCCIS:squamous cell carcinoma in situ
ThyroidThe image shows the transcriptomic changes along malignancy continuum.log2FC in expression of this searched gene in stem-like cells from each diseased tissue sample relative to stem-like cells in normal samples in each tissue plotted against the malignancy continuum. Samples are colored based on if they are from different disease stage.ATC: Anaplastic thyroid cancer
HT: Hashimoto's thyroiditis
PTC: Papillary thyroid cancer
∗log2FC in expression of this searched gene in stem-like cells from each diseased tissue sample relative to stem-like cells in normal samples in each tissue plotted against the malignancy continuum. Samples are colored based on if they are from different disease stage.

Top

Malignant transformation related pathway analysis

check buttonFind out the enriched GO biological processes and KEGG pathways involved in transition from healthy to precancer to cancer
check button Figure of enriched GO biological processes.
TissueDisease StageEnriched GO biological Processes
ColorectumADGO analysis - Figure of enriched GO biological processes: Top 15 enriched GO BP terms are showed in the bar plot of each disease state in each tissue. Each row represents a significant GO biological process which is colored according to the -log10(p.adjust).
ColorectumSERGO analysis - Figure of enriched GO biological processes: Top 15 enriched GO BP terms are showed in the bar plot of each disease state in each tissue. Each row represents a significant GO biological process which is colored according to the -log10(p.adjust).
ColorectumMSSGO analysis - Figure of enriched GO biological processes: Top 15 enriched GO BP terms are showed in the bar plot of each disease state in each tissue. Each row represents a significant GO biological process which is colored according to the -log10(p.adjust).
ColorectumMSI-HGO analysis - Figure of enriched GO biological processes: Top 15 enriched GO BP terms are showed in the bar plot of each disease state in each tissue. Each row represents a significant GO biological process which is colored according to the -log10(p.adjust).
ColorectumFAPGO analysis - Figure of enriched GO biological processes: Top 15 enriched GO BP terms are showed in the bar plot of each disease state in each tissue. Each row represents a significant GO biological process which is colored according to the -log10(p.adjust).
∗Top 15 enriched GO BP terms are showed in the bar plot of each disease state in each tissue. Each row represents a significant GO biological process which is colored according to the -log10(p.adjust).
Page: 1 2 3 4 5 6 7 8 9 

check button Enriched GO biological processes.
GO IDTissueDisease StageDescriptionGene RatioBg Ratiopvaluep.adjustCount
GO:001603210CervixCCviral process109/2311415/187235.40e-156.46e-12109
GO:001905810CervixCCviral life cycle87/2311317/187232.20e-131.20e-1087
GO:004348410CervixCCregulation of RNA splicing42/2311148/187231.25e-076.24e-0642
GO:19033119CervixCCregulation of mRNA metabolic process64/2311288/187231.71e-065.64e-0564
GO:001907910CervixCCviral genome replication35/2311131/187236.11e-061.49e-0435
GO:002261310CervixCCribonucleoprotein complex biogenesis88/2311463/187232.11e-053.82e-0488
GO:004802410CervixCCregulation of mRNA splicing, via spliceosome28/2311101/187232.41e-054.19e-0428
GO:002261810CervixCCribonucleoprotein complex assembly49/2311220/187232.52e-054.29e-0449
GO:00063257CervixCCchromatin organization78/2311409/187235.40e-058.02e-0478
GO:007182610CervixCCribonucleoprotein complex subunit organization49/2311227/187235.91e-058.54e-0449
GO:005079210CervixCCregulation of viral process38/2311164/187238.12e-051.10e-0338
GO:00506849CervixCCregulation of mRNA processing33/2311137/187231.06e-041.35e-0333
GO:190390010CervixCCregulation of viral life cycle33/2311148/187234.86e-044.76e-0333
GO:00485256CervixCCnegative regulation of viral process23/231192/187236.39e-045.97e-0323
GO:000838010CervixCCRNA splicing76/2311434/187239.79e-048.19e-0376
GO:00450698CervixCCregulation of viral genome replication21/231185/187231.27e-031.01e-0221
GO:00450714CervixCCnegative regulation of viral genome replication15/231156/187232.60e-031.80e-0215
GO:000037710CervixCCRNA splicing, via transesterification reactions with bulged adenosine as nucleophile55/2311320/187236.71e-033.70e-0255
GO:000039810CervixCCmRNA splicing, via spliceosome55/2311320/187236.71e-033.70e-0255
GO:000037510CervixCCRNA splicing, via transesterification reactions55/2311324/187238.61e-034.44e-0255
Page: 1 2 3 4 5 6 7 8 9 10 11 12 13 14 15 16 17 18 19 20 21 

check button Enriched KEGG pathways.
Pathway IDTissueDisease StageDescriptionGene RatioBg Ratiopvaluep.adjustqvalueCount
Page: 1 

Top

Cell-cell communication analysis

check buttonIdentification of potential cell-cell interactions between two cell types and their ligand-receptor pairs for different disease states
LigandReceptorLRpairPathwayTissueDisease Stage
Page: 1 

Top

Single-cell gene regulatory network inference analysis

check buttonFind out the significant the regulons (TFs) and the target genes of each regulon across cell types for different disease states
TFCell TypeTissueDisease StageTarget GeneRSSRegulon Activity
∗The dot plots of a searched regulon are shown for all cell subpopulations in each disease state of each tissue based on the regulon specific score inferred using pySCENIC and by calculating the average expression.
Page: 1 

Top

Somatic mutation of malignant transformation related genes

check buttonAnnotation of somatic variants for genes involved in malignant transformation
Hugo SymbolVariant ClassVariant ClassificationdbSNP RSHGVScHGVSpHGVSp ShortSWISSPROTBIOTYPESIFTPolyPhenTumor Sample BarcodeTissueHistologySexAgeStageTherapy TypesDrugsOutcome
SRPK1SNVMissense_Mutationc.1640N>Tp.Gly547Valp.G547VQ96SB4protein_codingdeleterious(0)probably_damaging(0.944)TCGA-A2-A04P-01Breastbreast invasive carcinomaFemale<65III/IVChemotherapytaxolPD
SRPK1SNVMissense_Mutationrs773631165c.1756N>Ap.Tyr586Asnp.Y586NQ96SB4protein_codingdeleterious(0.05)probably_damaging(0.998)TCGA-A7-A0DA-01Breastbreast invasive carcinomaFemale<65I/IIChemotherapyadriamycinSD
SRPK1SNVMissense_Mutationrs371124622c.251G>Ap.Arg84Glnp.R84QQ96SB4protein_codingdeleterious(0.01)benign(0.098)TCGA-AC-A23H-01Breastbreast invasive carcinomaFemale>=65I/IIUnknownUnknownPD
SRPK1SNVMissense_Mutationc.154G>Cp.Asp52Hisp.D52HQ96SB4protein_codingdeleterious(0)probably_damaging(0.993)TCGA-AR-A0TX-01Breastbreast invasive carcinomaFemale<65I/IIUnknownUnknownSD
SRPK1SNVMissense_Mutationrs773631165c.1756N>Ap.Tyr586Asnp.Y586NQ96SB4protein_codingdeleterious(0.05)probably_damaging(0.998)TCGA-AR-A255-01Breastbreast invasive carcinomaFemale<65I/IITargeted Molecular therapytrastuzumabSD
SRPK1SNVMissense_Mutationnovelc.781G>Cp.Asp261Hisp.D261HQ96SB4protein_codingtolerated(0.09)possibly_damaging(0.889)TCGA-BH-A0AW-01Breastbreast invasive carcinomaFemale<65I/IIChemotherapycarboplatinSD
SRPK1SNVMissense_Mutationc.1019A>Gp.Gln340Argp.Q340RQ96SB4protein_codingtolerated(0.47)benign(0.015)TCGA-BH-A0HA-01Breastbreast invasive carcinomaFemale<65I/IIUnknownUnknownSD
SRPK1SNVMissense_Mutationc.1462G>Ap.Ala488Thrp.A488TQ96SB4protein_codingdeleterious(0.03)probably_damaging(0.998)TCGA-D8-A147-01Breastbreast invasive carcinomaFemale<65I/IIChemotherapydoxorubicineSD
SRPK1SNVMissense_Mutationnovelc.553N>Gp.Pro185Alap.P185AQ96SB4protein_codingdeleterious(0.01)probably_damaging(0.999)TCGA-C5-A8YQ-01Cervixcervical & endocervical cancerFemale>=65I/IIChemotherapycisplatinPD
SRPK1SNVMissense_Mutationrs749597130c.1912N>Gp.Pro638Alap.P638AQ96SB4protein_codingdeleterious(0)probably_damaging(0.997)TCGA-AA-3833-01Colorectumcolon adenocarcinomaFemale<65I/IIUnknownUnknownSD
Page: 1 2 3 4 5 6 7 

Top

Related drugs of malignant transformation related genes

check buttonIdentification of chemicals and drugs interact with genes involved in malignant transfromation
(DGIdb 4.0)
Entrez IDSymbolCategoryInteraction TypesDrug Claim NameDrug NamePMIDs
6732SRPK1KINASE, SERINE THREONINE KINASE, ENZYME, DRUGGABLE GENOMETAE-684TAE-684
6732SRPK1KINASE, SERINE THREONINE KINASE, ENZYME, DRUGGABLE GENOMEDOVITINIBDOVITINIB
6732SRPK1KINASE, SERINE THREONINE KINASE, ENZYME, DRUGGABLE GENOMESNS-314SNS-314
6732SRPK1KINASE, SERINE THREONINE KINASE, ENZYME, DRUGGABLE GENOMEPF-562271PF-00562271
6732SRPK1KINASE, SERINE THREONINE KINASE, ENZYME, DRUGGABLE GENOMEALISERTIBALISERTIB
6732SRPK1KINASE, SERINE THREONINE KINASE, ENZYME, DRUGGABLE GENOMEinhibitorHESPERADINHESPERADIN19035792
6732SRPK1KINASE, SERINE THREONINE KINASE, ENZYME, DRUGGABLE GENOMELINIFANIBLINIFANIB
6732SRPK1KINASE, SERINE THREONINE KINASE, ENZYME, DRUGGABLE GENOMESphinx
6732SRPK1KINASE, SERINE THREONINE KINASE, ENZYME, DRUGGABLE GENOMEZINC959121
6732SRPK1KINASE, SERINE THREONINE KINASE, ENZYME, DRUGGABLE GENOMEinhibitor249565868
Page: 1 2