
|
|||||
|
 | |
| |
| |
| |
| |
| |
|
Gene: SRP68 |
Gene summary for SRP68 |
| Gene information | Species | Human | Gene symbol | SRP68 | Gene ID | 6730 |
| Gene name | signal recognition particle 68 | |
| Gene Alias | SRP68 | |
| Cytomap | 17q25.1 | |
| Gene Type | protein-coding | GO ID | GO:0006605 | UniProtAcc | Q9UHB9 |
Top |
Malignant transformation analysis |
| Identification of the aberrant gene expression in precancerous and cancerous lesions by comparing the gene expression of stem-like cells in diseased tissues with normal stem cells |
| Entrez ID | Symbol | Replicates | Species | Organ | Tissue | Adj P-value | Log2FC | Malignancy |
| 6730 | SRP68 | LZE2T | Human | Esophagus | ESCC | 3.57e-04 | 3.81e-01 | 0.082 |
| 6730 | SRP68 | LZE4T | Human | Esophagus | ESCC | 6.85e-13 | 2.34e-01 | 0.0811 |
| 6730 | SRP68 | LZE7T | Human | Esophagus | ESCC | 4.06e-02 | 2.34e-01 | 0.0667 |
| 6730 | SRP68 | LZE20T | Human | Esophagus | ESCC | 3.94e-06 | 1.21e-01 | 0.0662 |
| 6730 | SRP68 | LZE24T | Human | Esophagus | ESCC | 3.20e-10 | 4.22e-01 | 0.0596 |
| 6730 | SRP68 | P2T-E | Human | Esophagus | ESCC | 9.84e-34 | 5.17e-01 | 0.1177 |
| 6730 | SRP68 | P4T-E | Human | Esophagus | ESCC | 3.92e-17 | 3.53e-01 | 0.1323 |
| 6730 | SRP68 | P5T-E | Human | Esophagus | ESCC | 7.76e-12 | 8.93e-02 | 0.1327 |
| 6730 | SRP68 | P8T-E | Human | Esophagus | ESCC | 2.36e-18 | 3.61e-01 | 0.0889 |
| 6730 | SRP68 | P9T-E | Human | Esophagus | ESCC | 5.50e-13 | 3.46e-01 | 0.1131 |
| 6730 | SRP68 | P10T-E | Human | Esophagus | ESCC | 3.42e-21 | 3.59e-01 | 0.116 |
| 6730 | SRP68 | P11T-E | Human | Esophagus | ESCC | 5.11e-19 | 1.00e+00 | 0.1426 |
| 6730 | SRP68 | P12T-E | Human | Esophagus | ESCC | 9.04e-33 | 7.38e-01 | 0.1122 |
| 6730 | SRP68 | P15T-E | Human | Esophagus | ESCC | 2.31e-27 | 6.99e-01 | 0.1149 |
| 6730 | SRP68 | P16T-E | Human | Esophagus | ESCC | 5.29e-32 | 5.69e-01 | 0.1153 |
| 6730 | SRP68 | P17T-E | Human | Esophagus | ESCC | 8.63e-11 | 5.34e-01 | 0.1278 |
| 6730 | SRP68 | P19T-E | Human | Esophagus | ESCC | 7.48e-08 | 6.54e-01 | 0.1662 |
| 6730 | SRP68 | P20T-E | Human | Esophagus | ESCC | 6.34e-46 | 1.24e+00 | 0.1124 |
| 6730 | SRP68 | P21T-E | Human | Esophagus | ESCC | 1.06e-26 | 4.90e-01 | 0.1617 |
| 6730 | SRP68 | P22T-E | Human | Esophagus | ESCC | 5.09e-25 | 5.12e-01 | 0.1236 |
| Page: 1 2 3 4 5 6 |
| Tissue | Expression Dynamics | Abbreviation |
| Esophagus | 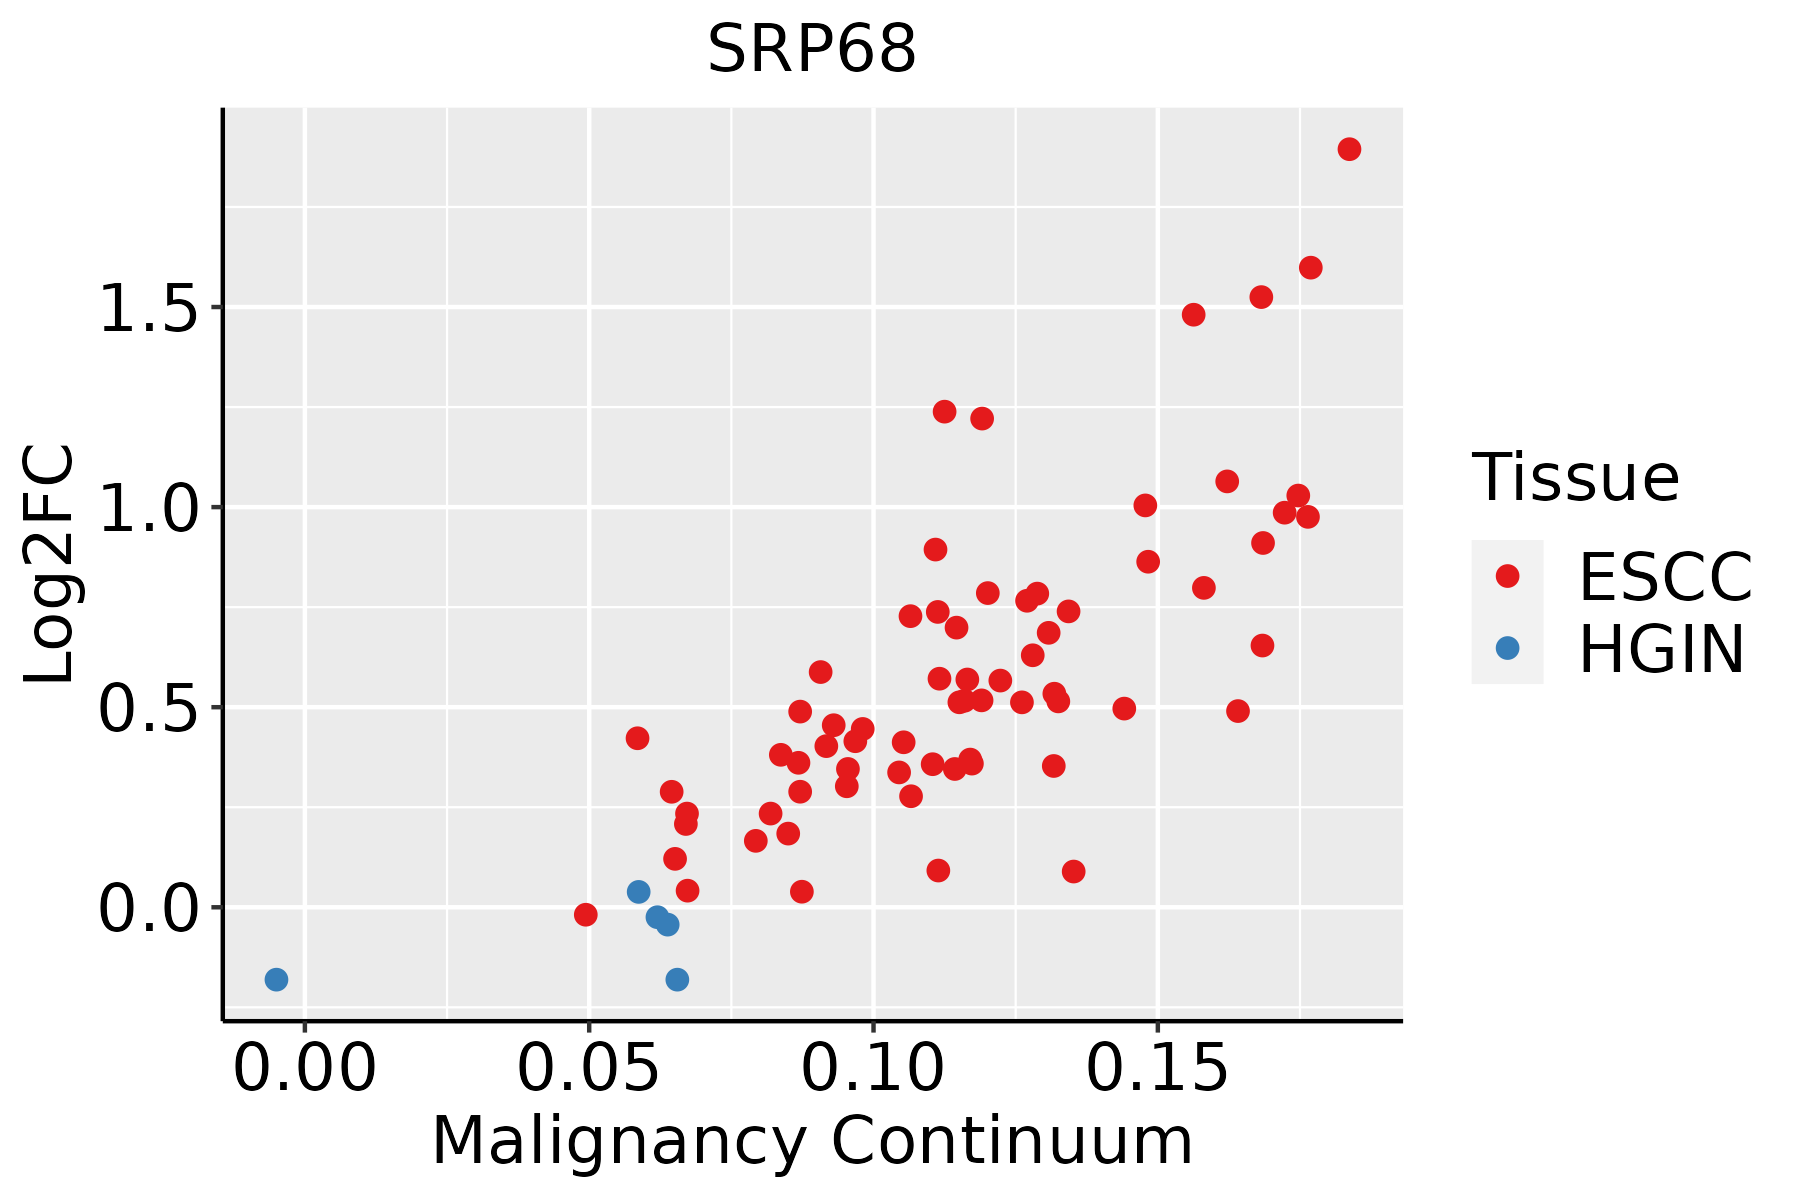 | ESCC: Esophageal squamous cell carcinoma |
| HGIN: High-grade intraepithelial neoplasias | ||
| LGIN: Low-grade intraepithelial neoplasias | ||
| Liver | 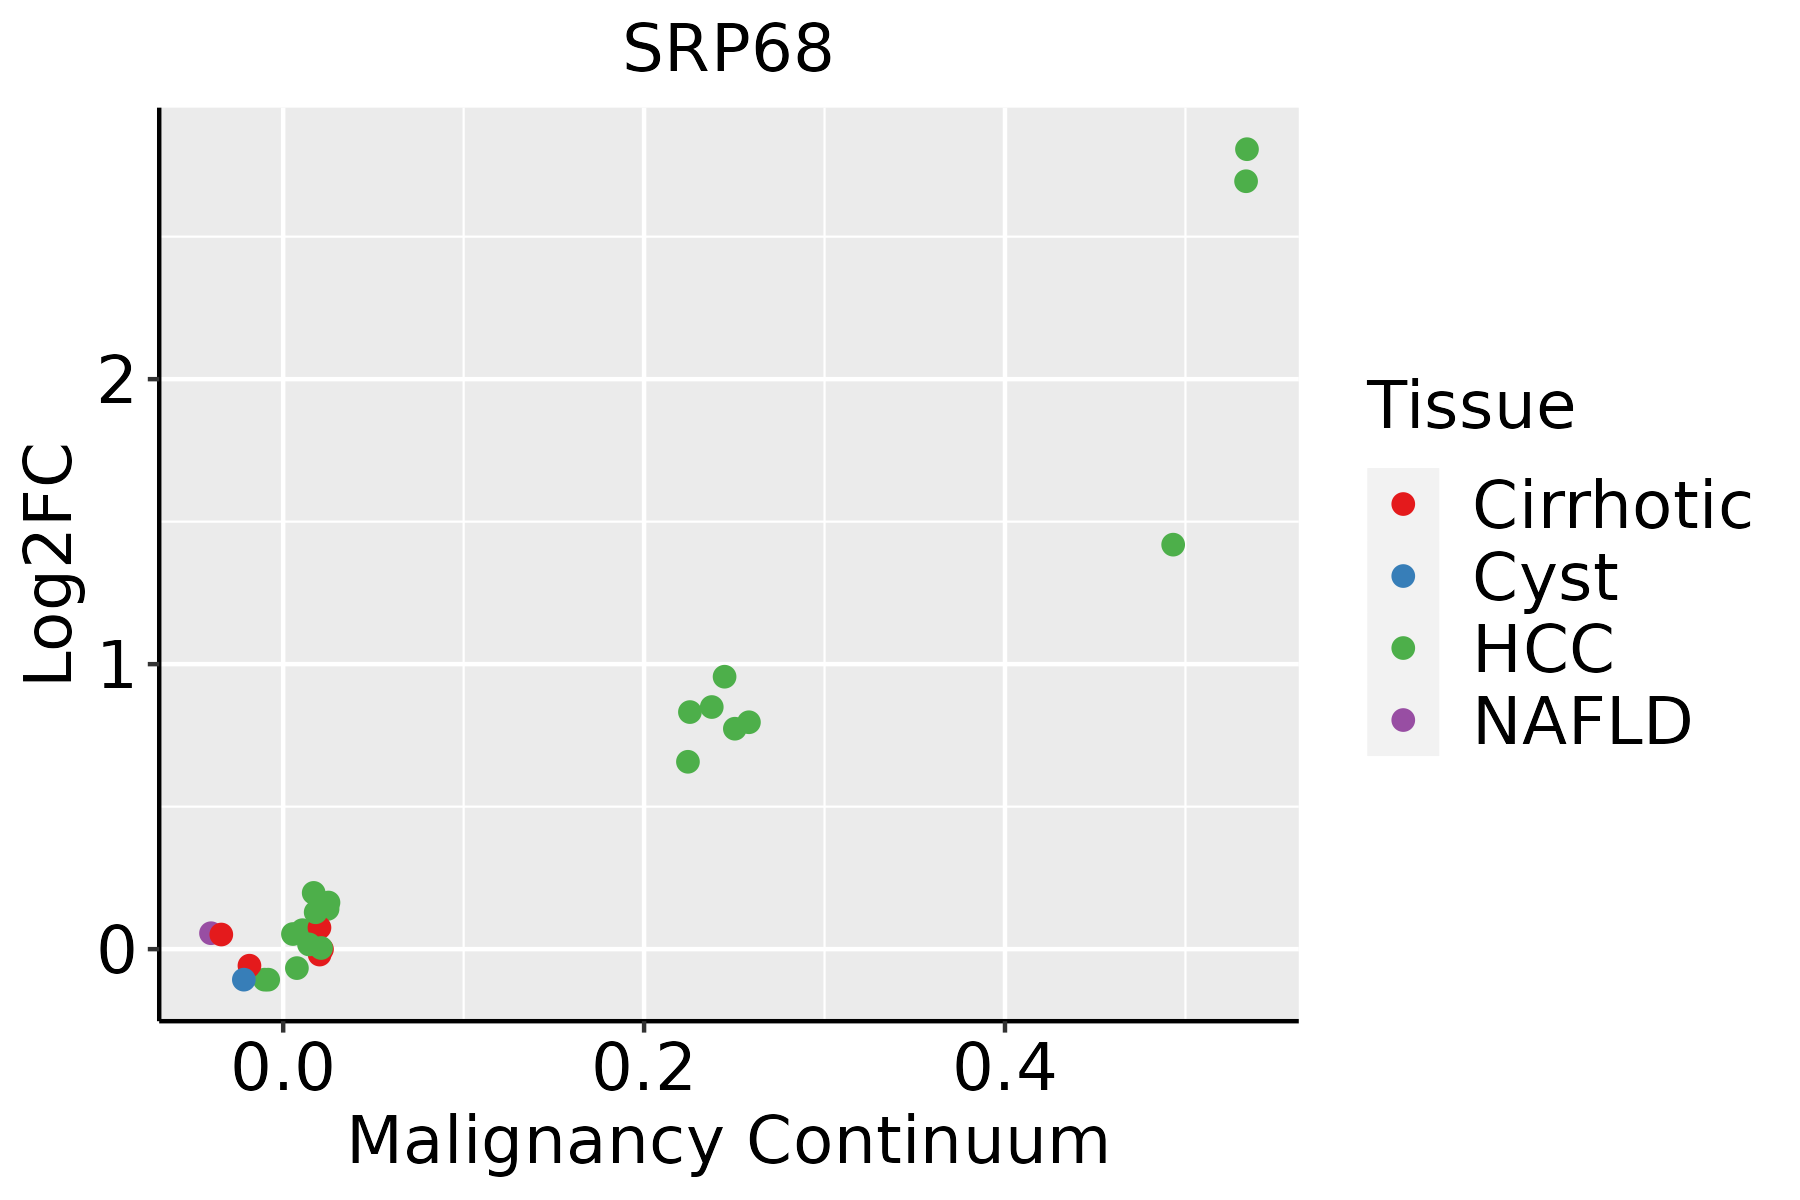 | HCC: Hepatocellular carcinoma |
| NAFLD: Non-alcoholic fatty liver disease | ||
| Oral Cavity |  | EOLP: Erosive Oral lichen planus |
| LP: leukoplakia | ||
| NEOLP: Non-erosive oral lichen planus | ||
| OSCC: Oral squamous cell carcinoma | ||
| Skin | 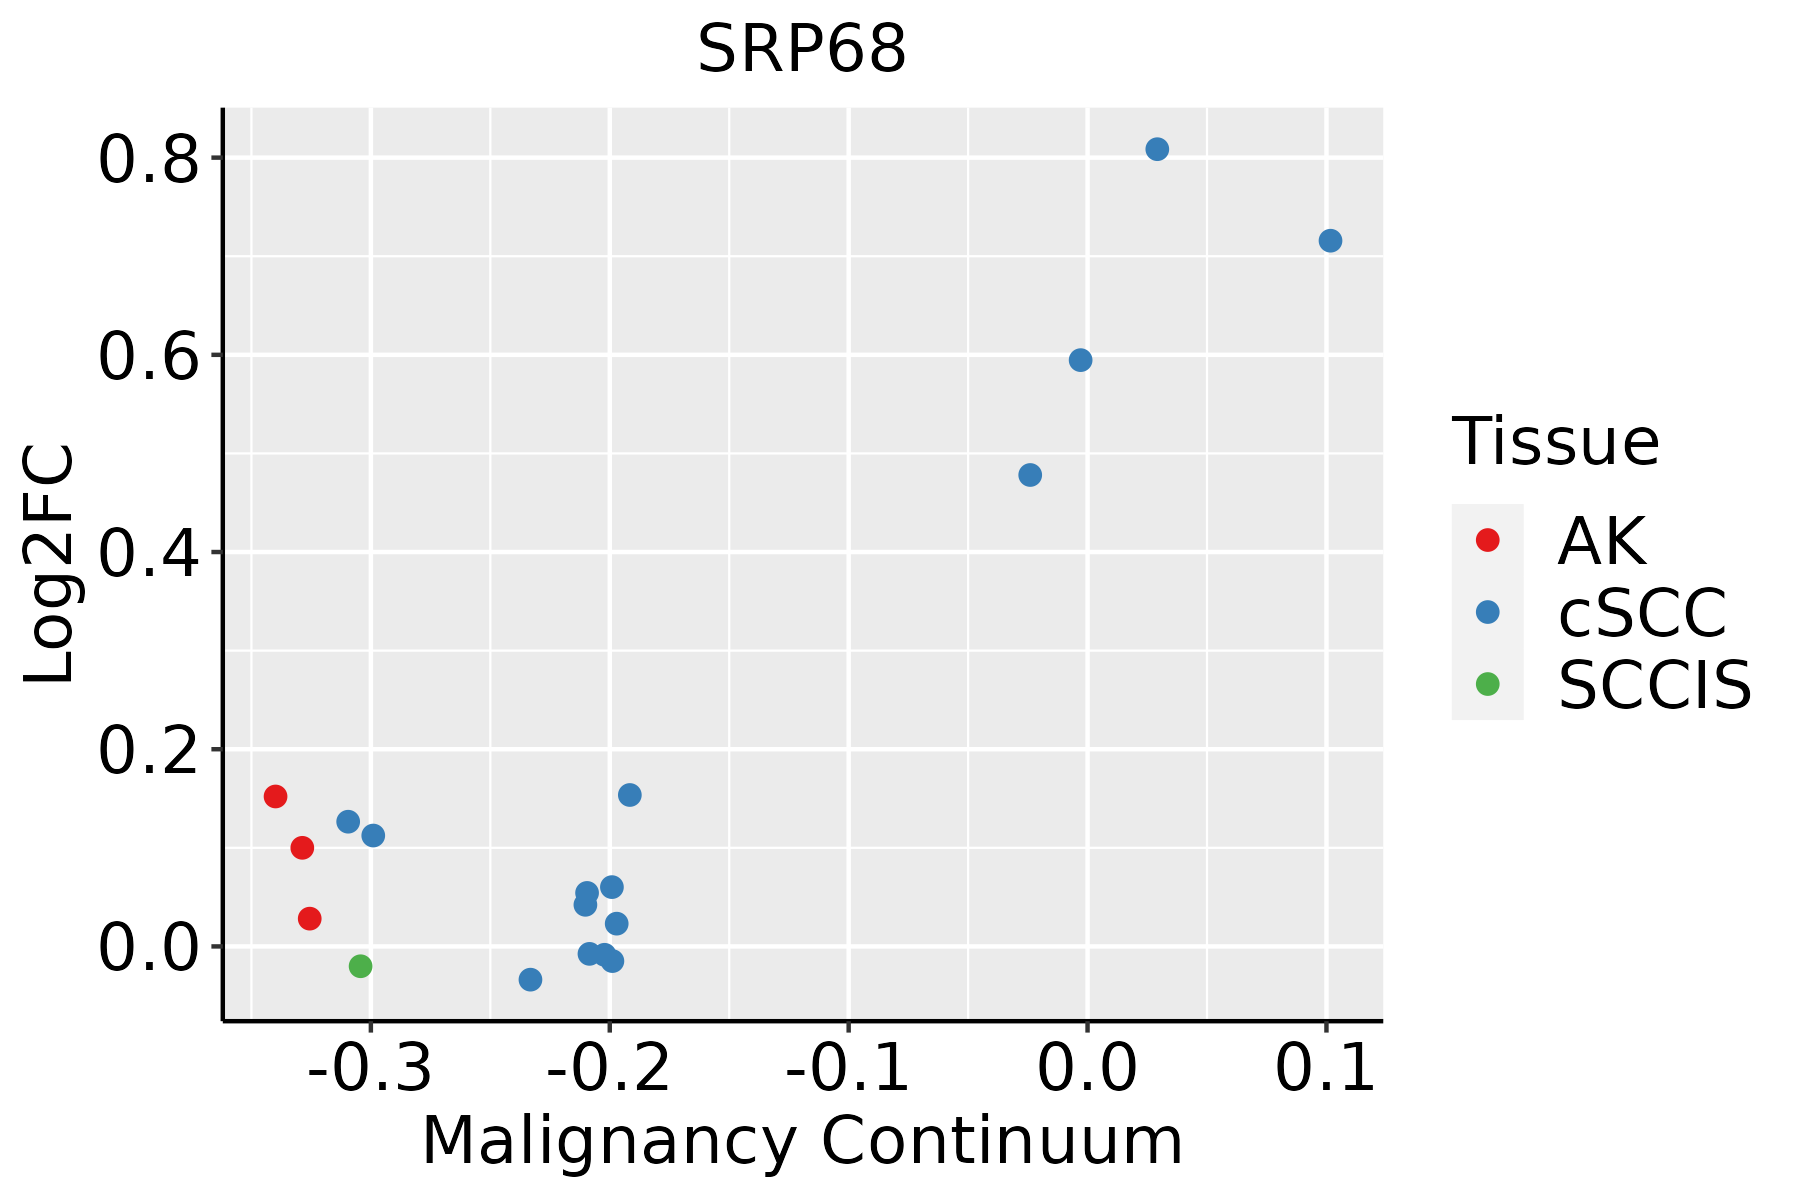 | AK: Actinic keratosis |
| cSCC: Cutaneous squamous cell carcinoma | ||
| SCCIS:squamous cell carcinoma in situ | ||
| Thyroid |  | ATC: Anaplastic thyroid cancer |
| HT: Hashimoto's thyroiditis | ||
| PTC: Papillary thyroid cancer |
| ∗log2FC in expression of this searched gene in stem-like cells from each diseased tissue sample relative to stem-like cells in normal samples in each tissue plotted against the malignancy continuum. Samples are colored based on if they are from different disease stage. |
Top |
Malignant transformation related pathway analysis |
| Find out the enriched GO biological processes and KEGG pathways involved in transition from healthy to precancer to cancer |
| Tissue | Disease Stage | Enriched GO biological Processes |
| Colorectum | AD |  |
| Colorectum | SER |  |
| Colorectum | MSS |  |
| Colorectum | MSI-H |  |
| Colorectum | FAP |  |
| ∗Top 15 enriched GO BP terms are showed in the bar plot of each disease state in each tissue. Each row represents a significant GO biological process which is colored according to the -log10(p.adjust). |
| Page: 1 2 3 4 5 6 7 8 9 |
| GO ID | Tissue | Disease Stage | Description | Gene Ratio | Bg Ratio | pvalue | p.adjust | Count |
| GO:0072594110 | Esophagus | ESCC | establishment of protein localization to organelle | 311/8552 | 422/18723 | 3.02e-32 | 2.13e-29 | 311 |
| GO:0006605111 | Esophagus | ESCC | protein targeting | 229/8552 | 314/18723 | 4.93e-23 | 1.01e-20 | 229 |
| GO:0090150110 | Esophagus | ESCC | establishment of protein localization to membrane | 182/8552 | 260/18723 | 1.27e-15 | 8.19e-14 | 182 |
| GO:007097218 | Esophagus | ESCC | protein localization to endoplasmic reticulum | 52/8552 | 74/18723 | 1.58e-05 | 1.42e-04 | 52 |
| GO:00066124 | Esophagus | ESCC | protein targeting to membrane | 83/8552 | 131/18723 | 3.31e-05 | 2.73e-04 | 83 |
| GO:000941020 | Esophagus | ESCC | response to xenobiotic stimulus | 253/8552 | 462/18723 | 4.55e-05 | 3.58e-04 | 253 |
| GO:007259915 | Esophagus | ESCC | establishment of protein localization to endoplasmic reticulum | 31/8552 | 46/18723 | 2.42e-03 | 1.06e-02 | 31 |
| GO:004504715 | Esophagus | ESCC | protein targeting to ER | 28/8552 | 42/18723 | 4.90e-03 | 1.89e-02 | 28 |
| GO:007259422 | Liver | HCC | establishment of protein localization to organelle | 299/7958 | 422/18723 | 1.06e-32 | 6.10e-30 | 299 |
| GO:000660512 | Liver | HCC | protein targeting | 219/7958 | 314/18723 | 7.74e-23 | 1.49e-20 | 219 |
| GO:009015012 | Liver | HCC | establishment of protein localization to membrane | 168/7958 | 260/18723 | 4.07e-13 | 2.13e-11 | 168 |
| GO:007097212 | Liver | HCC | protein localization to endoplasmic reticulum | 54/7958 | 74/18723 | 1.01e-07 | 1.98e-06 | 54 |
| GO:000941022 | Liver | HCC | response to xenobiotic stimulus | 248/7958 | 462/18723 | 6.47e-07 | 1.02e-05 | 248 |
| GO:007259911 | Liver | HCC | establishment of protein localization to endoplasmic reticulum | 34/7958 | 46/18723 | 1.53e-05 | 1.67e-04 | 34 |
| GO:004504711 | Liver | HCC | protein targeting to ER | 30/7958 | 42/18723 | 1.40e-04 | 1.13e-03 | 30 |
| GO:00066121 | Liver | HCC | protein targeting to membrane | 75/7958 | 131/18723 | 4.58e-04 | 3.04e-03 | 75 |
| GO:00066131 | Liver | HCC | cotranslational protein targeting to membrane | 20/7958 | 31/18723 | 1.11e-02 | 4.09e-02 | 20 |
| GO:007259418 | Oral cavity | OSCC | establishment of protein localization to organelle | 284/7305 | 422/18723 | 1.50e-32 | 1.35e-29 | 284 |
| GO:000660520 | Oral cavity | OSCC | protein targeting | 204/7305 | 314/18723 | 6.78e-21 | 1.13e-18 | 204 |
| GO:009015018 | Oral cavity | OSCC | establishment of protein localization to membrane | 163/7305 | 260/18723 | 7.13e-15 | 4.47e-13 | 163 |
| Page: 1 2 3 4 |
| Pathway ID | Tissue | Disease Stage | Description | Gene Ratio | Bg Ratio | pvalue | p.adjust | qvalue | Count |
| hsa0306026 | Esophagus | ESCC | Protein export | 22/4205 | 23/8465 | 2.43e-06 | 1.43e-05 | 7.32e-06 | 22 |
| hsa0306036 | Esophagus | ESCC | Protein export | 22/4205 | 23/8465 | 2.43e-06 | 1.43e-05 | 7.32e-06 | 22 |
| hsa0306021 | Liver | HCC | Protein export | 21/4020 | 23/8465 | 1.20e-05 | 8.53e-05 | 4.74e-05 | 21 |
| hsa0306031 | Liver | HCC | Protein export | 21/4020 | 23/8465 | 1.20e-05 | 8.53e-05 | 4.74e-05 | 21 |
| hsa0306018 | Oral cavity | OSCC | Protein export | 21/3704 | 23/8465 | 2.42e-06 | 1.27e-05 | 6.45e-06 | 21 |
| hsa0306019 | Oral cavity | OSCC | Protein export | 21/3704 | 23/8465 | 2.42e-06 | 1.27e-05 | 6.45e-06 | 21 |
| hsa0306025 | Oral cavity | LP | Protein export | 21/2418 | 23/8465 | 4.72e-10 | 8.28e-09 | 5.34e-09 | 21 |
| hsa0306035 | Oral cavity | LP | Protein export | 21/2418 | 23/8465 | 4.72e-10 | 8.28e-09 | 5.34e-09 | 21 |
| Page: 1 |
Top |
Cell-cell communication analysis |
| Identification of potential cell-cell interactions between two cell types and their ligand-receptor pairs for different disease states |
| Ligand | Receptor | LRpair | Pathway | Tissue | Disease Stage |
| Page: 1 |
Top |
Single-cell gene regulatory network inference analysis |
| Find out the significant the regulons (TFs) and the target genes of each regulon across cell types for different disease states |
| TF | Cell Type | Tissue | Disease Stage | Target Gene | RSS | Regulon Activity |
| ∗The dot plots of a searched regulon are shown for all cell subpopulations in each disease state of each tissue based on the regulon specific score inferred using pySCENIC and by calculating the average expression. |
| Page: 1 |
Top |
Somatic mutation of malignant transformation related genes |
| Annotation of somatic variants for genes involved in malignant transformation |
| Hugo Symbol | Variant Class | Variant Classification | dbSNP RS | HGVSc | HGVSp | HGVSp Short | SWISSPROT | BIOTYPE | SIFT | PolyPhen | Tumor Sample Barcode | Tissue | Histology | Sex | Age | Stage | Therapy Types | Drugs | Outcome |
| SRP68 | SNV | Missense_Mutation | c.134N>T | p.Ser45Leu | p.S45L | Q9UHB9 | protein_coding | tolerated(0.22) | benign(0.01) | TCGA-A8-A08H-01 | Breast | breast invasive carcinoma | Female | >=65 | I/II | Unknown | Unknown | SD | |
| SRP68 | SNV | Missense_Mutation | rs747691330 | c.119N>G | p.Glu40Gly | p.E40G | Q9UHB9 | protein_coding | deleterious(0.03) | probably_damaging(0.969) | TCGA-D8-A147-01 | Breast | breast invasive carcinoma | Female | <65 | I/II | Chemotherapy | doxorubicine | SD |
| SRP68 | insertion | Nonsense_Mutation | novel | c.290_291insTTCTGTCTCTGGTCTAGATACTTGCTTCTGGTTCTGATGGATGCTG | p.Leu98SerfsTer12 | p.L98Sfs*12 | Q9UHB9 | protein_coding | TCGA-A2-A04Y-01 | Breast | breast invasive carcinoma | Female | <65 | I/II | Chemotherapy | cytoxan | SD | ||
| SRP68 | deletion | Frame_Shift_Del | novel | c.274delN | p.Arg92AspfsTer22 | p.R92Dfs*22 | Q9UHB9 | protein_coding | TCGA-A2-A0YF-01 | Breast | breast invasive carcinoma | Female | >=65 | I/II | Unspecific | Arimidex | SD | ||
| SRP68 | insertion | Frame_Shift_Ins | novel | c.1000_1001insCCTCCAATTCTGTCTCCAGGTGGACTTCTCC | p.Glu334AlafsTer15 | p.E334Afs*15 | Q9UHB9 | protein_coding | TCGA-A8-A07U-01 | Breast | breast invasive carcinoma | Female | >=65 | III/IV | Chemotherapy | 5-fluorouracil | SD | ||
| SRP68 | SNV | Missense_Mutation | rs779576471 | c.1168N>G | p.Thr390Ala | p.T390A | Q9UHB9 | protein_coding | tolerated(0.15) | benign(0.342) | TCGA-2W-A8YY-01 | Cervix | cervical & endocervical cancer | Female | <65 | I/II | Chemotherapy | cisplatin | CR |
| SRP68 | SNV | Missense_Mutation | c.847A>G | p.Thr283Ala | p.T283A | Q9UHB9 | protein_coding | tolerated(1) | benign(0.001) | TCGA-IR-A3LK-01 | Cervix | cervical & endocervical cancer | Female | >=65 | I/II | Chemotherapy | cisplatin | PD | |
| SRP68 | SNV | Missense_Mutation | novel | c.703C>G | p.Gln235Glu | p.Q235E | Q9UHB9 | protein_coding | deleterious(0.04) | possibly_damaging(0.647) | TCGA-UC-A7PI-01 | Cervix | cervical & endocervical cancer | Female | <65 | I/II | Unknown | Unknown | PD |
| SRP68 | SNV | Missense_Mutation | c.619N>A | p.Ala207Thr | p.A207T | Q9UHB9 | protein_coding | deleterious(0) | probably_damaging(0.998) | TCGA-A6-6653-01 | Colorectum | colon adenocarcinoma | Male | >=65 | I/II | Unknown | Unknown | SD | |
| SRP68 | SNV | Missense_Mutation | rs752117551 | c.1003C>T | p.Arg335Cys | p.R335C | Q9UHB9 | protein_coding | deleterious(0.02) | possibly_damaging(0.627) | TCGA-AA-3663-01 | Colorectum | colon adenocarcinoma | Male | <65 | I/II | Unknown | Unknown | SD |
| Page: 1 2 3 4 5 6 |
Top |
Related drugs of malignant transformation related genes |
| Identification of chemicals and drugs interact with genes involved in malignant transfromation |
| (DGIdb 4.0) |
| Entrez ID | Symbol | Category | Interaction Types | Drug Claim Name | Drug Name | PMIDs |
| Page: 1 |

Copyright 2023-Present -The University of Texas Health Science Center at Houston |