
|
|||||
|
 | |
| |
| |
| |
| |
| |
|
Gene: SRP19 |
Gene summary for SRP19 |
| Gene information | Species | Human | Gene symbol | SRP19 | Gene ID | 6728 |
| Gene name | signal recognition particle 19 | |
| Gene Alias | SRP19 | |
| Cytomap | 5q22.2 | |
| Gene Type | protein-coding | GO ID | GO:0006605 | UniProtAcc | P09132 |
Top |
Malignant transformation analysis |
| Identification of the aberrant gene expression in precancerous and cancerous lesions by comparing the gene expression of stem-like cells in diseased tissues with normal stem cells |
| Entrez ID | Symbol | Replicates | Species | Organ | Tissue | Adj P-value | Log2FC | Malignancy |
| 6728 | SRP19 | LZE4T | Human | Esophagus | ESCC | 2.67e-16 | 3.55e-01 | 0.0811 |
| 6728 | SRP19 | LZE7T | Human | Esophagus | ESCC | 4.51e-07 | 7.03e-01 | 0.0667 |
| 6728 | SRP19 | LZE8T | Human | Esophagus | ESCC | 4.22e-06 | 3.28e-01 | 0.067 |
| 6728 | SRP19 | LZE20T | Human | Esophagus | ESCC | 1.34e-05 | 3.79e-01 | 0.0662 |
| 6728 | SRP19 | LZE22D1 | Human | Esophagus | HGIN | 7.19e-03 | -3.01e-03 | 0.0595 |
| 6728 | SRP19 | LZE24T | Human | Esophagus | ESCC | 4.39e-25 | 8.28e-01 | 0.0596 |
| 6728 | SRP19 | LZE6T | Human | Esophagus | ESCC | 6.90e-13 | 6.24e-01 | 0.0845 |
| 6728 | SRP19 | P1T-E | Human | Esophagus | ESCC | 2.06e-03 | -5.73e-02 | 0.0875 |
| 6728 | SRP19 | P2T-E | Human | Esophagus | ESCC | 1.02e-07 | -8.70e-02 | 0.1177 |
| 6728 | SRP19 | P4T-E | Human | Esophagus | ESCC | 4.10e-12 | -1.29e-02 | 0.1323 |
| 6728 | SRP19 | P5T-E | Human | Esophagus | ESCC | 1.91e-09 | -1.19e-01 | 0.1327 |
| 6728 | SRP19 | P8T-E | Human | Esophagus | ESCC | 1.19e-09 | -1.16e-01 | 0.0889 |
| 6728 | SRP19 | P9T-E | Human | Esophagus | ESCC | 3.50e-16 | 5.39e-03 | 0.1131 |
| 6728 | SRP19 | P10T-E | Human | Esophagus | ESCC | 8.86e-11 | -3.07e-02 | 0.116 |
| 6728 | SRP19 | P12T-E | Human | Esophagus | ESCC | 4.47e-13 | -9.44e-02 | 0.1122 |
| 6728 | SRP19 | P15T-E | Human | Esophagus | ESCC | 1.86e-12 | -8.19e-02 | 0.1149 |
| 6728 | SRP19 | P16T-E | Human | Esophagus | ESCC | 5.36e-05 | -1.52e-01 | 0.1153 |
| 6728 | SRP19 | P20T-E | Human | Esophagus | ESCC | 4.29e-06 | -6.96e-02 | 0.1124 |
| 6728 | SRP19 | P21T-E | Human | Esophagus | ESCC | 9.63e-17 | -6.62e-02 | 0.1617 |
| 6728 | SRP19 | P22T-E | Human | Esophagus | ESCC | 3.74e-07 | -1.20e-01 | 0.1236 |
| Page: 1 2 3 4 5 6 7 |
| Tissue | Expression Dynamics | Abbreviation |
| Esophagus |  | ESCC: Esophageal squamous cell carcinoma |
| HGIN: High-grade intraepithelial neoplasias | ||
| LGIN: Low-grade intraepithelial neoplasias | ||
| Liver | 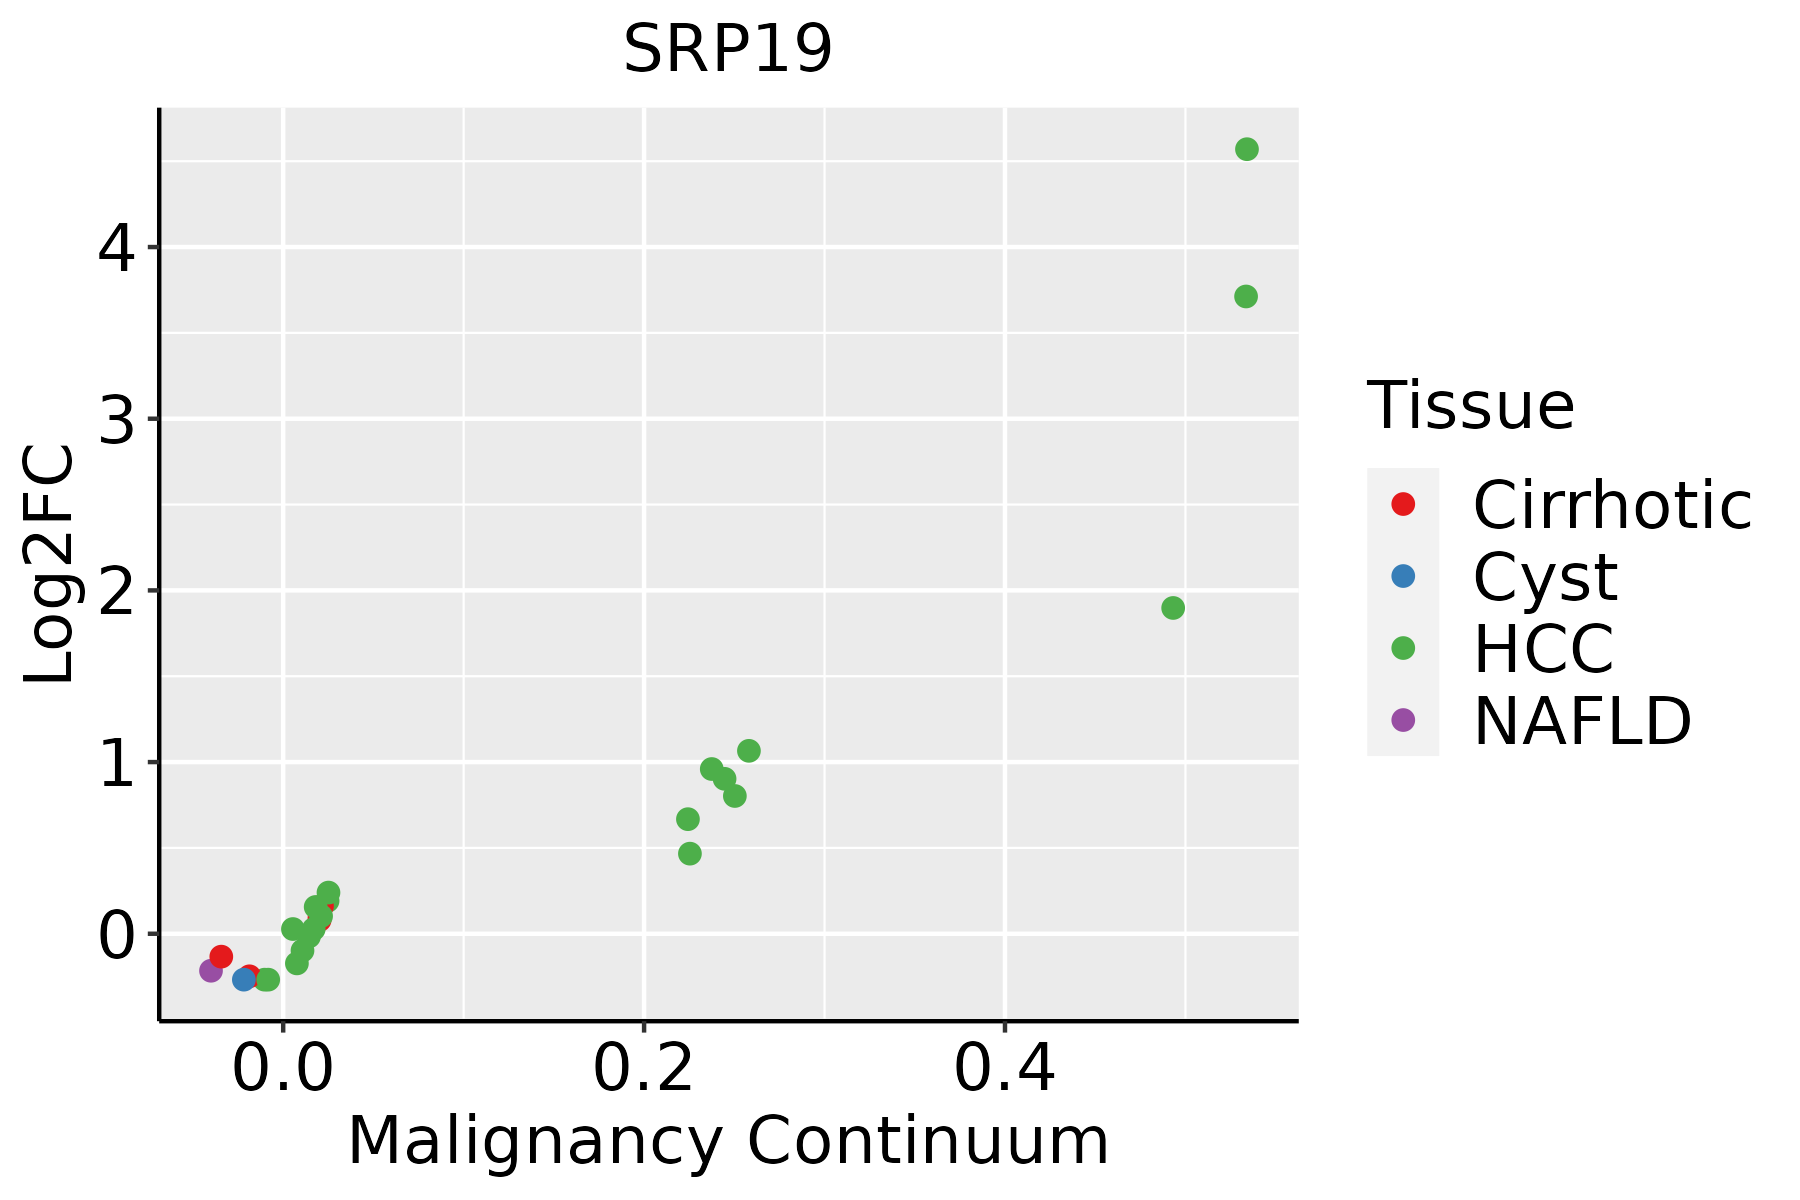 | HCC: Hepatocellular carcinoma |
| NAFLD: Non-alcoholic fatty liver disease | ||
| Oral Cavity | 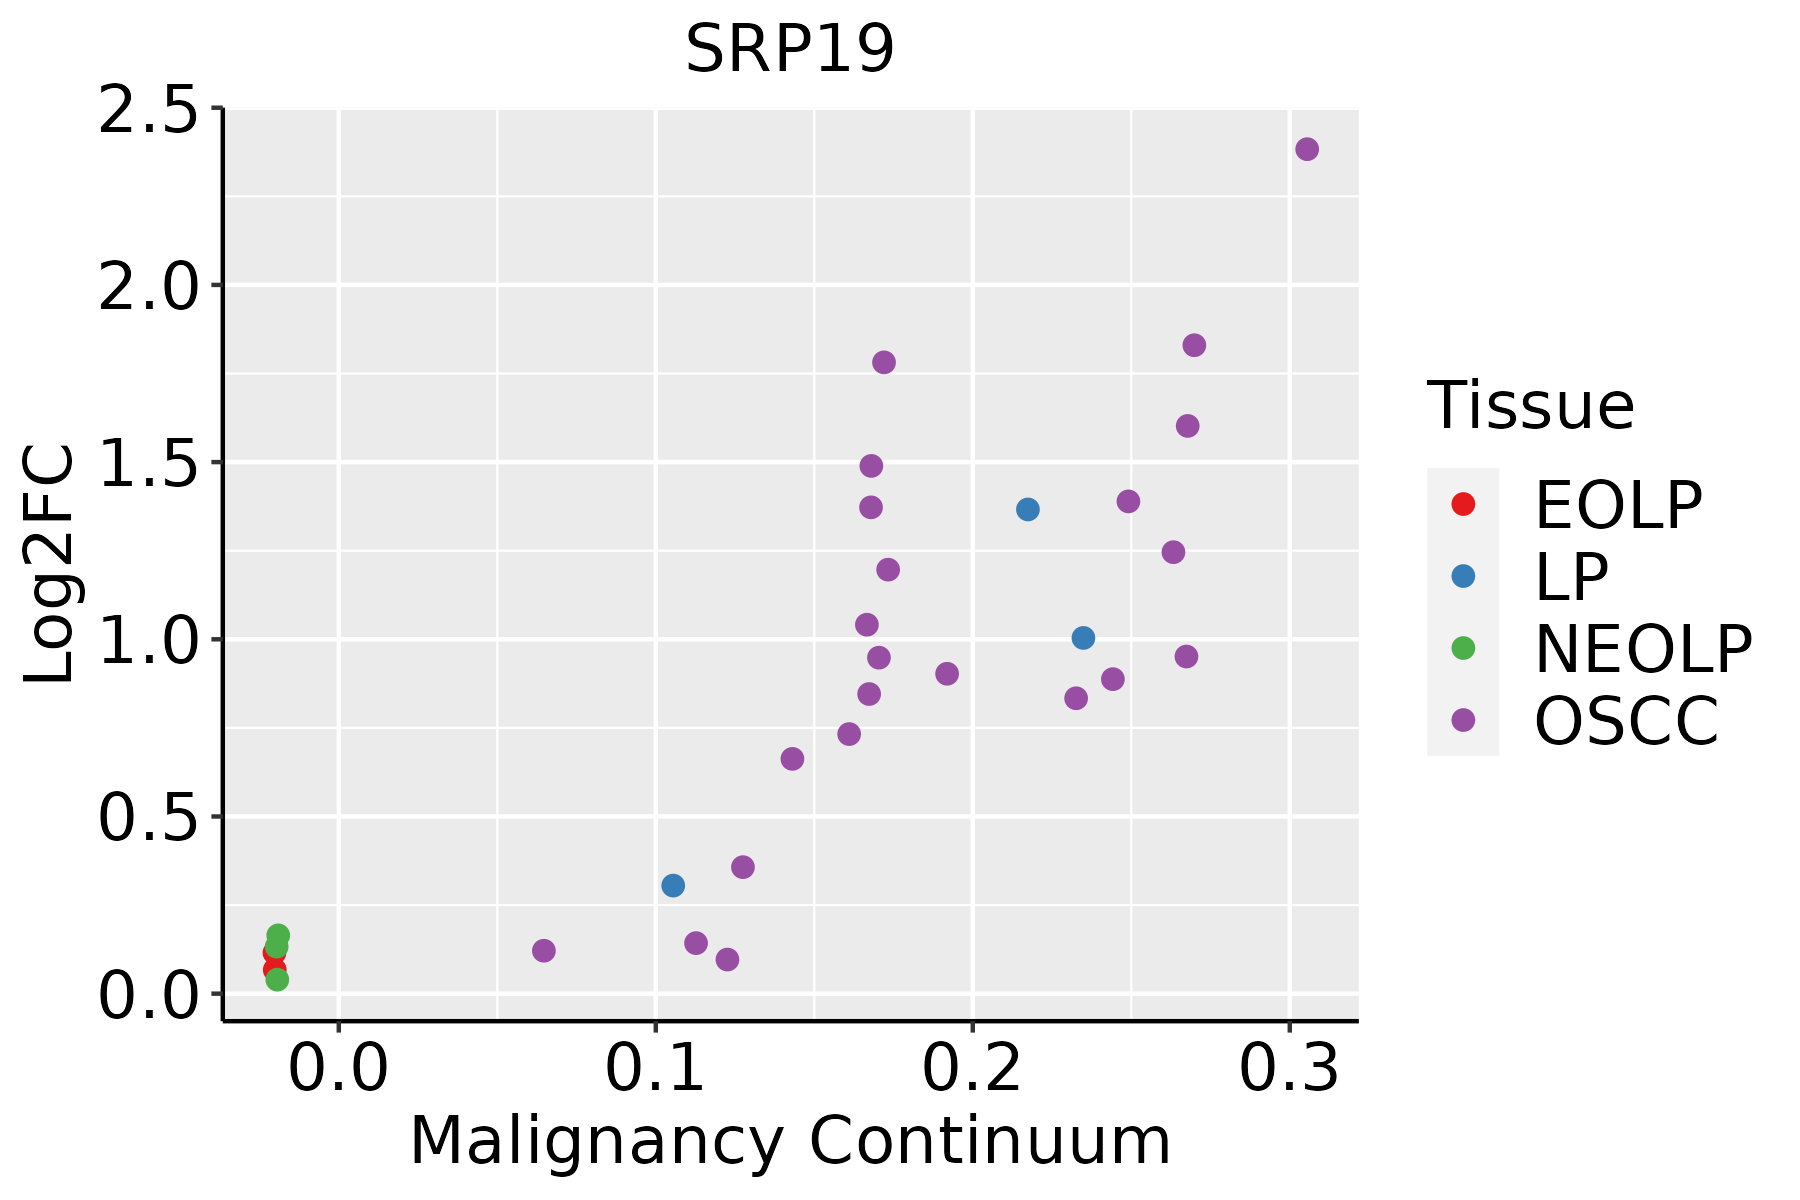 | EOLP: Erosive Oral lichen planus |
| LP: leukoplakia | ||
| NEOLP: Non-erosive oral lichen planus | ||
| OSCC: Oral squamous cell carcinoma | ||
| Prostate |  | BPH: Benign Prostatic Hyperplasia |
| Skin | 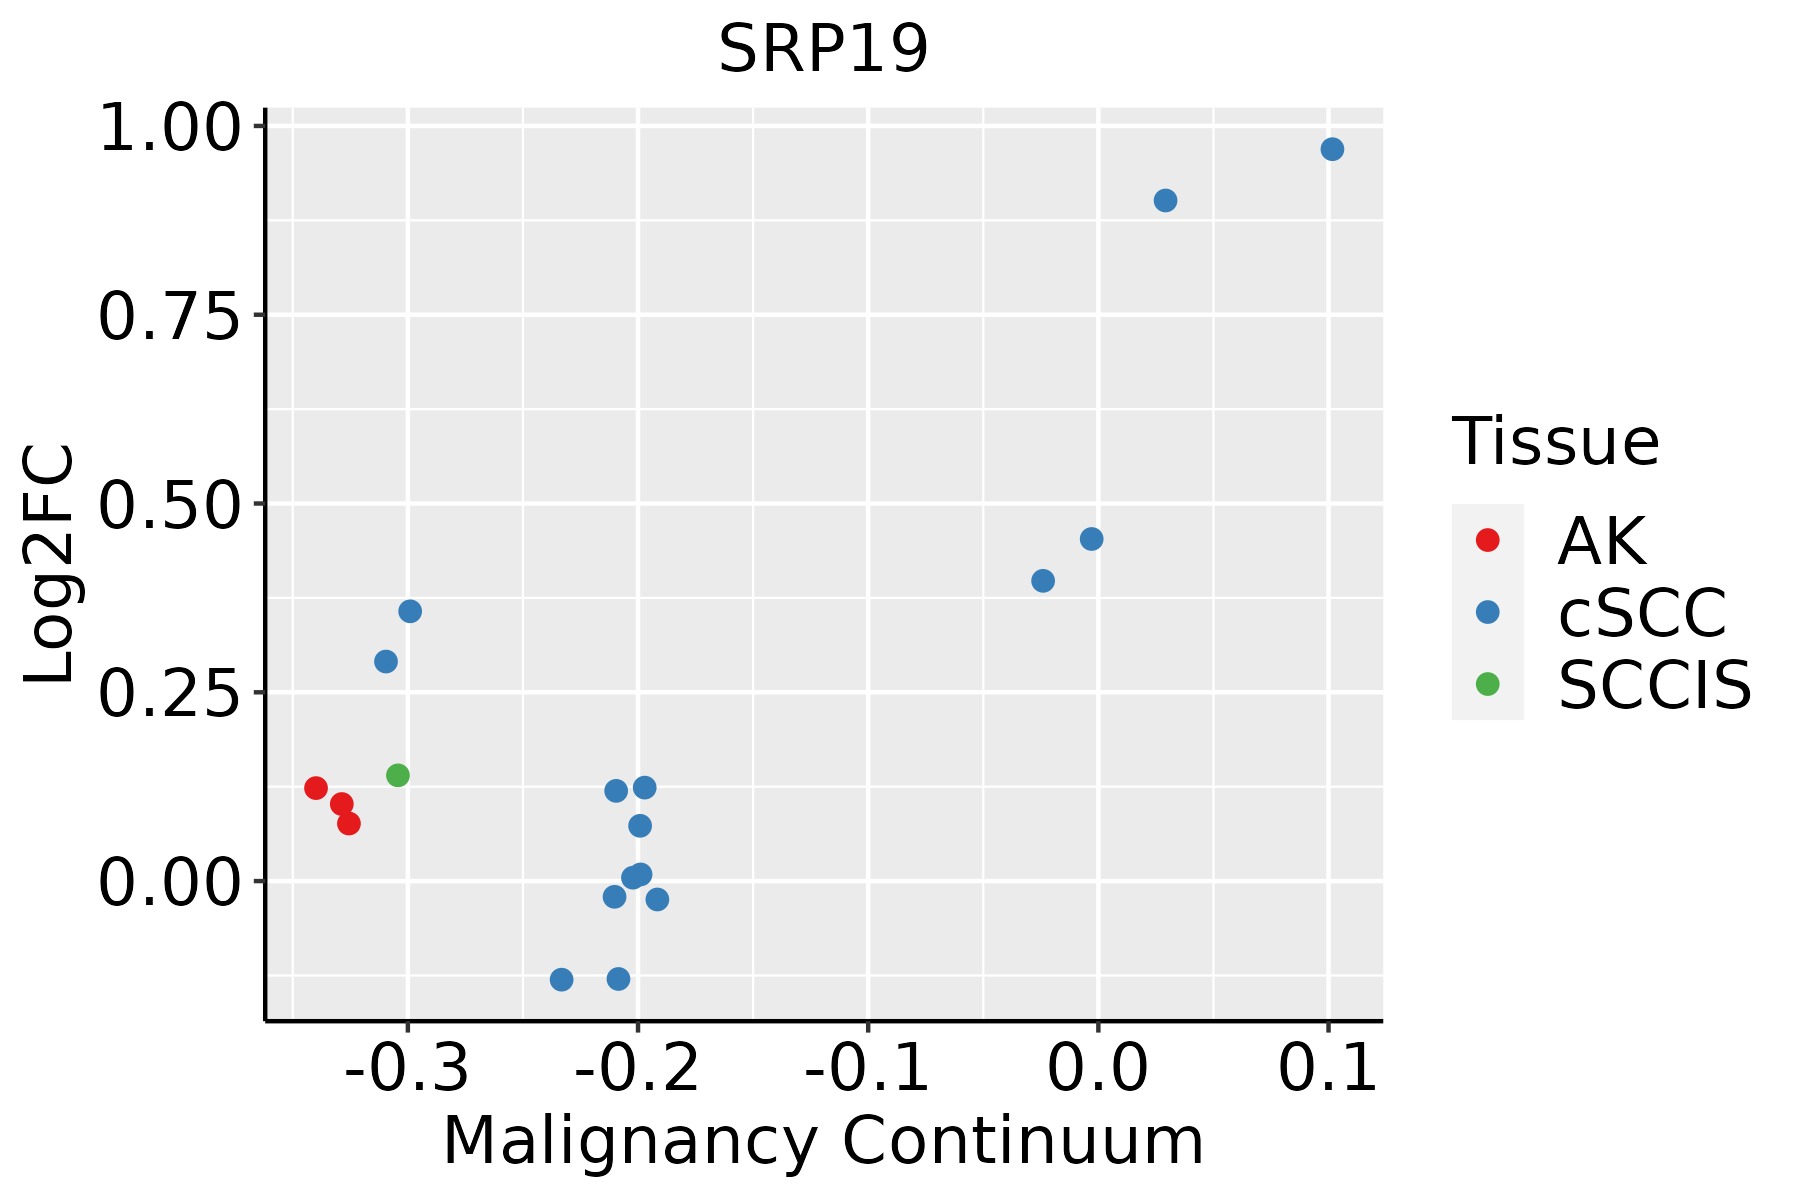 | AK: Actinic keratosis |
| cSCC: Cutaneous squamous cell carcinoma | ||
| SCCIS:squamous cell carcinoma in situ | ||
| Thyroid | 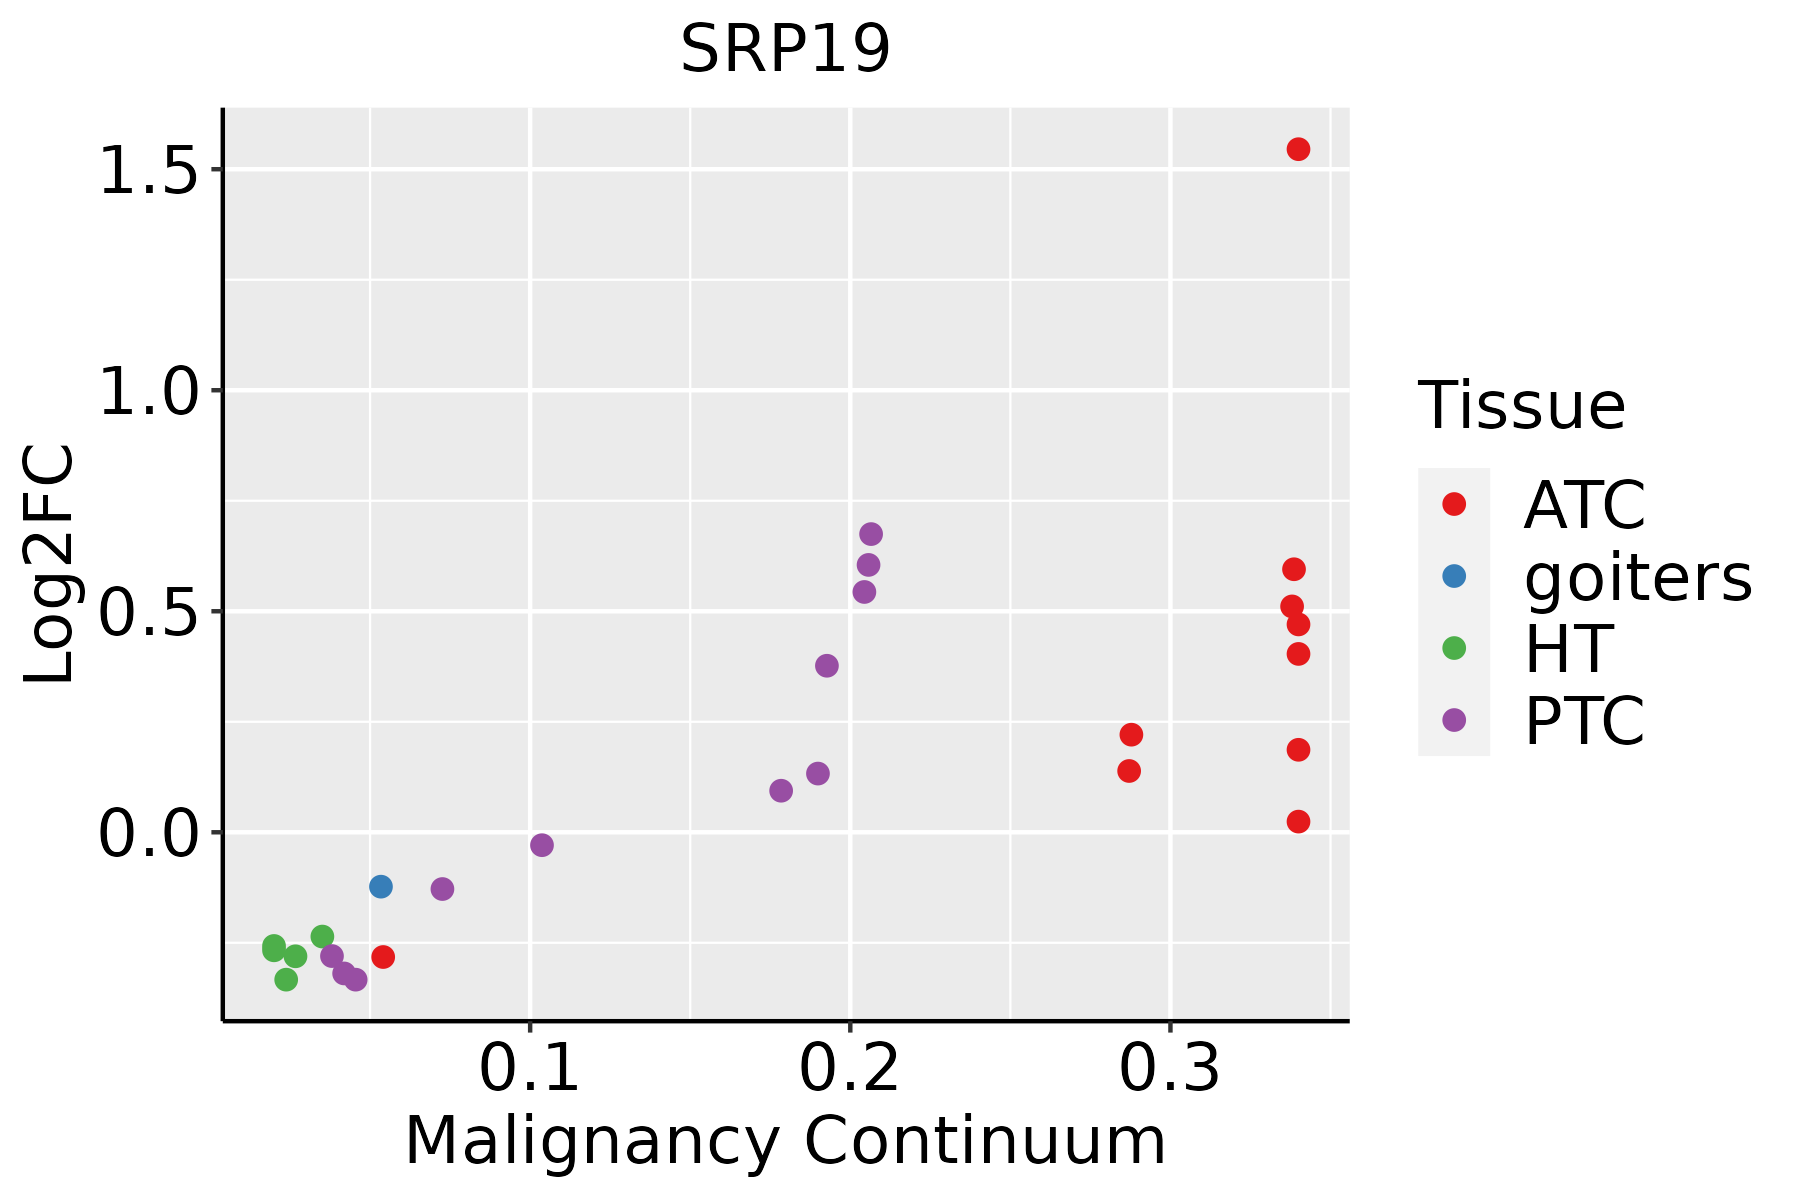 | ATC: Anaplastic thyroid cancer |
| HT: Hashimoto's thyroiditis | ||
| PTC: Papillary thyroid cancer |
| ∗log2FC in expression of this searched gene in stem-like cells from each diseased tissue sample relative to stem-like cells in normal samples in each tissue plotted against the malignancy continuum. Samples are colored based on if they are from different disease stage. |
Top |
Malignant transformation related pathway analysis |
| Find out the enriched GO biological processes and KEGG pathways involved in transition from healthy to precancer to cancer |
| Tissue | Disease Stage | Enriched GO biological Processes |
| Colorectum | AD |  |
| Colorectum | SER |  |
| Colorectum | MSS |  |
| Colorectum | MSI-H |  |
| Colorectum | FAP |  |
| ∗Top 15 enriched GO BP terms are showed in the bar plot of each disease state in each tissue. Each row represents a significant GO biological process which is colored according to the -log10(p.adjust). |
| Page: 1 2 3 4 5 6 7 8 9 |
| GO ID | Tissue | Disease Stage | Description | Gene Ratio | Bg Ratio | pvalue | p.adjust | Count |
| GO:007259420 | Esophagus | HGIN | establishment of protein localization to organelle | 120/2587 | 422/18723 | 1.73e-15 | 4.00e-13 | 120 |
| GO:000660525 | Esophagus | HGIN | protein targeting | 78/2587 | 314/18723 | 1.08e-07 | 5.47e-06 | 78 |
| GO:009015020 | Esophagus | HGIN | establishment of protein localization to membrane | 67/2587 | 260/18723 | 1.96e-07 | 9.57e-06 | 67 |
| GO:007097210 | Esophagus | HGIN | protein localization to endoplasmic reticulum | 26/2587 | 74/18723 | 3.09e-06 | 1.05e-04 | 26 |
| GO:00725999 | Esophagus | HGIN | establishment of protein localization to endoplasmic reticulum | 16/2587 | 46/18723 | 2.73e-04 | 4.71e-03 | 16 |
| GO:00450478 | Esophagus | HGIN | protein targeting to ER | 15/2587 | 42/18723 | 3.03e-04 | 5.13e-03 | 15 |
| GO:0072594110 | Esophagus | ESCC | establishment of protein localization to organelle | 311/8552 | 422/18723 | 3.02e-32 | 2.13e-29 | 311 |
| GO:0006605111 | Esophagus | ESCC | protein targeting | 229/8552 | 314/18723 | 4.93e-23 | 1.01e-20 | 229 |
| GO:0090150110 | Esophagus | ESCC | establishment of protein localization to membrane | 182/8552 | 260/18723 | 1.27e-15 | 8.19e-14 | 182 |
| GO:007097218 | Esophagus | ESCC | protein localization to endoplasmic reticulum | 52/8552 | 74/18723 | 1.58e-05 | 1.42e-04 | 52 |
| GO:00066124 | Esophagus | ESCC | protein targeting to membrane | 83/8552 | 131/18723 | 3.31e-05 | 2.73e-04 | 83 |
| GO:007259915 | Esophagus | ESCC | establishment of protein localization to endoplasmic reticulum | 31/8552 | 46/18723 | 2.42e-03 | 1.06e-02 | 31 |
| GO:004504715 | Esophagus | ESCC | protein targeting to ER | 28/8552 | 42/18723 | 4.90e-03 | 1.89e-02 | 28 |
| GO:007259412 | Liver | Cirrhotic | establishment of protein localization to organelle | 189/4634 | 422/18723 | 1.01e-19 | 2.45e-17 | 189 |
| GO:00066057 | Liver | Cirrhotic | protein targeting | 148/4634 | 314/18723 | 3.86e-18 | 6.20e-16 | 148 |
| GO:00901507 | Liver | Cirrhotic | establishment of protein localization to membrane | 123/4634 | 260/18723 | 1.85e-15 | 2.15e-13 | 123 |
| GO:00709724 | Liver | Cirrhotic | protein localization to endoplasmic reticulum | 45/4634 | 74/18723 | 4.79e-11 | 2.73e-09 | 45 |
| GO:00725994 | Liver | Cirrhotic | establishment of protein localization to endoplasmic reticulum | 26/4634 | 46/18723 | 4.14e-06 | 6.94e-05 | 26 |
| GO:00450474 | Liver | Cirrhotic | protein targeting to ER | 24/4634 | 42/18723 | 7.49e-06 | 1.15e-04 | 24 |
| GO:00066122 | Liver | Cirrhotic | protein targeting to membrane | 53/4634 | 131/18723 | 5.17e-05 | 5.95e-04 | 53 |
| Page: 1 2 3 4 5 |
| Pathway ID | Tissue | Disease Stage | Description | Gene Ratio | Bg Ratio | pvalue | p.adjust | qvalue | Count |
| hsa0306020 | Esophagus | HGIN | Protein export | 13/1383 | 23/8465 | 1.27e-05 | 1.80e-04 | 1.43e-04 | 13 |
| hsa03060110 | Esophagus | HGIN | Protein export | 13/1383 | 23/8465 | 1.27e-05 | 1.80e-04 | 1.43e-04 | 13 |
| hsa0306026 | Esophagus | ESCC | Protein export | 22/4205 | 23/8465 | 2.43e-06 | 1.43e-05 | 7.32e-06 | 22 |
| hsa0306036 | Esophagus | ESCC | Protein export | 22/4205 | 23/8465 | 2.43e-06 | 1.43e-05 | 7.32e-06 | 22 |
| hsa030608 | Liver | Cirrhotic | Protein export | 20/2530 | 23/8465 | 2.00e-08 | 3.51e-07 | 2.17e-07 | 20 |
| hsa0306011 | Liver | Cirrhotic | Protein export | 20/2530 | 23/8465 | 2.00e-08 | 3.51e-07 | 2.17e-07 | 20 |
| hsa0306021 | Liver | HCC | Protein export | 21/4020 | 23/8465 | 1.20e-05 | 8.53e-05 | 4.74e-05 | 21 |
| hsa0306031 | Liver | HCC | Protein export | 21/4020 | 23/8465 | 1.20e-05 | 8.53e-05 | 4.74e-05 | 21 |
| hsa0306018 | Oral cavity | OSCC | Protein export | 21/3704 | 23/8465 | 2.42e-06 | 1.27e-05 | 6.45e-06 | 21 |
| hsa0306019 | Oral cavity | OSCC | Protein export | 21/3704 | 23/8465 | 2.42e-06 | 1.27e-05 | 6.45e-06 | 21 |
| hsa0306025 | Oral cavity | LP | Protein export | 21/2418 | 23/8465 | 4.72e-10 | 8.28e-09 | 5.34e-09 | 21 |
| hsa0306035 | Oral cavity | LP | Protein export | 21/2418 | 23/8465 | 4.72e-10 | 8.28e-09 | 5.34e-09 | 21 |
| hsa0306016 | Prostate | BPH | Protein export | 18/1718 | 23/8465 | 3.72e-09 | 5.11e-08 | 3.16e-08 | 18 |
| hsa0306017 | Prostate | BPH | Protein export | 18/1718 | 23/8465 | 3.72e-09 | 5.11e-08 | 3.16e-08 | 18 |
| hsa0306024 | Prostate | Tumor | Protein export | 18/1791 | 23/8465 | 7.50e-09 | 1.03e-07 | 6.42e-08 | 18 |
| hsa0306034 | Prostate | Tumor | Protein export | 18/1791 | 23/8465 | 7.50e-09 | 1.03e-07 | 6.42e-08 | 18 |
| Page: 1 |
Top |
Cell-cell communication analysis |
| Identification of potential cell-cell interactions between two cell types and their ligand-receptor pairs for different disease states |
| Ligand | Receptor | LRpair | Pathway | Tissue | Disease Stage |
| Page: 1 |
Top |
Single-cell gene regulatory network inference analysis |
| Find out the significant the regulons (TFs) and the target genes of each regulon across cell types for different disease states |
| TF | Cell Type | Tissue | Disease Stage | Target Gene | RSS | Regulon Activity |
| ∗The dot plots of a searched regulon are shown for all cell subpopulations in each disease state of each tissue based on the regulon specific score inferred using pySCENIC and by calculating the average expression. |
| Page: 1 |
Top |
Somatic mutation of malignant transformation related genes |
| Annotation of somatic variants for genes involved in malignant transformation |
| Hugo Symbol | Variant Class | Variant Classification | dbSNP RS | HGVSc | HGVSp | HGVSp Short | SWISSPROT | BIOTYPE | SIFT | PolyPhen | Tumor Sample Barcode | Tissue | Histology | Sex | Age | Stage | Therapy Types | Drugs | Outcome |
| SRP19 | SNV | Missense_Mutation | c.148N>G | p.Gln50Glu | p.Q50E | P09132 | protein_coding | deleterious(0.03) | benign(0.345) | TCGA-DR-A0ZM-01 | Cervix | cervical & endocervical cancer | Female | <65 | III/IV | Unspecific | Cisplatin | SD | |
| SRP19 | SNV | Missense_Mutation | c.360A>C | p.Gln120His | p.Q120H | P09132 | protein_coding | tolerated(0.21) | benign(0.081) | TCGA-AA-3977-01 | Colorectum | colon adenocarcinoma | Male | >=65 | I/II | Unknown | Unknown | SD | |
| SRP19 | SNV | Missense_Mutation | novel | c.157N>A | p.Cys53Ser | p.C53S | P09132 | protein_coding | deleterious(0) | probably_damaging(0.935) | TCGA-AJ-A2QM-01 | Endometrium | uterine corpus endometrioid carcinoma | Female | >=65 | I/II | Chemotherapy | carboplatin | CR |
| SRP19 | SNV | Missense_Mutation | c.220C>T | p.Arg74Cys | p.R74C | P09132 | protein_coding | deleterious(0) | benign(0.115) | TCGA-AP-A0LM-01 | Endometrium | uterine corpus endometrioid carcinoma | Female | <65 | III/IV | Chemotherapy | cisplatin | SD | |
| SRP19 | SNV | Missense_Mutation | rs757766883 | c.178N>A | p.Val60Ile | p.V60I | P09132 | protein_coding | tolerated(0.21) | benign(0.034) | TCGA-AX-A0J1-01 | Endometrium | uterine corpus endometrioid carcinoma | Female | >=65 | I/II | Unknown | Unknown | SD |
| SRP19 | SNV | Missense_Mutation | novel | c.423G>T | p.Lys141Asn | p.K141N | P09132 | protein_coding | deleterious(0) | probably_damaging(0.981) | TCGA-AX-A2HC-01 | Endometrium | uterine corpus endometrioid carcinoma | Female | <65 | III/IV | Chemotherapy | paclitaxel | PD |
| SRP19 | SNV | Missense_Mutation | novel | c.275G>T | p.Ser92Ile | p.S92I | P09132 | protein_coding | deleterious(0) | possibly_damaging(0.891) | TCGA-B5-A3FA-01 | Endometrium | uterine corpus endometrioid carcinoma | Female | >=65 | I/II | Unknown | Unknown | SD |
| SRP19 | SNV | Missense_Mutation | c.220N>T | p.Arg74Cys | p.R74C | P09132 | protein_coding | deleterious(0) | benign(0.115) | TCGA-B5-A3FC-01 | Endometrium | uterine corpus endometrioid carcinoma | Female | <65 | I/II | Unknown | Unknown | SD | |
| SRP19 | SNV | Missense_Mutation | novel | c.227N>A | p.Val76Asp | p.V76D | P09132 | protein_coding | tolerated(0.13) | possibly_damaging(0.502) | TCGA-DF-A2KN-01 | Endometrium | uterine corpus endometrioid carcinoma | Female | Unknown | I/II | Unknown | Unknown | SD |
| SRP19 | SNV | Missense_Mutation | rs757766883 | c.178N>A | p.Val60Ile | p.V60I | P09132 | protein_coding | tolerated(0.21) | benign(0.034) | TCGA-EO-A22R-01 | Endometrium | uterine corpus endometrioid carcinoma | Female | <65 | I/II | Unknown | Unknown | SD |
| Page: 1 2 |
Top |
Related drugs of malignant transformation related genes |
| Identification of chemicals and drugs interact with genes involved in malignant transfromation |
| (DGIdb 4.0) |
| Entrez ID | Symbol | Category | Interaction Types | Drug Claim Name | Drug Name | PMIDs |
| 6728 | SRP19 | NA | paroxetine | PAROXETINE | 22795047 | |
| 6728 | SRP19 | NA | citalopram | CITALOPRAM | 22795047 | |
| 6728 | SRP19 | NA | sertraline | SERTRALINE | 22795047 | |
| 6728 | SRP19 | NA | fluoxetine | FLUOXETINE | 22795047 |
| Page: 1 |

Copyright 2023-Present -The University of Texas Health Science Center at Houston |