
|
|||||
|
 | |
| |
| |
| |
| |
| |
|
Gene: SRP14 |
Gene summary for SRP14 |
| Gene information | Species | Human | Gene symbol | SRP14 | Gene ID | 6727 |
| Gene name | signal recognition particle 14 | |
| Gene Alias | ALURBP | |
| Cytomap | 15q15.1 | |
| Gene Type | protein-coding | GO ID | GO:0006605 | UniProtAcc | P37108 |
Top |
Malignant transformation analysis |
| Identification of the aberrant gene expression in precancerous and cancerous lesions by comparing the gene expression of stem-like cells in diseased tissues with normal stem cells |
| Entrez ID | Symbol | Replicates | Species | Organ | Tissue | Adj P-value | Log2FC | Malignancy |
| 6727 | SRP14 | CA_HPV_1 | Human | Cervix | CC | 1.03e-09 | -7.42e-02 | 0.0264 |
| 6727 | SRP14 | CCI_1 | Human | Cervix | CC | 1.74e-35 | -1.38e+00 | 0.528 |
| 6727 | SRP14 | CCI_2 | Human | Cervix | CC | 5.07e-10 | -7.31e-01 | 0.5249 |
| 6727 | SRP14 | CCI_3 | Human | Cervix | CC | 1.15e-48 | -1.45e+00 | 0.516 |
| 6727 | SRP14 | CCII_1 | Human | Cervix | CC | 2.09e-63 | -1.45e+00 | 0.3249 |
| 6727 | SRP14 | Tumor | Human | Cervix | CC | 6.64e-04 | -1.27e-01 | 0.1241 |
| 6727 | SRP14 | sample3 | Human | Cervix | CC | 6.01e-17 | -1.96e-01 | 0.1387 |
| 6727 | SRP14 | L1 | Human | Cervix | CC | 5.33e-10 | -4.39e-01 | 0.0802 |
| 6727 | SRP14 | T1 | Human | Cervix | CC | 7.03e-08 | -3.14e-01 | 0.0918 |
| 6727 | SRP14 | T3 | Human | Cervix | CC | 8.06e-11 | -2.22e-01 | 0.1389 |
| 6727 | SRP14 | HTA11_3410_2000001011 | Human | Colorectum | AD | 6.60e-28 | 7.59e-01 | 0.0155 |
| 6727 | SRP14 | HTA11_2487_2000001011 | Human | Colorectum | SER | 2.70e-35 | 1.31e+00 | -0.1808 |
| 6727 | SRP14 | HTA11_2951_2000001011 | Human | Colorectum | AD | 6.27e-09 | 1.02e+00 | 0.0216 |
| 6727 | SRP14 | HTA11_1938_2000001011 | Human | Colorectum | AD | 2.90e-40 | 1.65e+00 | -0.0811 |
| 6727 | SRP14 | HTA11_78_2000001011 | Human | Colorectum | AD | 5.12e-21 | 8.79e-01 | -0.1088 |
| 6727 | SRP14 | HTA11_347_2000001011 | Human | Colorectum | AD | 1.80e-74 | 1.62e+00 | -0.1954 |
| 6727 | SRP14 | HTA11_411_2000001011 | Human | Colorectum | SER | 1.86e-18 | 2.12e+00 | -0.2602 |
| 6727 | SRP14 | HTA11_2112_2000001011 | Human | Colorectum | SER | 3.43e-10 | 1.39e+00 | -0.2196 |
| 6727 | SRP14 | HTA11_3361_2000001011 | Human | Colorectum | AD | 1.90e-17 | 1.04e+00 | -0.1207 |
| 6727 | SRP14 | HTA11_83_2000001011 | Human | Colorectum | SER | 2.53e-33 | 1.35e+00 | -0.1526 |
| Page: 1 2 3 4 5 6 7 8 9 10 11 12 13 14 |
| Tissue | Expression Dynamics | Abbreviation |
| Cervix | 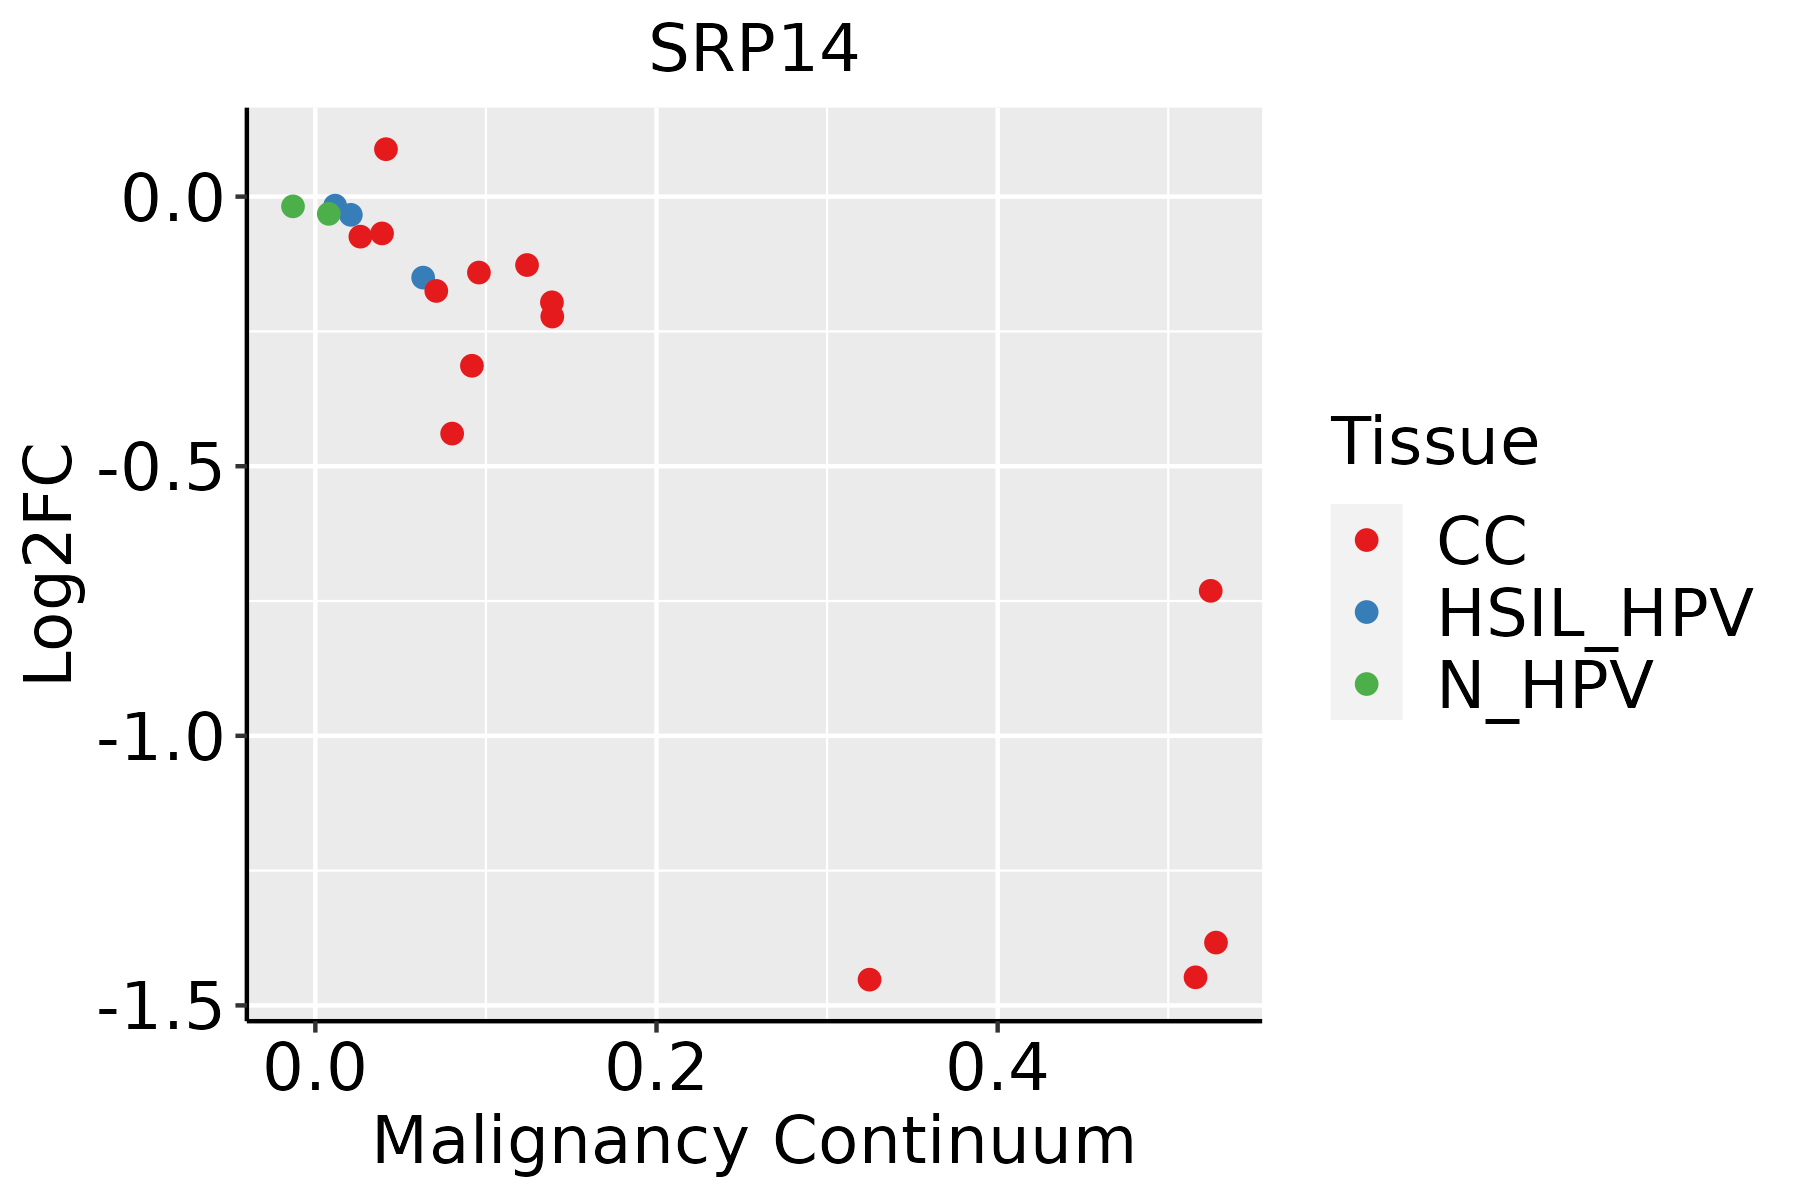 | CC: Cervix cancer |
| HSIL_HPV: HPV-infected high-grade squamous intraepithelial lesions | ||
| N_HPV: HPV-infected normal cervix | ||
| Colorectum (GSE201348) |  | FAP: Familial adenomatous polyposis |
| CRC: Colorectal cancer | ||
| Colorectum (HTA11) |  | AD: Adenomas |
| SER: Sessile serrated lesions | ||
| MSI-H: Microsatellite-high colorectal cancer | ||
| MSS: Microsatellite stable colorectal cancer | ||
| Endometrium |  | AEH: Atypical endometrial hyperplasia |
| EEC: Endometrioid Cancer | ||
| Esophagus | 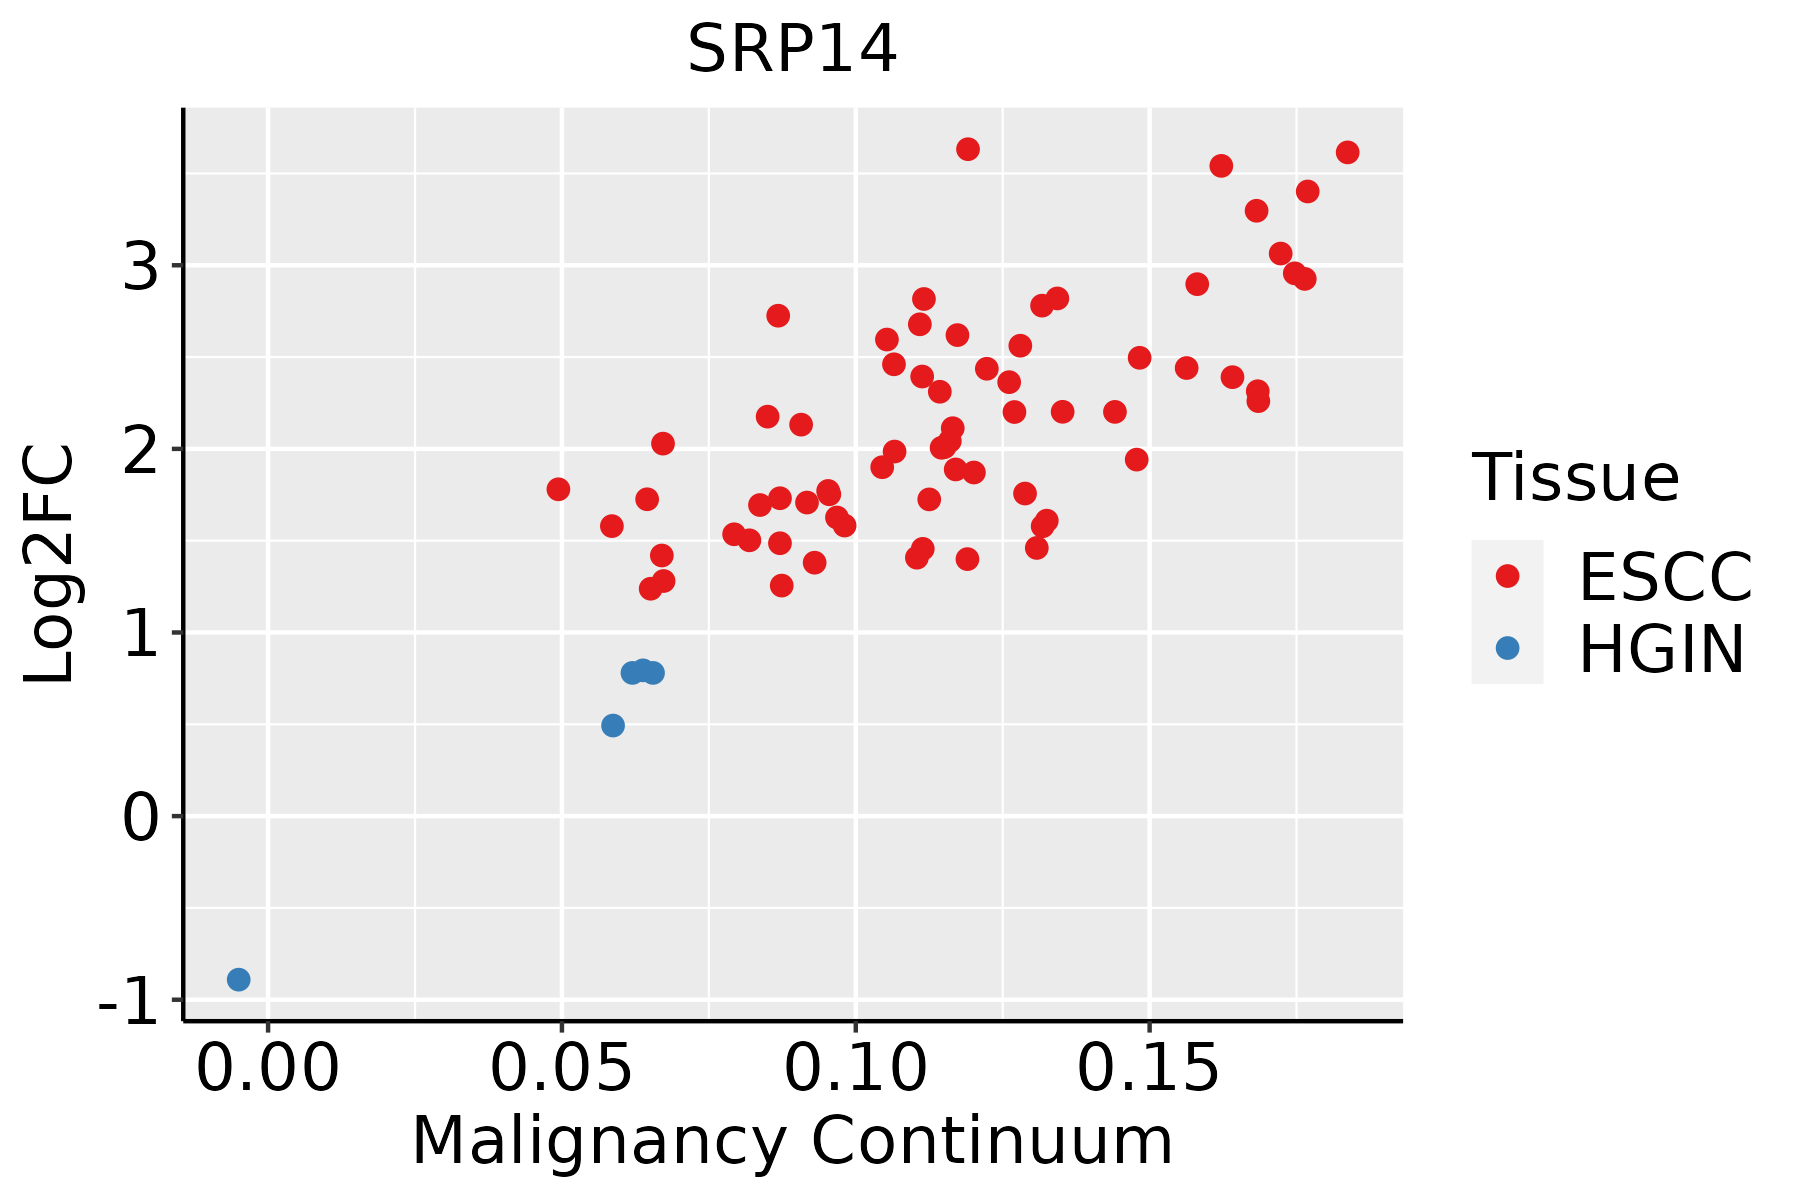 | ESCC: Esophageal squamous cell carcinoma |
| HGIN: High-grade intraepithelial neoplasias | ||
| LGIN: Low-grade intraepithelial neoplasias | ||
| Liver |  | HCC: Hepatocellular carcinoma |
| NAFLD: Non-alcoholic fatty liver disease | ||
| Oral Cavity |  | EOLP: Erosive Oral lichen planus |
| LP: leukoplakia | ||
| NEOLP: Non-erosive oral lichen planus | ||
| OSCC: Oral squamous cell carcinoma | ||
| Prostate |  | BPH: Benign Prostatic Hyperplasia |
| Skin |  | AK: Actinic keratosis |
| cSCC: Cutaneous squamous cell carcinoma | ||
| SCCIS:squamous cell carcinoma in situ | ||
| Thyroid | 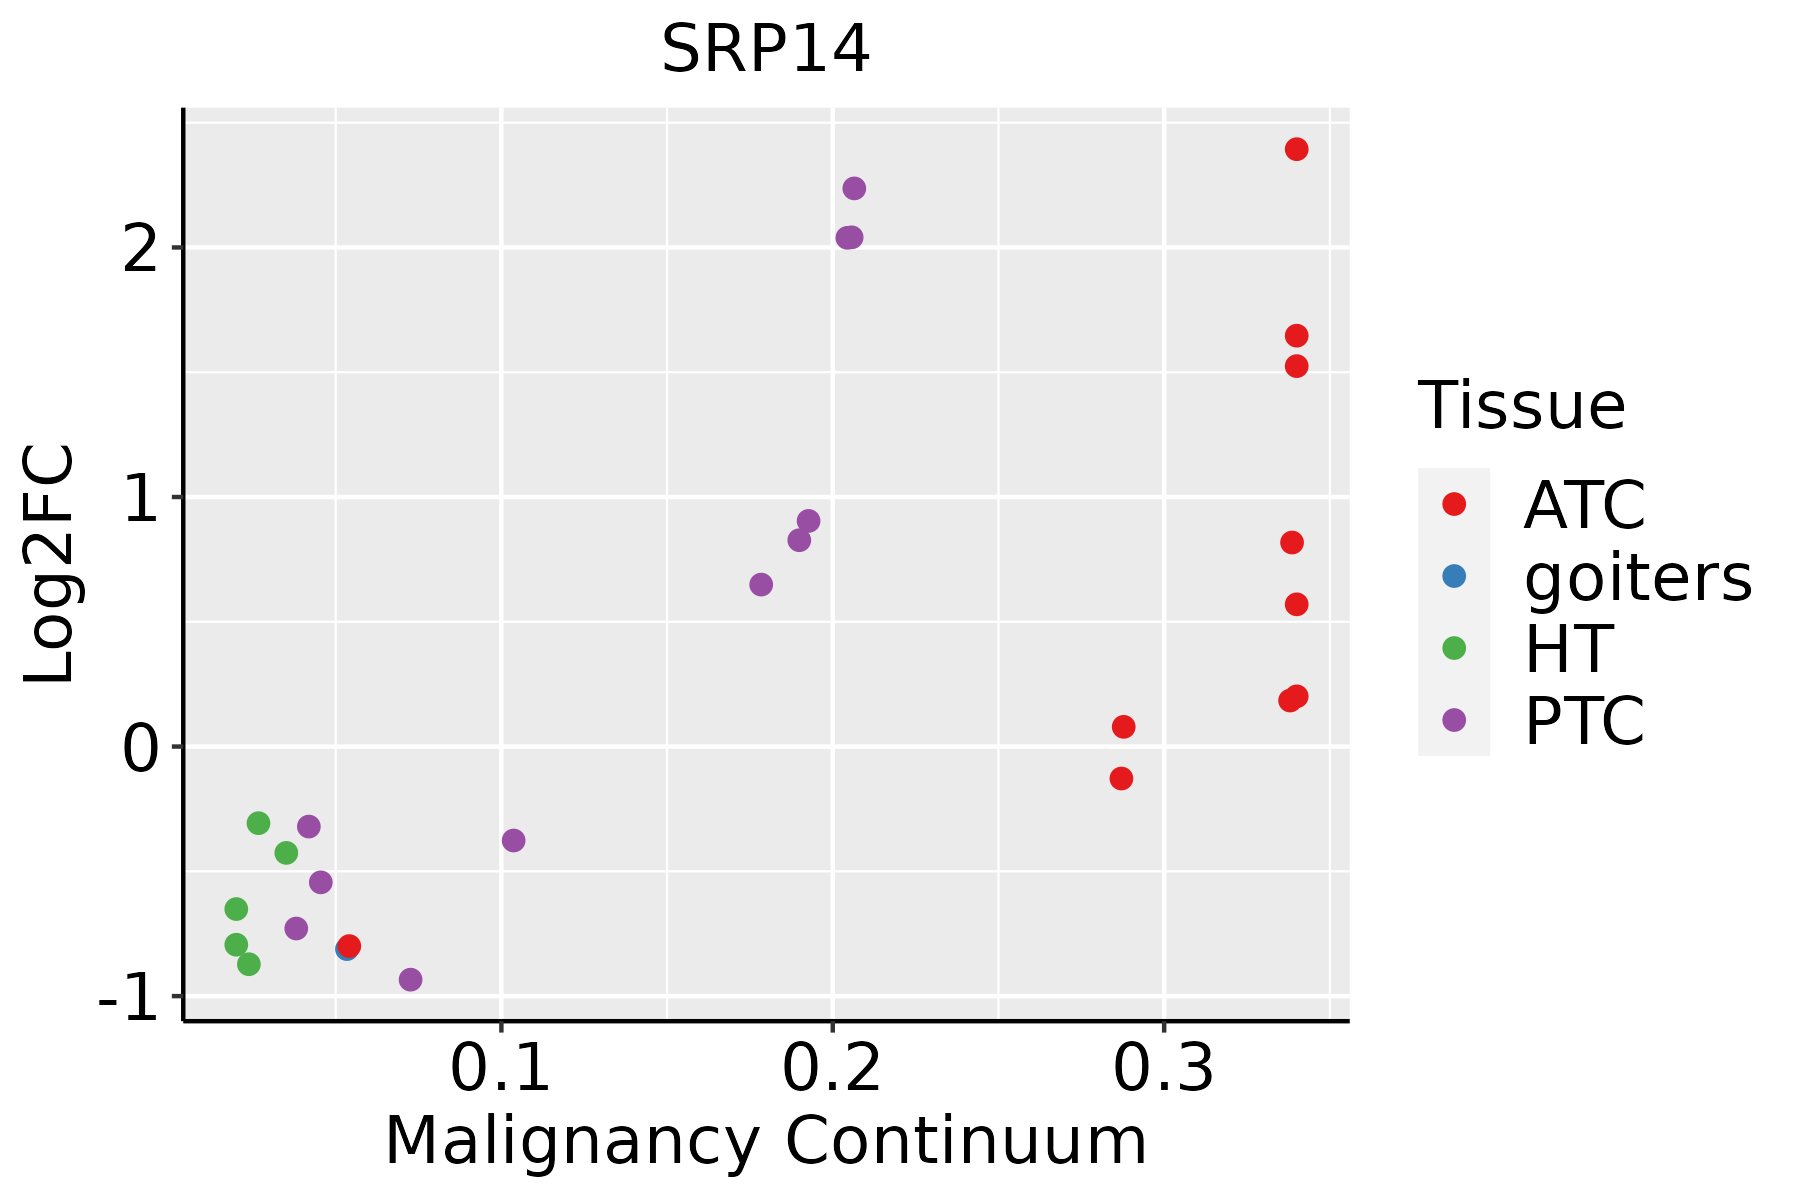 | ATC: Anaplastic thyroid cancer |
| HT: Hashimoto's thyroiditis | ||
| PTC: Papillary thyroid cancer |
| ∗log2FC in expression of this searched gene in stem-like cells from each diseased tissue sample relative to stem-like cells in normal samples in each tissue plotted against the malignancy continuum. Samples are colored based on if they are from different disease stage. |
Top |
Malignant transformation related pathway analysis |
| Find out the enriched GO biological processes and KEGG pathways involved in transition from healthy to precancer to cancer |
| Tissue | Disease Stage | Enriched GO biological Processes |
| Colorectum | AD |  |
| Colorectum | SER |  |
| Colorectum | MSS |  |
| Colorectum | MSI-H |  |
| Colorectum | FAP |  |
| ∗Top 15 enriched GO BP terms are showed in the bar plot of each disease state in each tissue. Each row represents a significant GO biological process which is colored according to the -log10(p.adjust). |
| Page: 1 2 3 4 5 6 7 8 9 |
| GO ID | Tissue | Disease Stage | Description | Gene Ratio | Bg Ratio | pvalue | p.adjust | Count |
| GO:00725949 | Cervix | CC | establishment of protein localization to organelle | 99/2311 | 422/18723 | 1.23e-10 | 2.11e-08 | 99 |
| GO:000660510 | Cervix | CC | protein targeting | 68/2311 | 314/18723 | 2.17e-06 | 6.55e-05 | 68 |
| GO:00901509 | Cervix | CC | establishment of protein localization to membrane | 54/2311 | 260/18723 | 7.67e-05 | 1.05e-03 | 54 |
| GO:00709726 | Cervix | CC | protein localization to endoplasmic reticulum | 21/2311 | 74/18723 | 1.69e-04 | 2.00e-03 | 21 |
| GO:00725995 | Cervix | CC | establishment of protein localization to endoplasmic reticulum | 13/2311 | 46/18723 | 2.95e-03 | 1.94e-02 | 13 |
| GO:0072594 | Colorectum | AD | establishment of protein localization to organelle | 148/3918 | 422/18723 | 7.95e-12 | 1.04e-09 | 148 |
| GO:0090150 | Colorectum | AD | establishment of protein localization to membrane | 100/3918 | 260/18723 | 6.01e-11 | 6.33e-09 | 100 |
| GO:0006605 | Colorectum | AD | protein targeting | 105/3918 | 314/18723 | 1.39e-07 | 6.44e-06 | 105 |
| GO:0070972 | Colorectum | AD | protein localization to endoplasmic reticulum | 26/3918 | 74/18723 | 3.28e-03 | 2.40e-02 | 26 |
| GO:00725941 | Colorectum | SER | establishment of protein localization to organelle | 111/2897 | 422/18723 | 4.98e-09 | 4.49e-07 | 111 |
| GO:00901501 | Colorectum | SER | establishment of protein localization to membrane | 68/2897 | 260/18723 | 5.55e-06 | 2.01e-04 | 68 |
| GO:00066051 | Colorectum | SER | protein targeting | 76/2897 | 314/18723 | 3.19e-05 | 8.47e-04 | 76 |
| GO:00725942 | Colorectum | MSS | establishment of protein localization to organelle | 139/3467 | 422/18723 | 5.75e-13 | 1.12e-10 | 139 |
| GO:00901502 | Colorectum | MSS | establishment of protein localization to membrane | 90/3467 | 260/18723 | 4.11e-10 | 3.49e-08 | 90 |
| GO:00066052 | Colorectum | MSS | protein targeting | 97/3467 | 314/18723 | 6.76e-08 | 3.46e-06 | 97 |
| GO:00709721 | Colorectum | MSS | protein localization to endoplasmic reticulum | 25/3467 | 74/18723 | 1.25e-03 | 1.20e-02 | 25 |
| GO:00725943 | Colorectum | MSI-H | establishment of protein localization to organelle | 63/1319 | 422/18723 | 1.10e-08 | 1.33e-06 | 63 |
| GO:00066053 | Colorectum | MSI-H | protein targeting | 44/1319 | 314/18723 | 9.50e-06 | 4.55e-04 | 44 |
| GO:00709722 | Colorectum | MSI-H | protein localization to endoplasmic reticulum | 15/1319 | 74/18723 | 1.69e-04 | 4.73e-03 | 15 |
| GO:0045047 | Colorectum | MSI-H | protein targeting to ER | 10/1319 | 42/18723 | 5.34e-04 | 1.10e-02 | 10 |
| Page: 1 2 3 4 5 6 7 8 |
| Pathway ID | Tissue | Disease Stage | Description | Gene Ratio | Bg Ratio | pvalue | p.adjust | qvalue | Count |
| hsa0306010 | Cervix | CC | Protein export | 10/1267 | 23/8465 | 9.64e-04 | 4.22e-03 | 2.49e-03 | 10 |
| hsa0306013 | Cervix | CC | Protein export | 10/1267 | 23/8465 | 9.64e-04 | 4.22e-03 | 2.49e-03 | 10 |
| hsa03060 | Colorectum | AD | Protein export | 14/2092 | 23/8465 | 2.43e-04 | 1.90e-03 | 1.21e-03 | 14 |
| hsa030601 | Colorectum | AD | Protein export | 14/2092 | 23/8465 | 2.43e-04 | 1.90e-03 | 1.21e-03 | 14 |
| hsa030602 | Colorectum | MSS | Protein export | 15/1875 | 23/8465 | 1.13e-05 | 1.26e-04 | 7.71e-05 | 15 |
| hsa030603 | Colorectum | MSS | Protein export | 15/1875 | 23/8465 | 1.13e-05 | 1.26e-04 | 7.71e-05 | 15 |
| hsa030604 | Colorectum | MSI-H | Protein export | 11/797 | 23/8465 | 2.26e-06 | 3.65e-05 | 3.06e-05 | 11 |
| hsa030605 | Colorectum | MSI-H | Protein export | 11/797 | 23/8465 | 2.26e-06 | 3.65e-05 | 3.06e-05 | 11 |
| hsa030606 | Colorectum | FAP | Protein export | 10/1404 | 23/8465 | 2.17e-03 | 1.05e-02 | 6.39e-03 | 10 |
| hsa030607 | Colorectum | FAP | Protein export | 10/1404 | 23/8465 | 2.17e-03 | 1.05e-02 | 6.39e-03 | 10 |
| hsa0306014 | Endometrium | AEH | Protein export | 11/1197 | 23/8465 | 1.14e-04 | 1.06e-03 | 7.73e-04 | 11 |
| hsa0306015 | Endometrium | AEH | Protein export | 11/1197 | 23/8465 | 1.14e-04 | 1.06e-03 | 7.73e-04 | 11 |
| hsa0306023 | Endometrium | EEC | Protein export | 11/1237 | 23/8465 | 1.54e-04 | 1.41e-03 | 1.05e-03 | 11 |
| hsa0306033 | Endometrium | EEC | Protein export | 11/1237 | 23/8465 | 1.54e-04 | 1.41e-03 | 1.05e-03 | 11 |
| hsa0306026 | Esophagus | ESCC | Protein export | 22/4205 | 23/8465 | 2.43e-06 | 1.43e-05 | 7.32e-06 | 22 |
| hsa0306036 | Esophagus | ESCC | Protein export | 22/4205 | 23/8465 | 2.43e-06 | 1.43e-05 | 7.32e-06 | 22 |
| hsa030608 | Liver | Cirrhotic | Protein export | 20/2530 | 23/8465 | 2.00e-08 | 3.51e-07 | 2.17e-07 | 20 |
| hsa0306011 | Liver | Cirrhotic | Protein export | 20/2530 | 23/8465 | 2.00e-08 | 3.51e-07 | 2.17e-07 | 20 |
| hsa0306021 | Liver | HCC | Protein export | 21/4020 | 23/8465 | 1.20e-05 | 8.53e-05 | 4.74e-05 | 21 |
| hsa0306031 | Liver | HCC | Protein export | 21/4020 | 23/8465 | 1.20e-05 | 8.53e-05 | 4.74e-05 | 21 |
| Page: 1 2 |
Top |
Cell-cell communication analysis |
| Identification of potential cell-cell interactions between two cell types and their ligand-receptor pairs for different disease states |
| Ligand | Receptor | LRpair | Pathway | Tissue | Disease Stage |
| Page: 1 |
Top |
Single-cell gene regulatory network inference analysis |
| Find out the significant the regulons (TFs) and the target genes of each regulon across cell types for different disease states |
| TF | Cell Type | Tissue | Disease Stage | Target Gene | RSS | Regulon Activity |
| ∗The dot plots of a searched regulon are shown for all cell subpopulations in each disease state of each tissue based on the regulon specific score inferred using pySCENIC and by calculating the average expression. |
| Page: 1 |
Top |
Somatic mutation of malignant transformation related genes |
| Annotation of somatic variants for genes involved in malignant transformation |
| Hugo Symbol | Variant Class | Variant Classification | dbSNP RS | HGVSc | HGVSp | HGVSp Short | SWISSPROT | BIOTYPE | SIFT | PolyPhen | Tumor Sample Barcode | Tissue | Histology | Sex | Age | Stage | Therapy Types | Drugs | Outcome |
| SRP14 | insertion | Nonsense_Mutation | novel | c.344_345insTTTAGCTCTATAATATCTTCTAGGTTAT | p.Ala116LeufsTer4 | p.A116Lfs*4 | P37108 | protein_coding | TCGA-AN-A0AR-01 | Breast | breast invasive carcinoma | Female | <65 | I/II | Unknown | Unknown | SD | ||
| SRP14 | SNV | Missense_Mutation | novel | c.233A>C | p.Lys78Thr | p.K78T | P37108 | protein_coding | deleterious(0.03) | probably_damaging(0.991) | TCGA-A5-A2K5-01 | Endometrium | uterine corpus endometrioid carcinoma | Female | >=65 | I/II | Unknown | Unknown | SD |
| SRP14 | SNV | Missense_Mutation | rs199851589 | c.355N>A | p.Ala119Thr | p.A119T | P37108 | protein_coding | deleterious_low_confidence(0.04) | possibly_damaging(0.499) | TCGA-AP-A059-01 | Endometrium | uterine corpus endometrioid carcinoma | Female | >=65 | I/II | Unknown | Unknown | SD |
| SRP14 | SNV | Missense_Mutation | c.209T>C | p.Val70Ala | p.V70A | P37108 | protein_coding | deleterious(0.03) | possibly_damaging(0.771) | TCGA-AP-A0LM-01 | Endometrium | uterine corpus endometrioid carcinoma | Female | <65 | III/IV | Chemotherapy | cisplatin | SD | |
| SRP14 | SNV | Missense_Mutation | rs747352139 | c.328N>A | p.Ala110Thr | p.A110T | P37108 | protein_coding | tolerated(0.1) | possibly_damaging(0.483) | TCGA-AP-A1DK-01 | Endometrium | uterine corpus endometrioid carcinoma | Female | <65 | I/II | Unknown | Unknown | SD |
| SRP14 | SNV | Missense_Mutation | rs16924521 | c.379N>A | p.Ala127Thr | p.A127T | P37108 | protein_coding | benign(0) | TCGA-AX-A064-01 | Endometrium | uterine corpus endometrioid carcinoma | Female | >=65 | I/II | Unknown | Unknown | SD | |
| SRP14 | SNV | Missense_Mutation | novel | c.197A>C | p.Lys66Thr | p.K66T | P37108 | protein_coding | tolerated(0.12) | possibly_damaging(0.764) | TCGA-AX-A1CE-01 | Endometrium | uterine corpus endometrioid carcinoma | Female | <65 | I/II | Unspecific | Paclitaxel | SD |
| SRP14 | SNV | Missense_Mutation | novel | c.292N>T | p.Asp98Tyr | p.D98Y | P37108 | protein_coding | deleterious(0) | probably_damaging(0.996) | TCGA-B5-A1MR-01 | Endometrium | uterine corpus endometrioid carcinoma | Female | >=65 | III/IV | Unknown | Unknown | SD |
| SRP14 | SNV | Missense_Mutation | novel | c.285N>T | p.Lys95Asn | p.K95N | P37108 | protein_coding | deleterious(0) | probably_damaging(0.974) | TCGA-BK-A6W3-01 | Endometrium | uterine corpus endometrioid carcinoma | Female | <65 | I/II | Unknown | Unknown | SD |
| SRP14 | SNV | Missense_Mutation | rs200831083 | c.373A>G | p.Thr125Ala | p.T125A | P37108 | protein_coding | tolerated_low_confidence(0.27) | benign(0) | TCGA-BS-A0VI-01 | Endometrium | uterine corpus endometrioid carcinoma | Female | <65 | I/II | Unknown | Unknown | SD |
| Page: 1 2 |
Top |
Related drugs of malignant transformation related genes |
| Identification of chemicals and drugs interact with genes involved in malignant transfromation |
| (DGIdb 4.0) |
| Entrez ID | Symbol | Category | Interaction Types | Drug Claim Name | Drug Name | PMIDs |
| Page: 1 |

Copyright 2023-Present -The University of Texas Health Science Center at Houston |