
|
|||||
|
 | |
| |
| |
| |
| |
| |
|
Gene: SRM |
Gene summary for SRM |
| Gene information | Species | Human | Gene symbol | SRM | Gene ID | 6723 |
| Gene name | spermidine synthase | |
| Gene Alias | PAPT | |
| Cytomap | 1p36.22 | |
| Gene Type | protein-coding | GO ID | GO:0006576 | UniProtAcc | P19623 |
Top |
Malignant transformation analysis |
| Identification of the aberrant gene expression in precancerous and cancerous lesions by comparing the gene expression of stem-like cells in diseased tissues with normal stem cells |
| Entrez ID | Symbol | Replicates | Species | Organ | Tissue | Adj P-value | Log2FC | Malignancy |
| 6723 | SRM | GSM4909288 | Human | Breast | IDC | 2.60e-03 | 7.39e-02 | 0.0988 |
| 6723 | SRM | GSM4909296 | Human | Breast | IDC | 1.99e-02 | -4.97e-02 | 0.1524 |
| 6723 | SRM | GSM4909297 | Human | Breast | IDC | 6.18e-10 | -2.31e-01 | 0.1517 |
| 6723 | SRM | GSM4909301 | Human | Breast | IDC | 1.34e-02 | -1.78e-01 | 0.1577 |
| 6723 | SRM | GSM4909304 | Human | Breast | IDC | 2.13e-13 | 5.11e-01 | 0.1636 |
| 6723 | SRM | GSM4909311 | Human | Breast | IDC | 6.70e-14 | -1.92e-01 | 0.1534 |
| 6723 | SRM | GSM4909312 | Human | Breast | IDC | 2.64e-06 | -2.17e-01 | 0.1552 |
| 6723 | SRM | GSM4909316 | Human | Breast | IDC | 3.05e-11 | 6.73e-01 | 0.21 |
| 6723 | SRM | GSM4909319 | Human | Breast | IDC | 5.92e-21 | -9.59e-02 | 0.1563 |
| 6723 | SRM | GSM4909321 | Human | Breast | IDC | 3.10e-10 | 2.59e-01 | 0.1559 |
| 6723 | SRM | brca1 | Human | Breast | Precancer | 2.05e-12 | 4.91e-01 | -0.0338 |
| 6723 | SRM | brca2 | Human | Breast | Precancer | 2.97e-06 | 3.00e-01 | -0.024 |
| 6723 | SRM | brca3 | Human | Breast | Precancer | 1.61e-02 | 2.65e-01 | -0.0263 |
| 6723 | SRM | brca10 | Human | Breast | Precancer | 3.59e-03 | -2.41e-01 | -0.0029 |
| 6723 | SRM | NCCBC11 | Human | Breast | DCIS | 4.84e-02 | 3.53e-01 | 0.1232 |
| 6723 | SRM | NCCBC6 | Human | Breast | DCIS | 9.81e-06 | 5.83e-01 | 0.2095 |
| 6723 | SRM | P1 | Human | Breast | IDC | 1.50e-05 | -1.38e-01 | 0.1527 |
| 6723 | SRM | DCIS2 | Human | Breast | DCIS | 4.80e-56 | 2.78e-01 | 0.0085 |
| 6723 | SRM | HTA11_1938_2000001011 | Human | Colorectum | AD | 1.88e-03 | 2.51e-01 | -0.0811 |
| 6723 | SRM | HTA11_347_2000001011 | Human | Colorectum | AD | 7.06e-03 | 1.64e-01 | -0.1954 |
| Page: 1 2 3 4 5 6 7 8 9 |
| Tissue | Expression Dynamics | Abbreviation |
| Breast |  | IDC: Invasive ductal carcinoma |
| DCIS: Ductal carcinoma in situ | ||
| Precancer(BRCA1-mut): Precancerous lesion from BRCA1 mutation carriers | ||
| Colorectum (GSE201348) |  | FAP: Familial adenomatous polyposis |
| CRC: Colorectal cancer | ||
| Colorectum (HTA11) |  | AD: Adenomas |
| SER: Sessile serrated lesions | ||
| MSI-H: Microsatellite-high colorectal cancer | ||
| MSS: Microsatellite stable colorectal cancer | ||
| Endometrium | 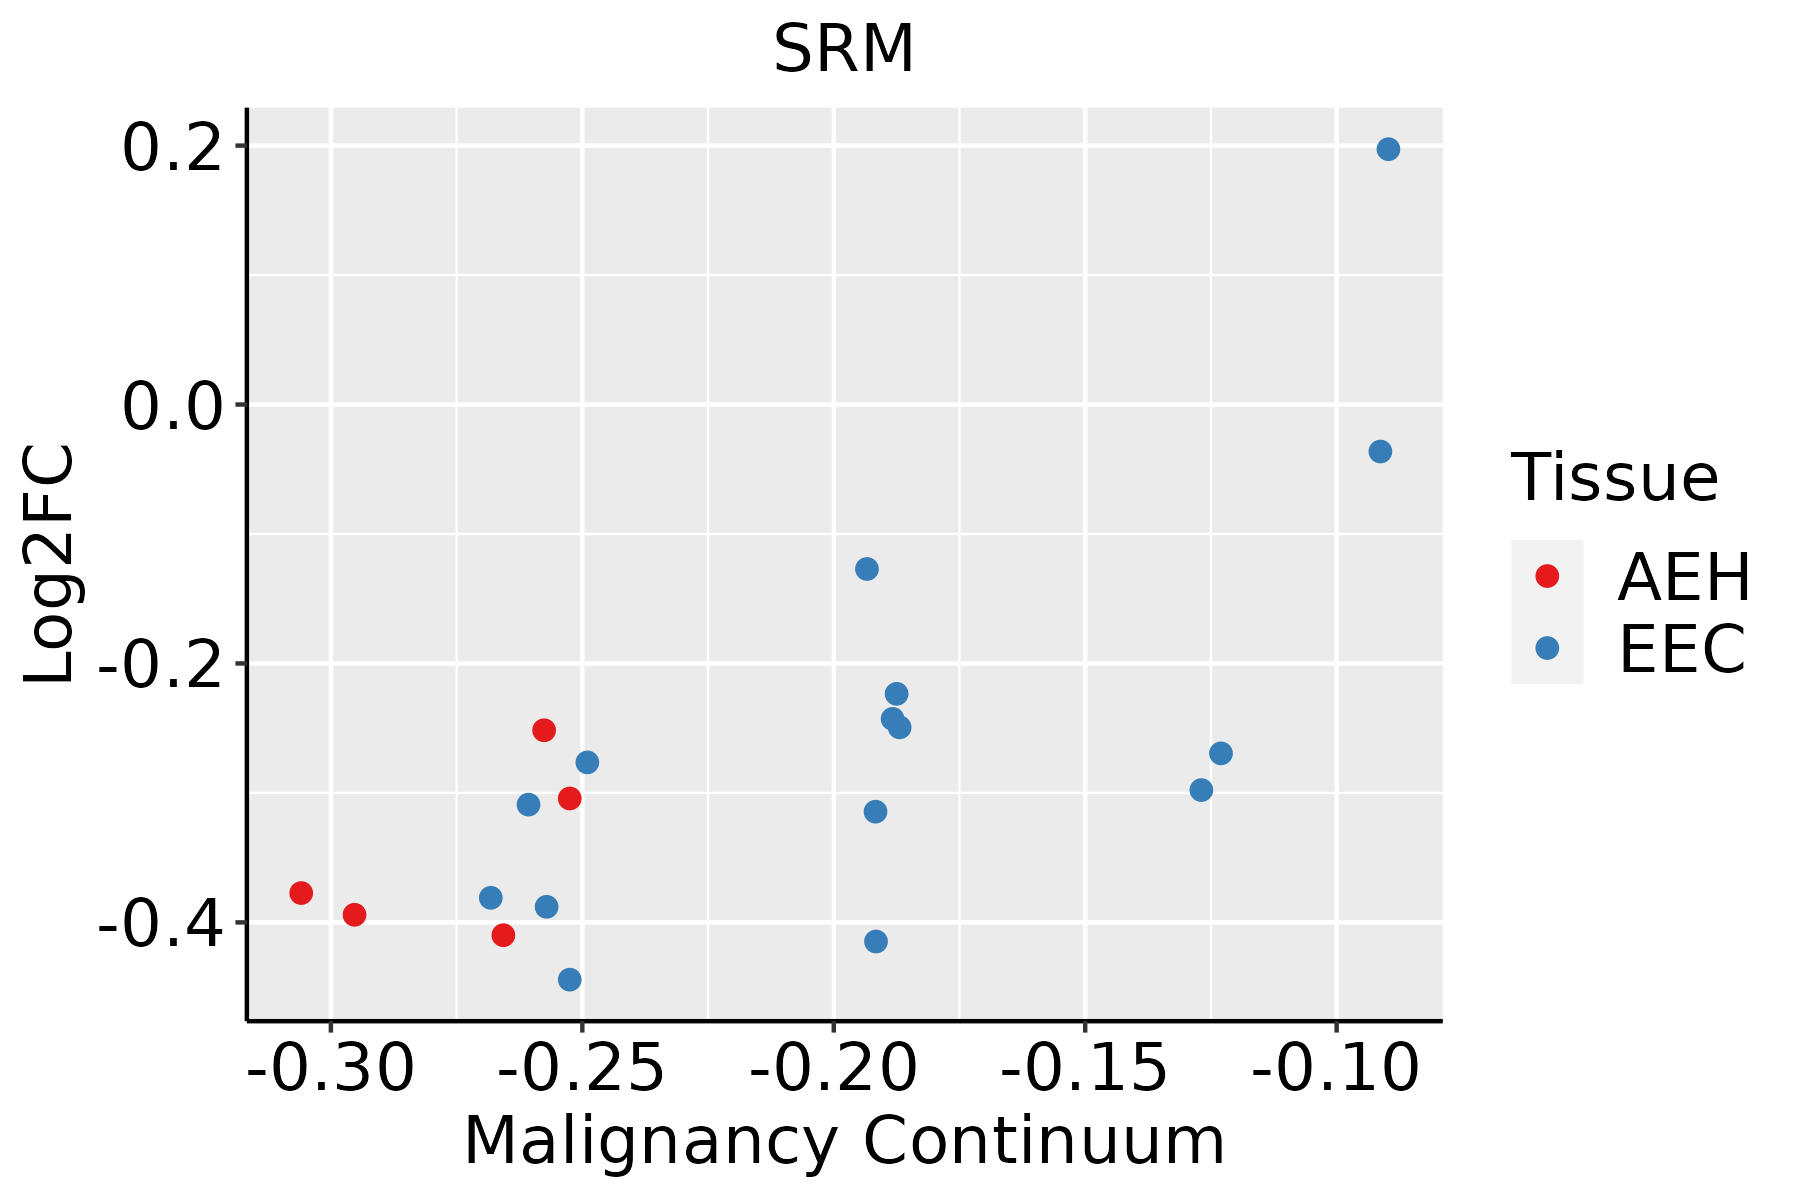 | AEH: Atypical endometrial hyperplasia |
| EEC: Endometrioid Cancer | ||
| Esophagus |  | ESCC: Esophageal squamous cell carcinoma |
| HGIN: High-grade intraepithelial neoplasias | ||
| LGIN: Low-grade intraepithelial neoplasias | ||
| Liver | 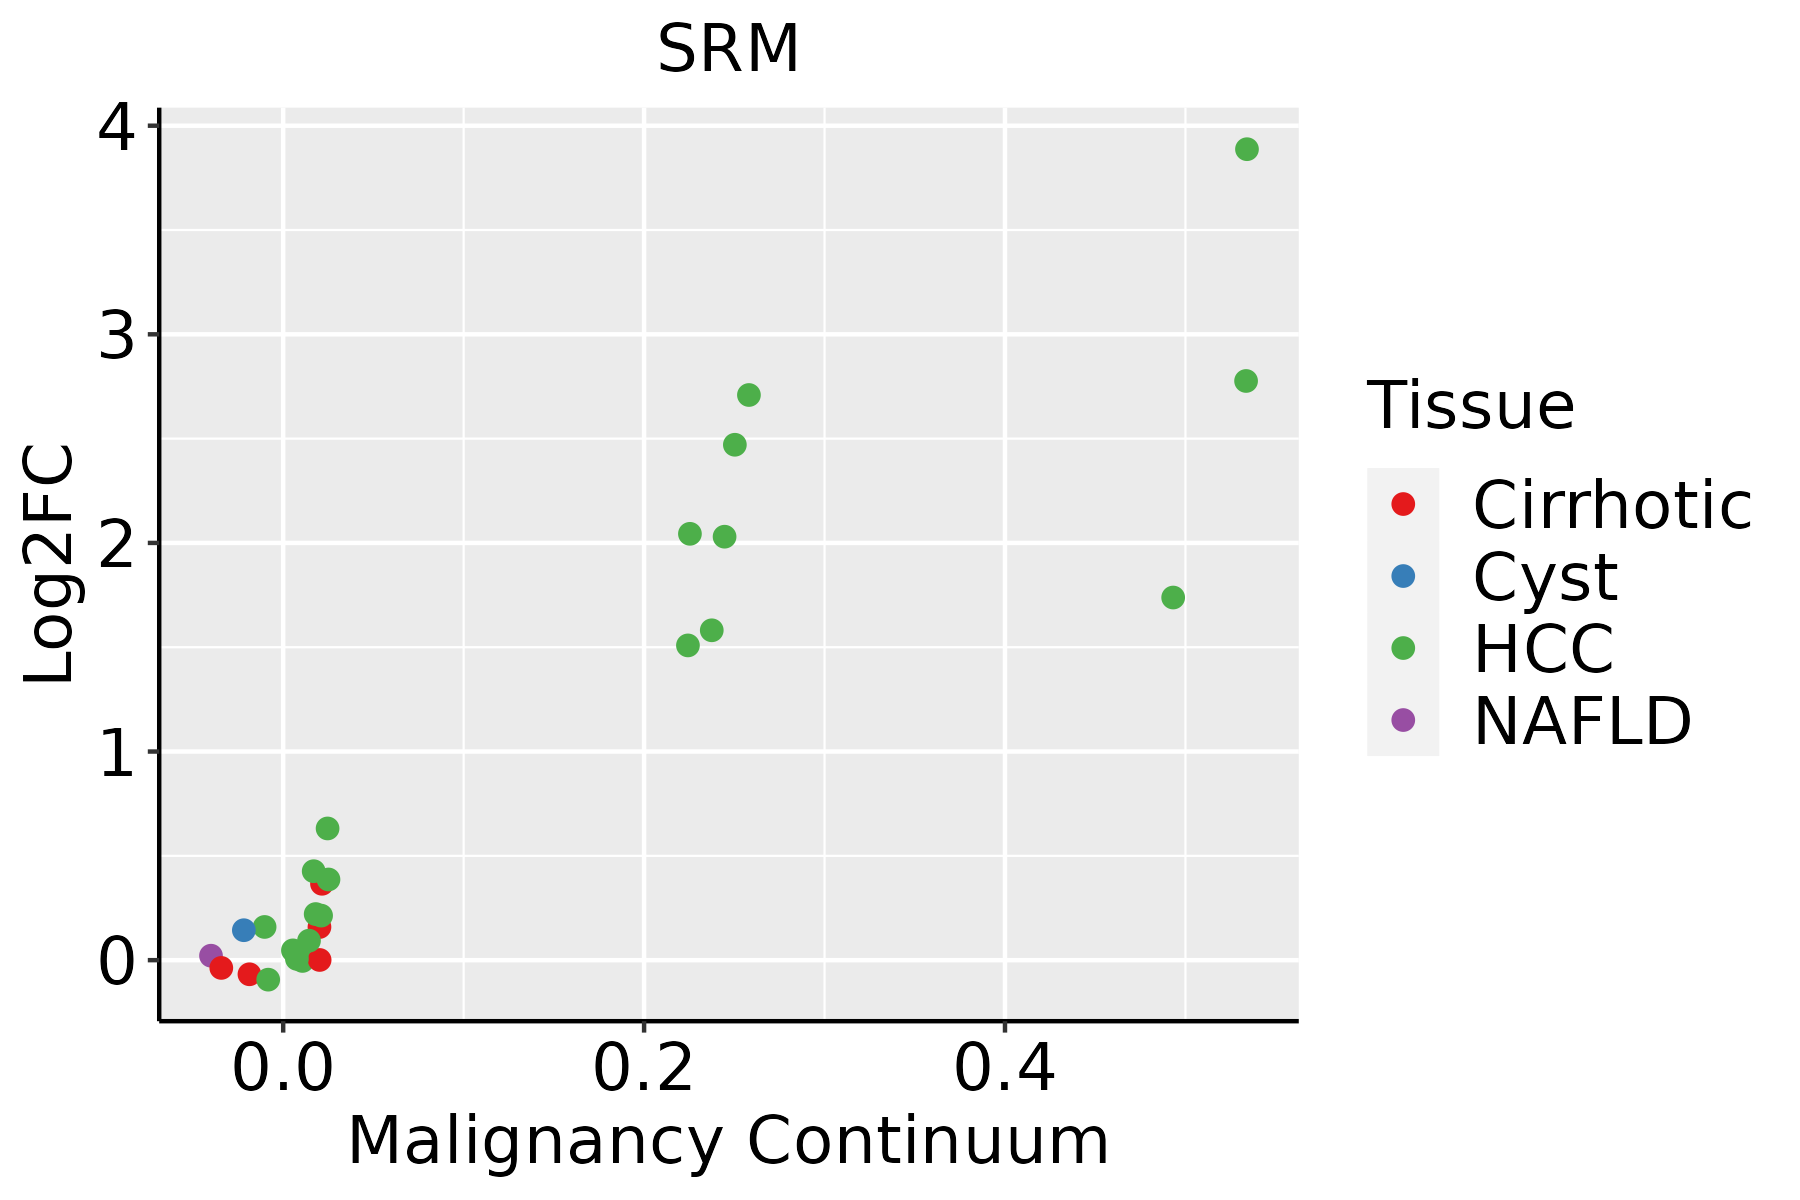 | HCC: Hepatocellular carcinoma |
| NAFLD: Non-alcoholic fatty liver disease | ||
| Oral Cavity | 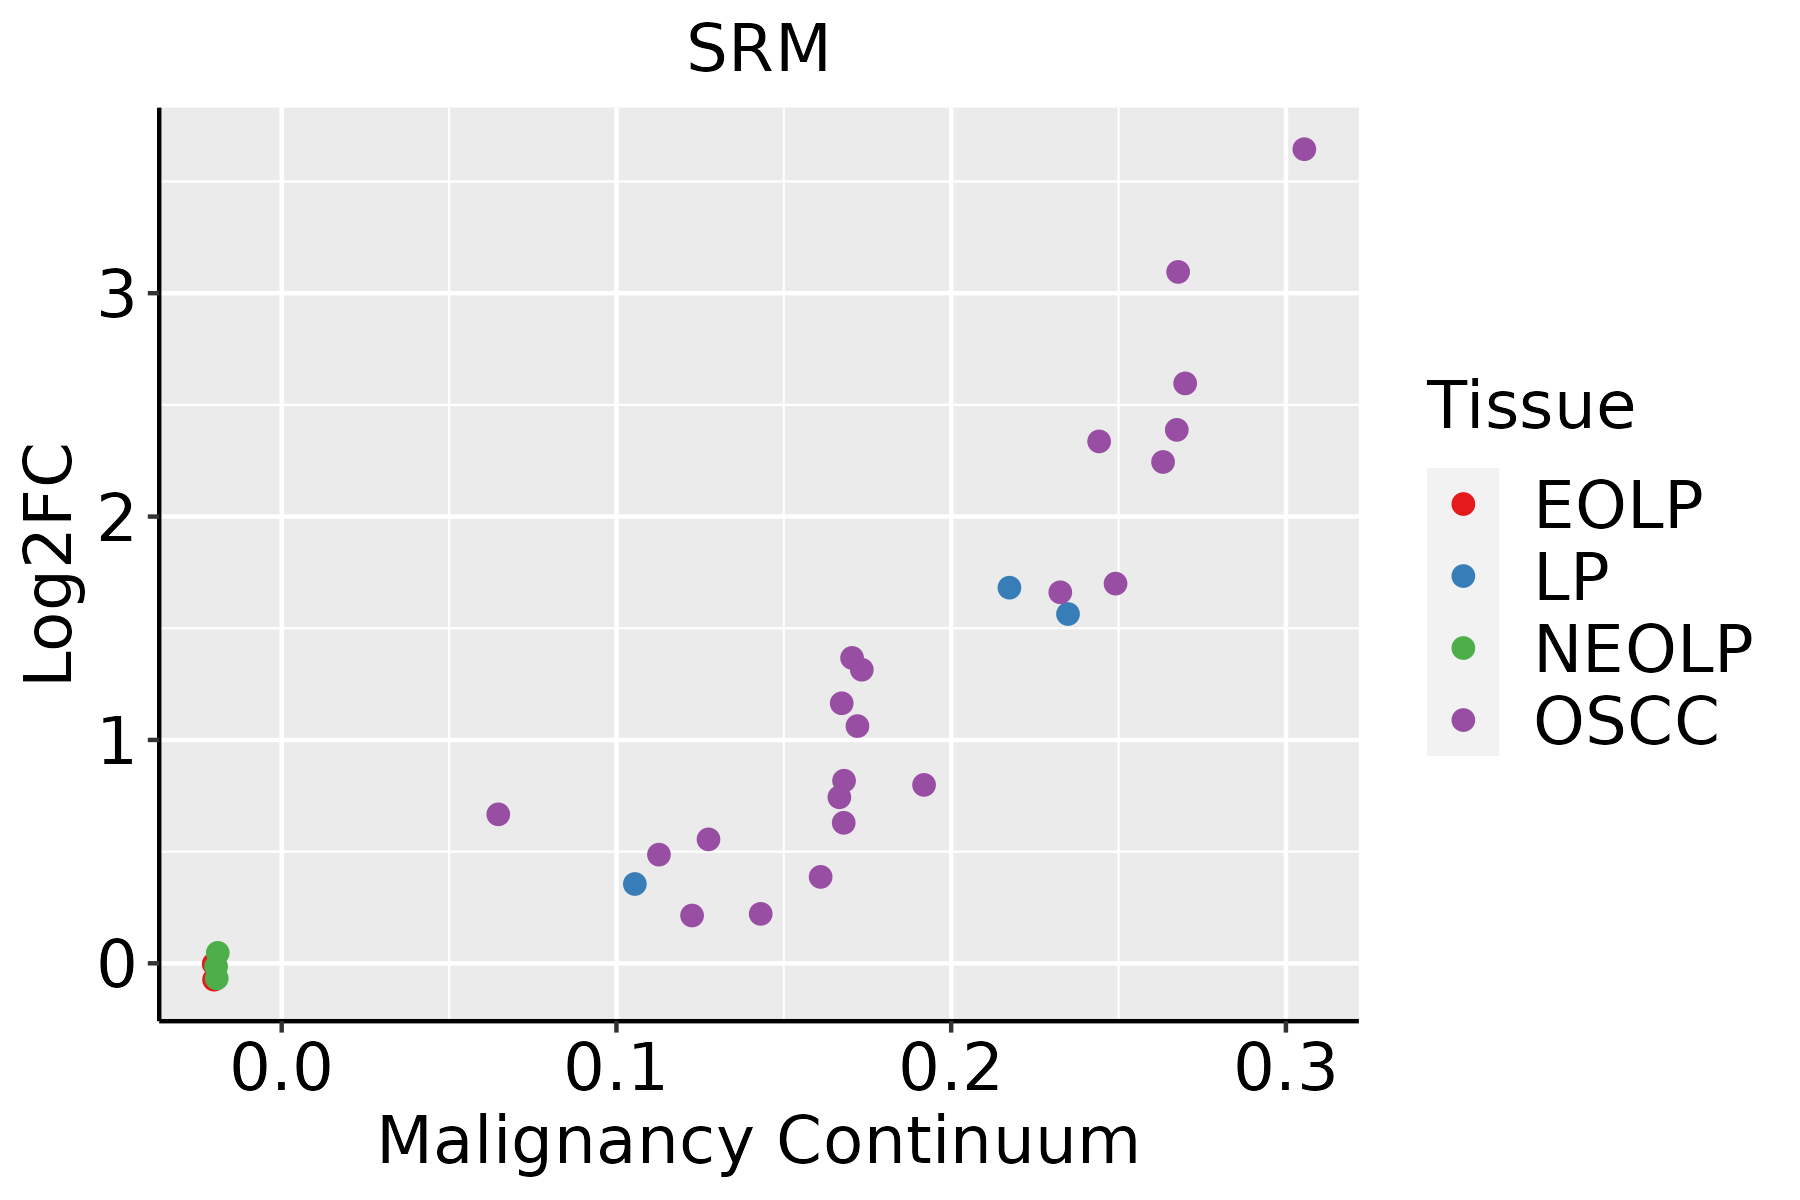 | EOLP: Erosive Oral lichen planus |
| LP: leukoplakia | ||
| NEOLP: Non-erosive oral lichen planus | ||
| OSCC: Oral squamous cell carcinoma | ||
| Prostate | 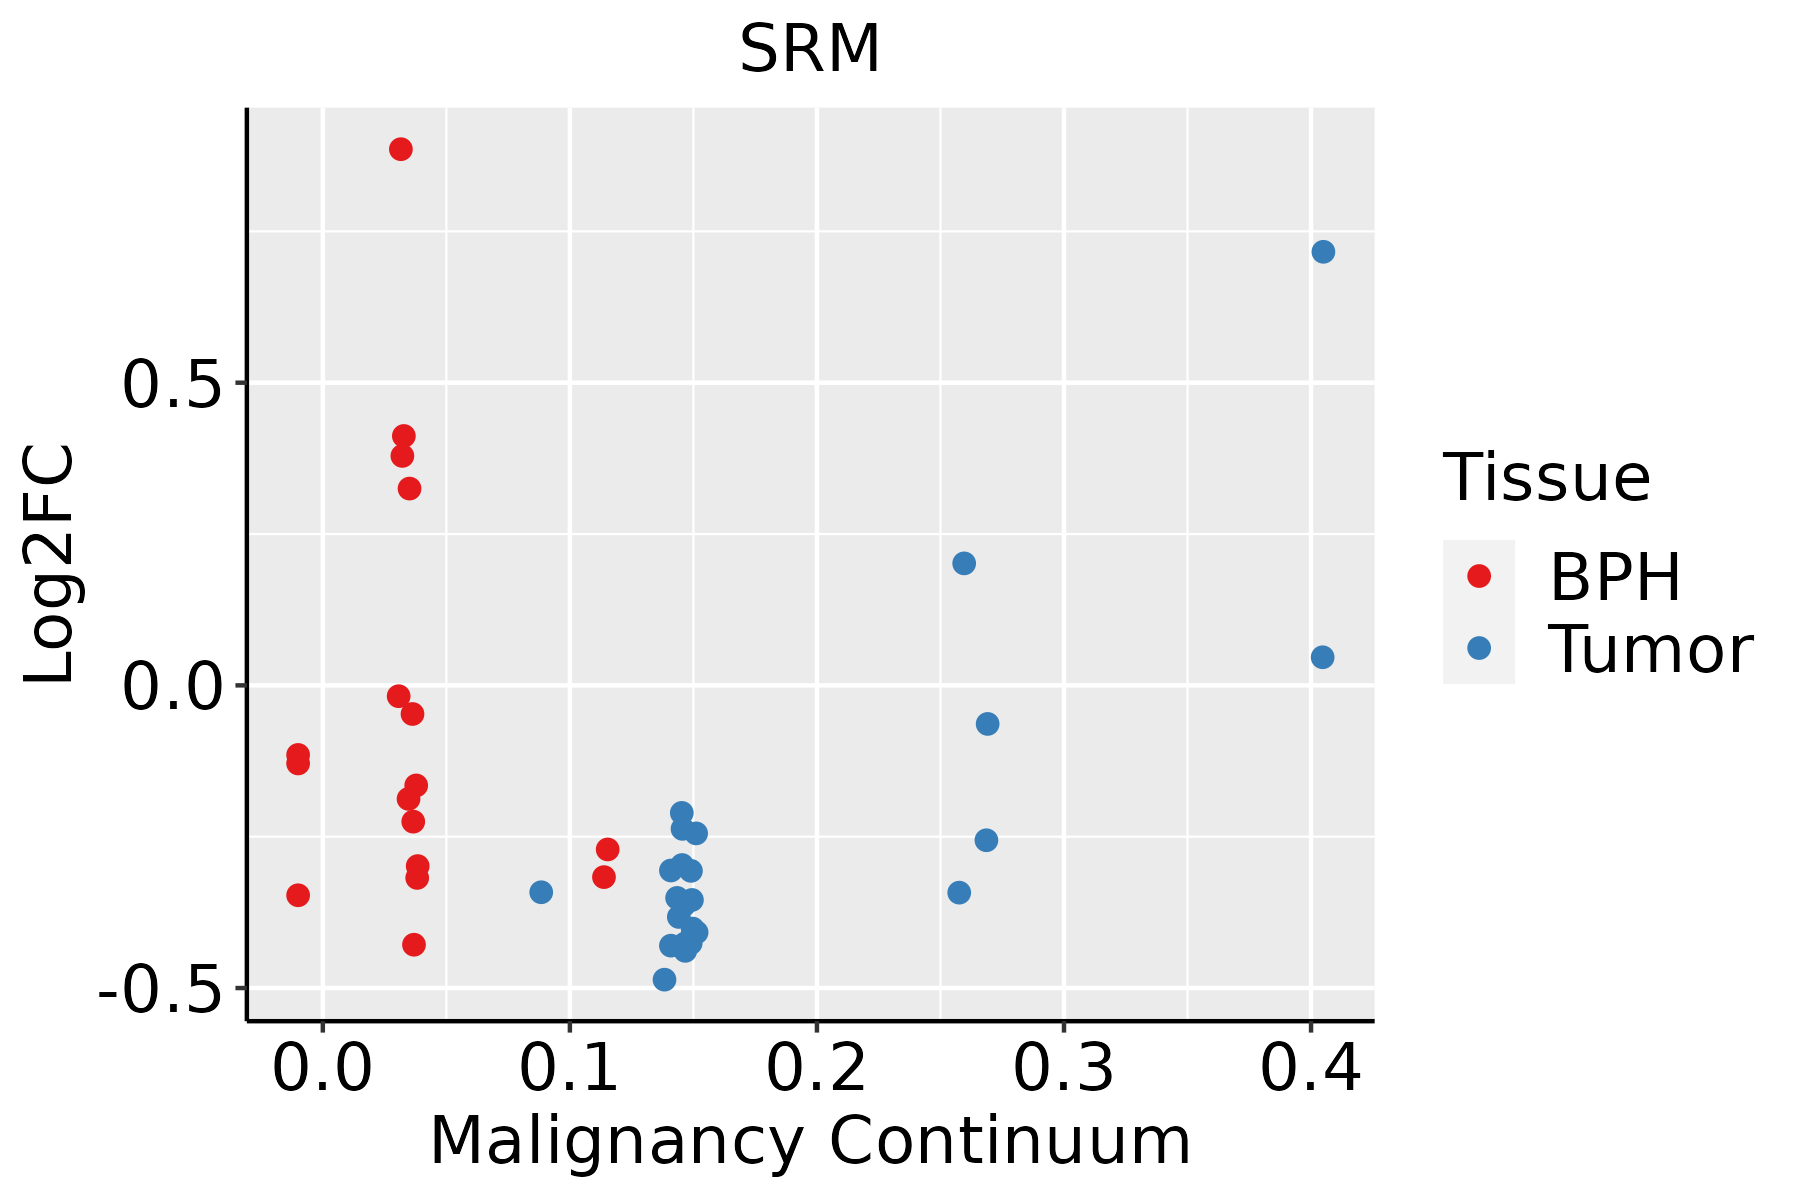 | BPH: Benign Prostatic Hyperplasia |
| Skin | 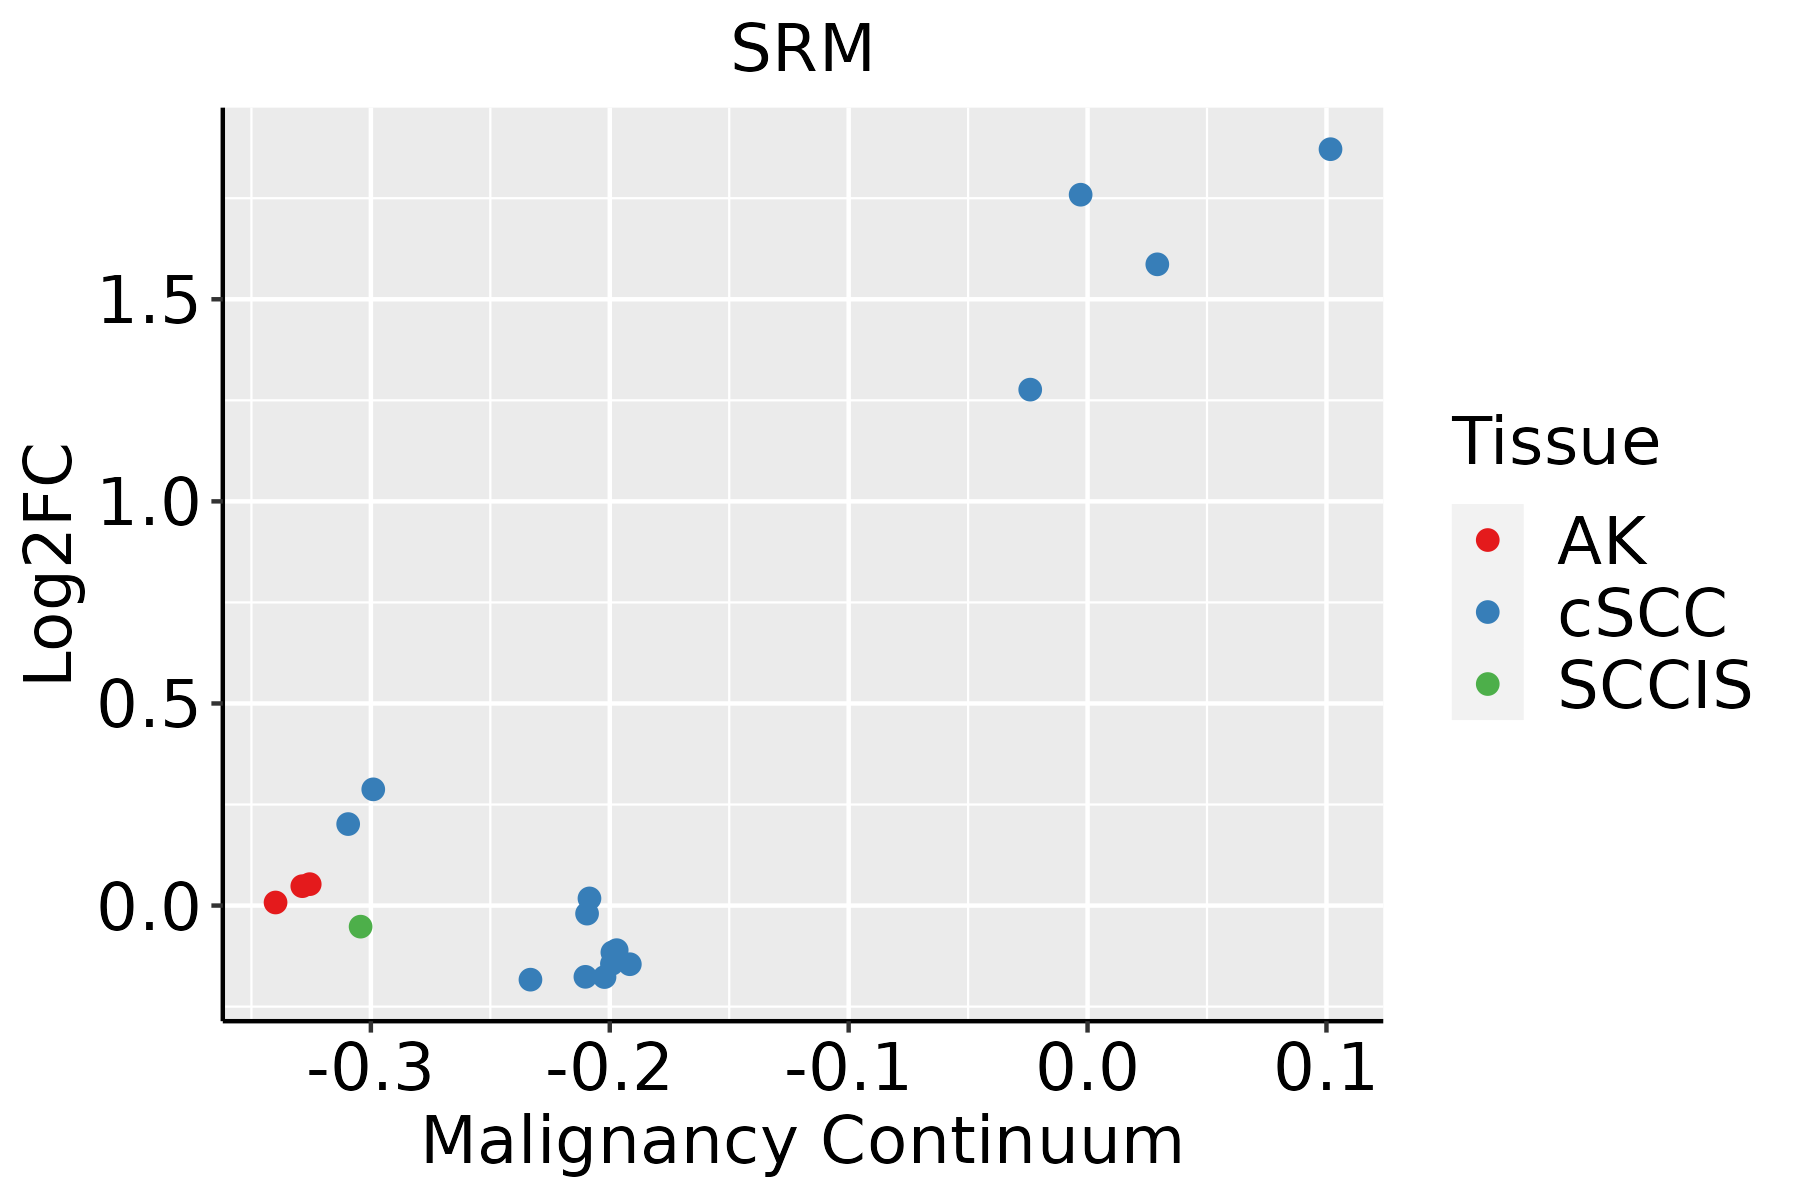 | AK: Actinic keratosis |
| cSCC: Cutaneous squamous cell carcinoma | ||
| SCCIS:squamous cell carcinoma in situ | ||
| Thyroid |  | ATC: Anaplastic thyroid cancer |
| HT: Hashimoto's thyroiditis | ||
| PTC: Papillary thyroid cancer |
| ∗log2FC in expression of this searched gene in stem-like cells from each diseased tissue sample relative to stem-like cells in normal samples in each tissue plotted against the malignancy continuum. Samples are colored based on if they are from different disease stage. |
Top |
Malignant transformation related pathway analysis |
| Find out the enriched GO biological processes and KEGG pathways involved in transition from healthy to precancer to cancer |
| Tissue | Disease Stage | Enriched GO biological Processes |
| Colorectum | AD |  |
| Colorectum | SER |  |
| Colorectum | MSS |  |
| Colorectum | MSI-H |  |
| Colorectum | FAP |  |
| ∗Top 15 enriched GO BP terms are showed in the bar plot of each disease state in each tissue. Each row represents a significant GO biological process which is colored according to the -log10(p.adjust). |
| Page: 1 2 3 4 5 6 7 8 9 |
| GO ID | Tissue | Disease Stage | Description | Gene Ratio | Bg Ratio | pvalue | p.adjust | Count |
| GO:19908303 | Breast | Precancer | cellular response to leukemia inhibitory factor | 13/1080 | 94/18723 | 2.83e-03 | 2.49e-02 | 13 |
| GO:19908233 | Breast | Precancer | response to leukemia inhibitory factor | 13/1080 | 95/18723 | 3.11e-03 | 2.64e-02 | 13 |
| GO:0042401 | Breast | Precancer | cellular biogenic amine biosynthetic process | 7/1080 | 37/18723 | 4.68e-03 | 3.60e-02 | 7 |
| GO:0009309 | Breast | Precancer | amine biosynthetic process | 7/1080 | 38/18723 | 5.46e-03 | 4.01e-02 | 7 |
| GO:00065963 | Breast | Precancer | polyamine biosynthetic process | 4/1080 | 14/18723 | 6.92e-03 | 4.67e-02 | 4 |
| GO:19908301 | Breast | IDC | cellular response to leukemia inhibitory factor | 15/1434 | 94/18723 | 5.06e-03 | 3.79e-02 | 15 |
| GO:199082311 | Breast | IDC | response to leukemia inhibitory factor | 15/1434 | 95/18723 | 5.59e-03 | 4.07e-02 | 15 |
| GO:00424011 | Breast | IDC | cellular biogenic amine biosynthetic process | 8/1434 | 37/18723 | 6.04e-03 | 4.33e-02 | 8 |
| GO:00093091 | Breast | IDC | amine biosynthetic process | 8/1434 | 38/18723 | 7.15e-03 | 4.92e-02 | 8 |
| GO:19908302 | Breast | DCIS | cellular response to leukemia inhibitory factor | 15/1390 | 94/18723 | 3.79e-03 | 3.03e-02 | 15 |
| GO:19908232 | Breast | DCIS | response to leukemia inhibitory factor | 15/1390 | 95/18723 | 4.20e-03 | 3.31e-02 | 15 |
| GO:00424012 | Breast | DCIS | cellular biogenic amine biosynthetic process | 8/1390 | 37/18723 | 5.01e-03 | 3.72e-02 | 8 |
| GO:00093092 | Breast | DCIS | amine biosynthetic process | 8/1390 | 38/18723 | 5.94e-03 | 4.25e-02 | 8 |
| GO:0006596 | Colorectum | MSS | polyamine biosynthetic process | 7/3467 | 14/18723 | 7.51e-03 | 4.72e-02 | 7 |
| GO:19908235 | Endometrium | AEH | response to leukemia inhibitory factor | 23/2100 | 95/18723 | 2.65e-04 | 3.09e-03 | 23 |
| GO:19908305 | Endometrium | AEH | cellular response to leukemia inhibitory factor | 22/2100 | 94/18723 | 5.89e-04 | 5.82e-03 | 22 |
| GO:199082313 | Endometrium | EEC | response to leukemia inhibitory factor | 25/2168 | 95/18723 | 5.72e-05 | 8.96e-04 | 25 |
| GO:199083012 | Endometrium | EEC | cellular response to leukemia inhibitory factor | 24/2168 | 94/18723 | 1.33e-04 | 1.74e-03 | 24 |
| GO:00065952 | Endometrium | EEC | polyamine metabolic process | 7/2168 | 18/18723 | 2.76e-03 | 1.97e-02 | 7 |
| GO:199082316 | Esophagus | ESCC | response to leukemia inhibitory factor | 60/8552 | 95/18723 | 4.41e-04 | 2.48e-03 | 60 |
| Page: 1 2 3 |
| Pathway ID | Tissue | Disease Stage | Description | Gene Ratio | Bg Ratio | pvalue | p.adjust | qvalue | Count |
| hsa0048010 | Breast | Precancer | Glutathione metabolism | 12/684 | 57/8465 | 1.68e-03 | 1.08e-02 | 8.30e-03 | 12 |
| hsa0048013 | Breast | Precancer | Glutathione metabolism | 12/684 | 57/8465 | 1.68e-03 | 1.08e-02 | 8.30e-03 | 12 |
| hsa0048023 | Breast | IDC | Glutathione metabolism | 13/867 | 57/8465 | 4.25e-03 | 2.56e-02 | 1.91e-02 | 13 |
| hsa0048033 | Breast | IDC | Glutathione metabolism | 13/867 | 57/8465 | 4.25e-03 | 2.56e-02 | 1.91e-02 | 13 |
| hsa0048041 | Breast | DCIS | Glutathione metabolism | 13/846 | 57/8465 | 3.44e-03 | 1.98e-02 | 1.46e-02 | 13 |
| hsa0048051 | Breast | DCIS | Glutathione metabolism | 13/846 | 57/8465 | 3.44e-03 | 1.98e-02 | 1.46e-02 | 13 |
| hsa00330 | Colorectum | AD | Arginine and proline metabolism | 23/2092 | 50/8465 | 8.27e-04 | 5.90e-03 | 3.76e-03 | 23 |
| hsa00480 | Colorectum | AD | Glutathione metabolism | 23/2092 | 57/8465 | 6.52e-03 | 2.76e-02 | 1.76e-02 | 23 |
| hsa003301 | Colorectum | AD | Arginine and proline metabolism | 23/2092 | 50/8465 | 8.27e-04 | 5.90e-03 | 3.76e-03 | 23 |
| hsa004801 | Colorectum | AD | Glutathione metabolism | 23/2092 | 57/8465 | 6.52e-03 | 2.76e-02 | 1.76e-02 | 23 |
| hsa003302 | Colorectum | SER | Arginine and proline metabolism | 17/1580 | 50/8465 | 7.12e-03 | 3.77e-02 | 2.74e-02 | 17 |
| hsa003303 | Colorectum | SER | Arginine and proline metabolism | 17/1580 | 50/8465 | 7.12e-03 | 3.77e-02 | 2.74e-02 | 17 |
| hsa003304 | Colorectum | MSS | Arginine and proline metabolism | 23/1875 | 50/8465 | 1.52e-04 | 1.24e-03 | 7.61e-04 | 23 |
| hsa004802 | Colorectum | MSS | Glutathione metabolism | 22/1875 | 57/8465 | 3.58e-03 | 1.64e-02 | 1.01e-02 | 22 |
| hsa003305 | Colorectum | MSS | Arginine and proline metabolism | 23/1875 | 50/8465 | 1.52e-04 | 1.24e-03 | 7.61e-04 | 23 |
| hsa004803 | Colorectum | MSS | Glutathione metabolism | 22/1875 | 57/8465 | 3.58e-03 | 1.64e-02 | 1.01e-02 | 22 |
| hsa002704 | Endometrium | EEC | Cysteine and methionine metabolism | 15/1237 | 52/8465 | 6.02e-03 | 3.12e-02 | 2.33e-02 | 15 |
| hsa0027011 | Endometrium | EEC | Cysteine and methionine metabolism | 15/1237 | 52/8465 | 6.02e-03 | 3.12e-02 | 2.33e-02 | 15 |
| hsa0048018 | Esophagus | ESCC | Glutathione metabolism | 44/4205 | 57/8465 | 1.81e-05 | 9.03e-05 | 4.63e-05 | 44 |
| hsa0048019 | Esophagus | ESCC | Glutathione metabolism | 44/4205 | 57/8465 | 1.81e-05 | 9.03e-05 | 4.63e-05 | 44 |
| Page: 1 2 3 |
Top |
Cell-cell communication analysis |
| Identification of potential cell-cell interactions between two cell types and their ligand-receptor pairs for different disease states |
| Ligand | Receptor | LRpair | Pathway | Tissue | Disease Stage |
| Page: 1 |
Top |
Single-cell gene regulatory network inference analysis |
| Find out the significant the regulons (TFs) and the target genes of each regulon across cell types for different disease states |
| TF | Cell Type | Tissue | Disease Stage | Target Gene | RSS | Regulon Activity |
| ∗The dot plots of a searched regulon are shown for all cell subpopulations in each disease state of each tissue based on the regulon specific score inferred using pySCENIC and by calculating the average expression. |
| Page: 1 |
Top |
Somatic mutation of malignant transformation related genes |
| Annotation of somatic variants for genes involved in malignant transformation |
| Hugo Symbol | Variant Class | Variant Classification | dbSNP RS | HGVSc | HGVSp | HGVSp Short | SWISSPROT | BIOTYPE | SIFT | PolyPhen | Tumor Sample Barcode | Tissue | Histology | Sex | Age | Stage | Therapy Types | Drugs | Outcome |
| SRM | SNV | Missense_Mutation | c.240G>C | p.Gln80His | p.Q80H | P19623 | protein_coding | deleterious(0.05) | probably_damaging(0.997) | TCGA-GI-A2C8-01 | Breast | breast invasive carcinoma | Female | <65 | III/IV | Unspecific | Adriamycin | SD | |
| SRM | SNV | Missense_Mutation | c.422C>T | p.Ala141Val | p.A141V | P19623 | protein_coding | deleterious(0) | probably_damaging(0.939) | TCGA-HN-A2OB-01 | Breast | breast invasive carcinoma | Female | <65 | I/II | Chemotherapy | fluorouracil | PD | |
| SRM | SNV | Missense_Mutation | c.434C>T | p.Ser145Phe | p.S145F | P19623 | protein_coding | deleterious(0.04) | benign(0.026) | TCGA-DG-A2KK-01 | Cervix | cervical & endocervical cancer | Female | <65 | III/IV | Chemotherapy | cisplatin | SD | |
| SRM | SNV | Missense_Mutation | rs746483806 | c.853N>T | p.Arg285Cys | p.R285C | P19623 | protein_coding | deleterious(0.02) | possibly_damaging(0.839) | TCGA-CK-6746-01 | Colorectum | colon adenocarcinoma | Female | >=65 | I/II | Unknown | Unknown | SD |
| SRM | SNV | Missense_Mutation | rs775399258 | c.661C>T | p.Arg221Trp | p.R221W | P19623 | protein_coding | tolerated(0.18) | benign(0.027) | TCGA-A5-A1OF-01 | Endometrium | uterine corpus endometrioid carcinoma | Female | <65 | I/II | Unknown | Unknown | SD |
| SRM | SNV | Missense_Mutation | c.385N>A | p.Val129Ile | p.V129I | P19623 | protein_coding | deleterious(0.01) | benign(0.279) | TCGA-AP-A059-01 | Endometrium | uterine corpus endometrioid carcinoma | Female | >=65 | I/II | Unknown | Unknown | SD | |
| SRM | SNV | Missense_Mutation | novel | c.596A>G | p.Glu199Gly | p.E199G | P19623 | protein_coding | deleterious(0.02) | benign(0.316) | TCGA-B5-A1MX-01 | Endometrium | uterine corpus endometrioid carcinoma | Female | <65 | I/II | Hormone Therapy | megace | SD |
| SRM | SNV | Missense_Mutation | rs745709982 | c.440N>T | p.Ser147Leu | p.S147L | P19623 | protein_coding | deleterious(0) | benign(0.085) | TCGA-BS-A0UV-01 | Endometrium | uterine corpus endometrioid carcinoma | Female | <65 | III/IV | Unknown | Unknown | SD |
| SRM | SNV | Missense_Mutation | novel | c.231N>A | p.Phe77Leu | p.F77L | P19623 | protein_coding | deleterious(0.02) | probably_damaging(0.932) | TCGA-E6-A1LX-01 | Endometrium | uterine corpus endometrioid carcinoma | Female | <65 | I/II | Unknown | Unknown | SD |
| SRM | SNV | Missense_Mutation | novel | c.176N>G | p.Tyr59Cys | p.Y59C | P19623 | protein_coding | deleterious(0.01) | possibly_damaging(0.618) | TCGA-PG-A917-01 | Endometrium | uterine corpus endometrioid carcinoma | Female | >=65 | I/II | Unknown | Unknown | SD |
| Page: 1 2 |
Top |
Related drugs of malignant transformation related genes |
| Identification of chemicals and drugs interact with genes involved in malignant transfromation |
| (DGIdb 4.0) |
| Entrez ID | Symbol | Category | Interaction Types | Drug Claim Name | Drug Name | PMIDs |
| Page: 1 |

Copyright 2023-Present -The University of Texas Health Science Center at Houston |