
|
|||||
|
 | |
| |
| |
| |
| |
| |
|
Gene: SRGN |
Gene summary for SRGN |
| Gene information | Species | Human | Gene symbol | SRGN | Gene ID | 5552 |
| Gene name | serglycin | |
| Gene Alias | PPG | |
| Cytomap | 10q22.1 | |
| Gene Type | protein-coding | GO ID | GO:0001503 | UniProtAcc | P10124 |
Top |
Malignant transformation analysis |
| Identification of the aberrant gene expression in precancerous and cancerous lesions by comparing the gene expression of stem-like cells in diseased tissues with normal stem cells |
| Entrez ID | Symbol | Replicates | Species | Organ | Tissue | Adj P-value | Log2FC | Malignancy |
| 5552 | SRGN | GSM4909305 | Human | Breast | IDC | 2.14e-05 | 2.37e-01 | 0.0436 |
| 5552 | SRGN | GSM4909308 | Human | Breast | IDC | 8.26e-08 | 1.10e-01 | 0.158 |
| 5552 | SRGN | GSM4909313 | Human | Breast | IDC | 3.32e-02 | -1.50e-01 | 0.0391 |
| 5552 | SRGN | GSM4909317 | Human | Breast | IDC | 2.61e-06 | 1.73e-01 | 0.1355 |
| 5552 | SRGN | brca3 | Human | Breast | Precancer | 1.48e-02 | -1.46e-01 | -0.0263 |
| 5552 | SRGN | M1 | Human | Breast | IDC | 8.32e-23 | 5.79e-01 | 0.1577 |
| 5552 | SRGN | NCCBC3 | Human | Breast | DCIS | 4.08e-17 | 6.64e-01 | 0.1198 |
| 5552 | SRGN | NCCBC5 | Human | Breast | DCIS | 3.85e-04 | 6.00e-01 | 0.2046 |
| 5552 | SRGN | CA_HPV_3 | Human | Cervix | CC | 2.41e-03 | -4.67e-01 | 0.0414 |
| 5552 | SRGN | HSIL_HPV_2 | Human | Cervix | HSIL_HPV | 8.02e-05 | -2.48e-01 | 0.0208 |
| 5552 | SRGN | N_HPV_2 | Human | Cervix | N_HPV | 2.64e-02 | 1.44e-01 | -0.0131 |
| 5552 | SRGN | CCI_1 | Human | Cervix | CC | 7.15e-16 | -1.32e+00 | 0.528 |
| 5552 | SRGN | CCI_2 | Human | Cervix | CC | 3.26e-10 | -1.19e+00 | 0.5249 |
| 5552 | SRGN | CCI_3 | Human | Cervix | CC | 2.15e-13 | -1.11e+00 | 0.516 |
| 5552 | SRGN | CCII_1 | Human | Cervix | CC | 2.25e-23 | -1.26e+00 | 0.3249 |
| 5552 | SRGN | Tumor | Human | Cervix | CC | 2.67e-59 | -1.31e+00 | 0.1241 |
| 5552 | SRGN | sample1 | Human | Cervix | CC | 2.34e-21 | -1.31e+00 | 0.0959 |
| 5552 | SRGN | sample3 | Human | Cervix | CC | 1.86e-52 | -1.30e+00 | 0.1387 |
| 5552 | SRGN | H2 | Human | Cervix | HSIL_HPV | 4.60e-40 | -1.17e+00 | 0.0632 |
| 5552 | SRGN | L1 | Human | Cervix | CC | 8.77e-07 | -7.81e-01 | 0.0802 |
| Page: 1 2 3 4 5 6 7 |
| Tissue | Expression Dynamics | Abbreviation |
| Breast |  | IDC: Invasive ductal carcinoma |
| DCIS: Ductal carcinoma in situ | ||
| Precancer(BRCA1-mut): Precancerous lesion from BRCA1 mutation carriers | ||
| Cervix |  | CC: Cervix cancer |
| HSIL_HPV: HPV-infected high-grade squamous intraepithelial lesions | ||
| N_HPV: HPV-infected normal cervix | ||
| Endometrium | 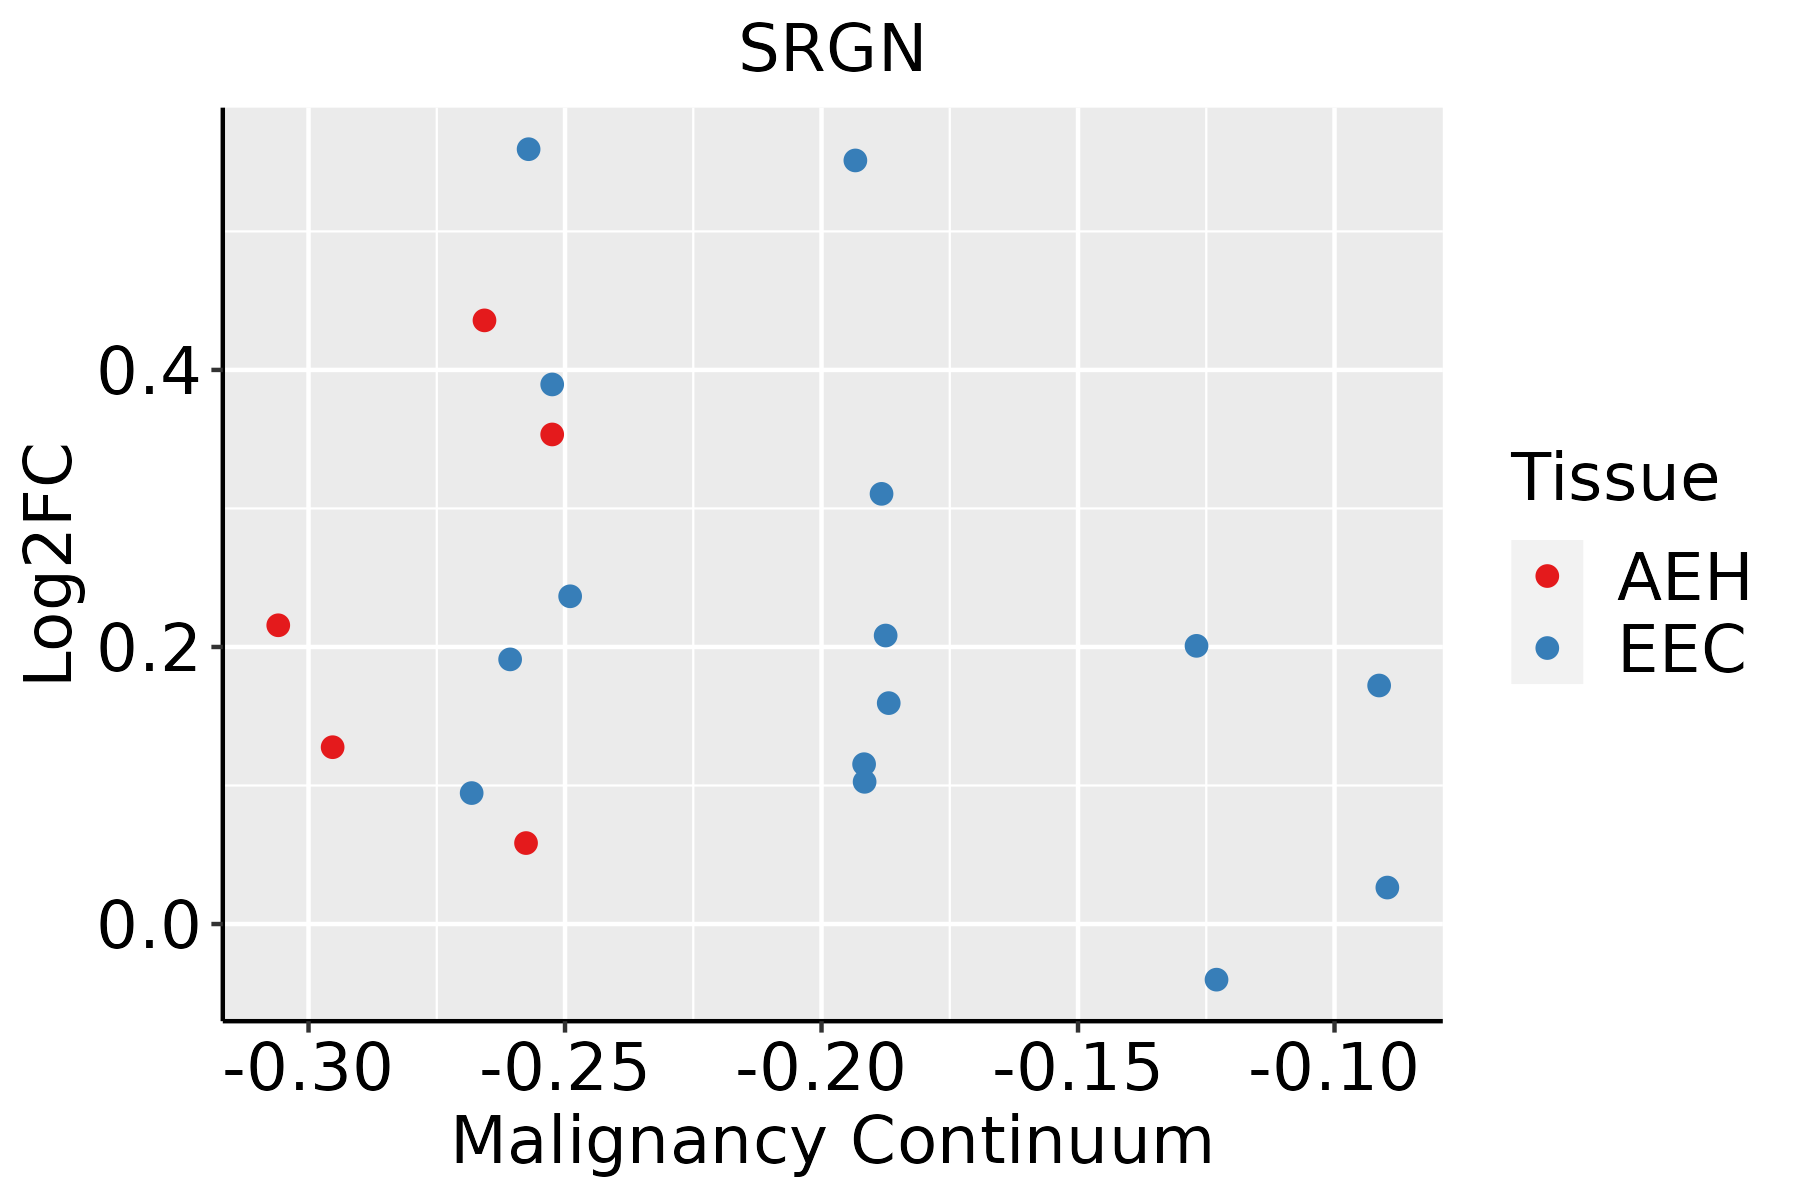 | AEH: Atypical endometrial hyperplasia |
| EEC: Endometrioid Cancer | ||
| Esophagus |  | ESCC: Esophageal squamous cell carcinoma |
| HGIN: High-grade intraepithelial neoplasias | ||
| LGIN: Low-grade intraepithelial neoplasias | ||
| Liver | 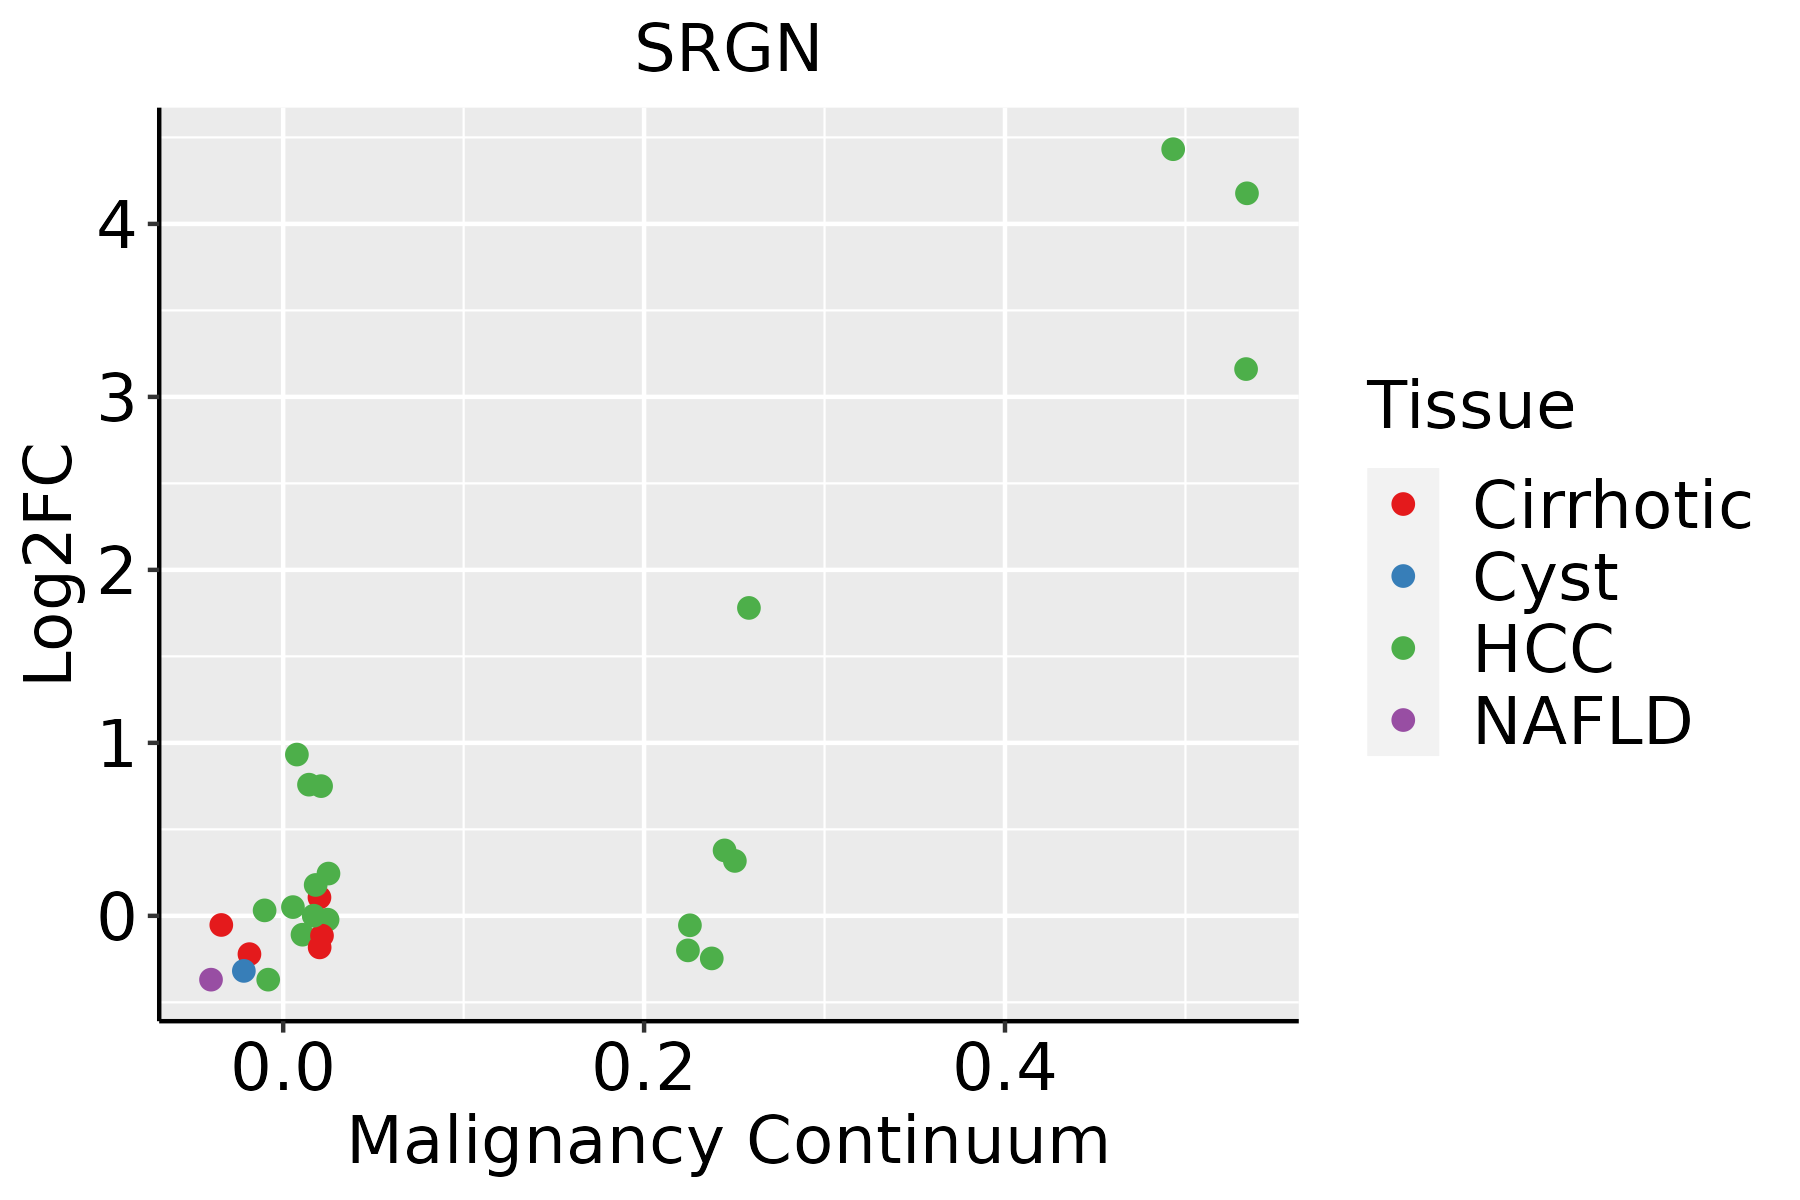 | HCC: Hepatocellular carcinoma |
| NAFLD: Non-alcoholic fatty liver disease | ||
| Oral Cavity | 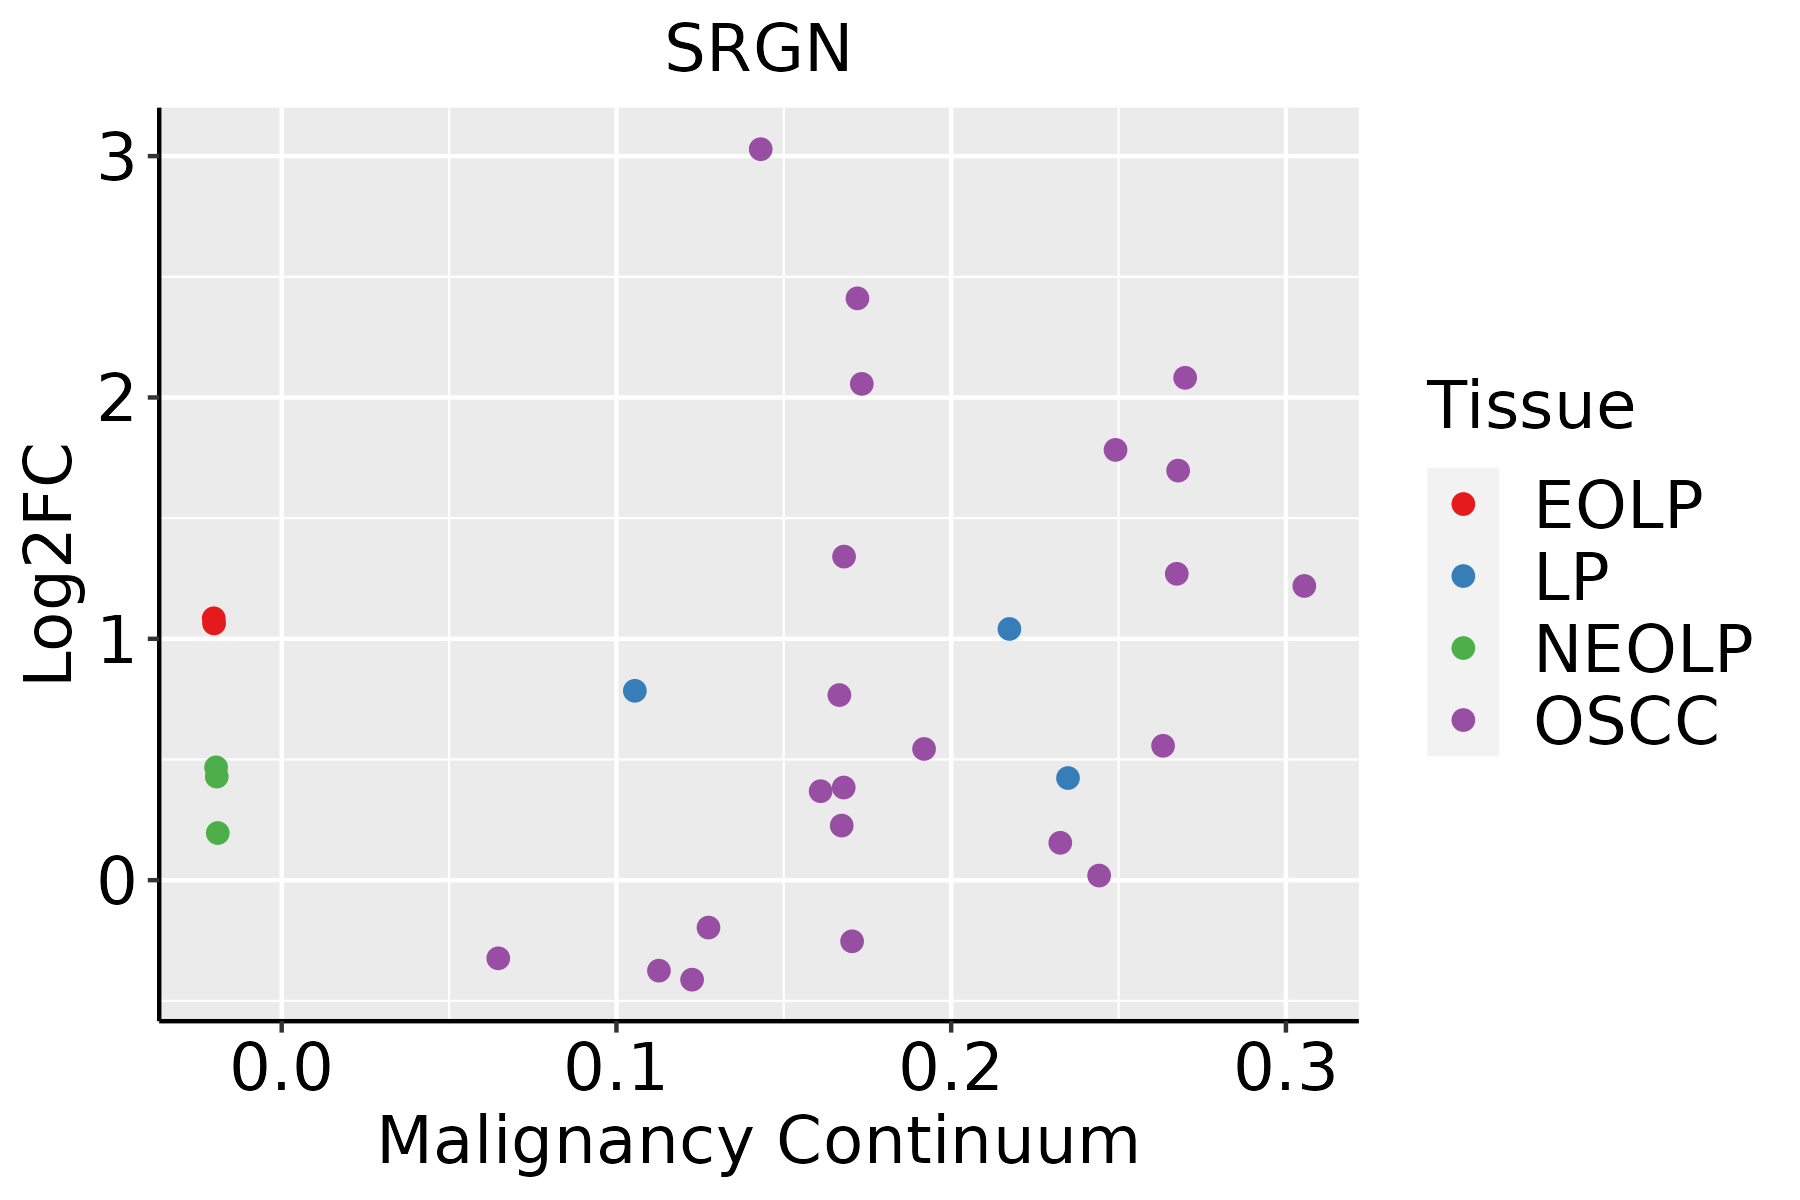 | EOLP: Erosive Oral lichen planus |
| LP: leukoplakia | ||
| NEOLP: Non-erosive oral lichen planus | ||
| OSCC: Oral squamous cell carcinoma | ||
| Prostate | 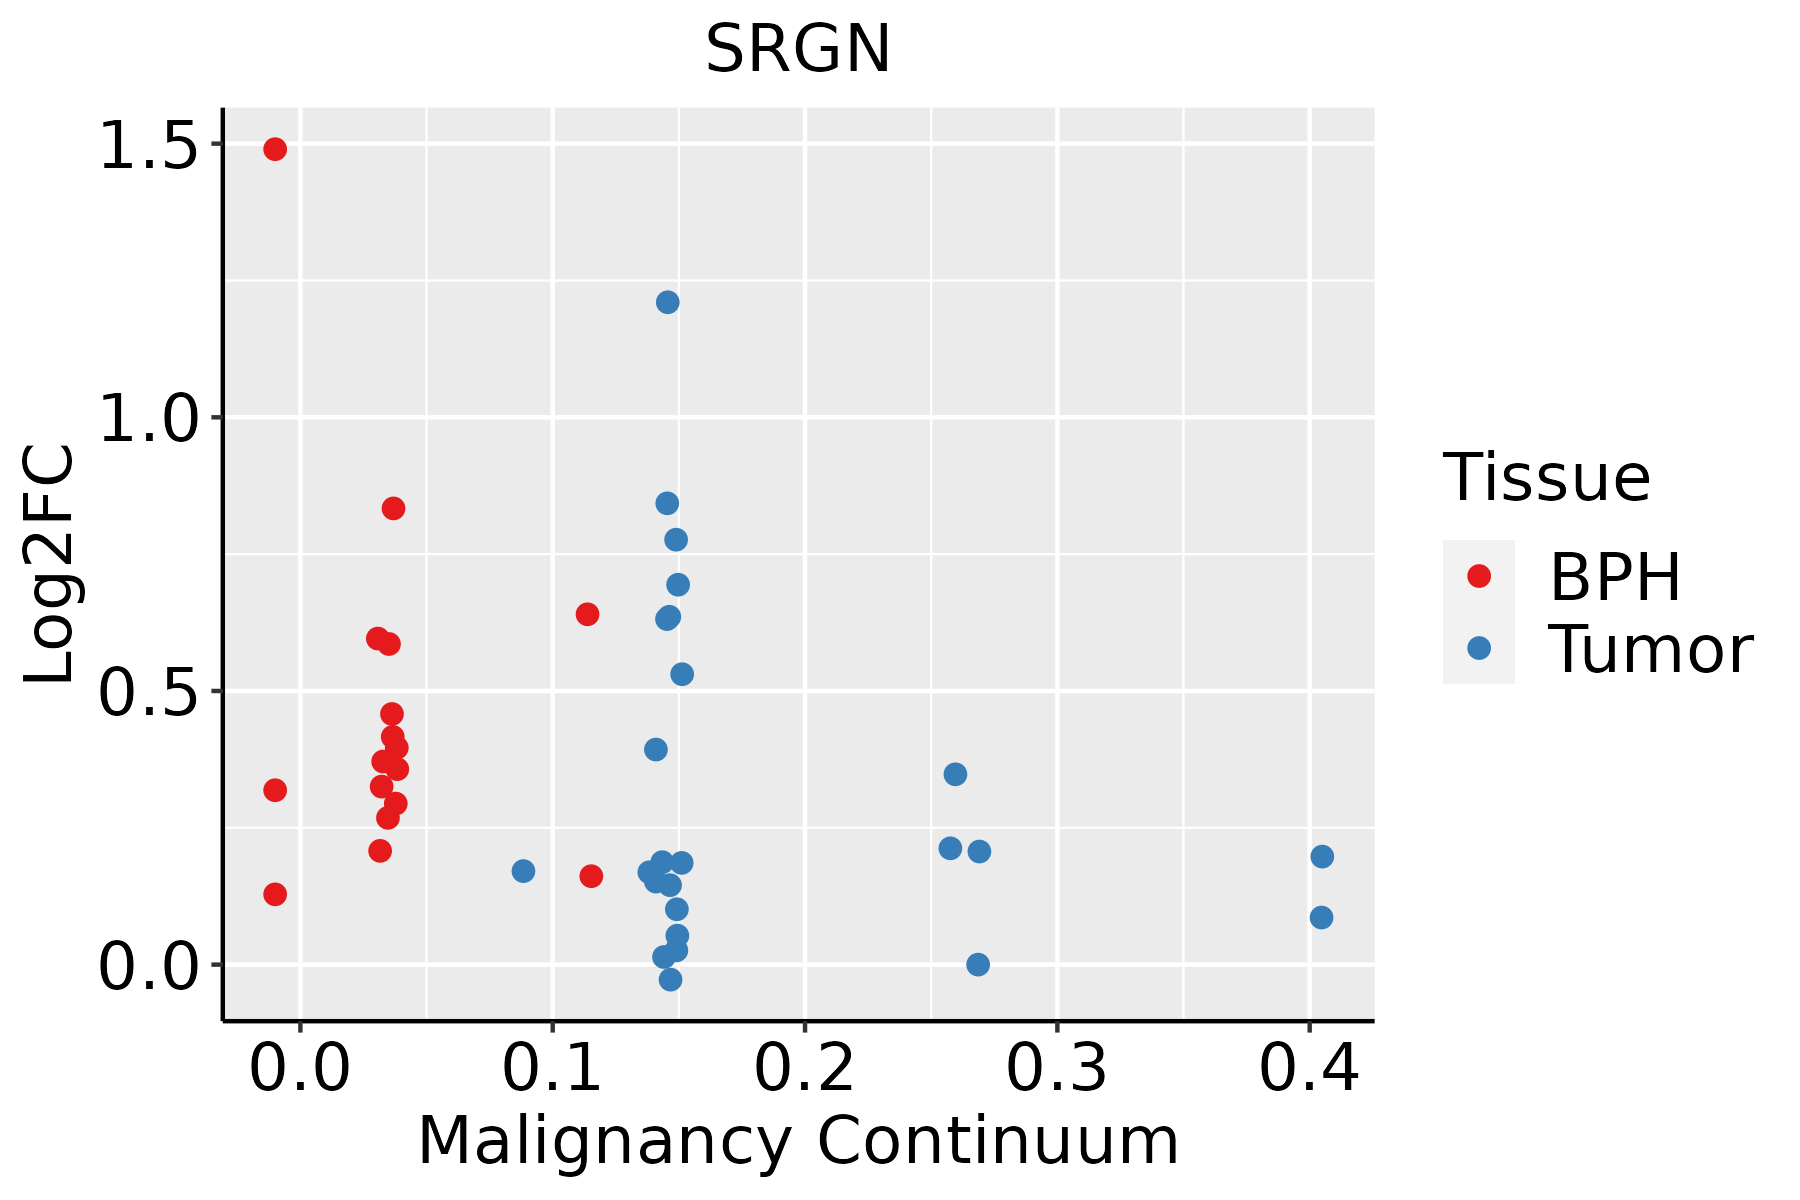 | BPH: Benign Prostatic Hyperplasia |
| Skin | 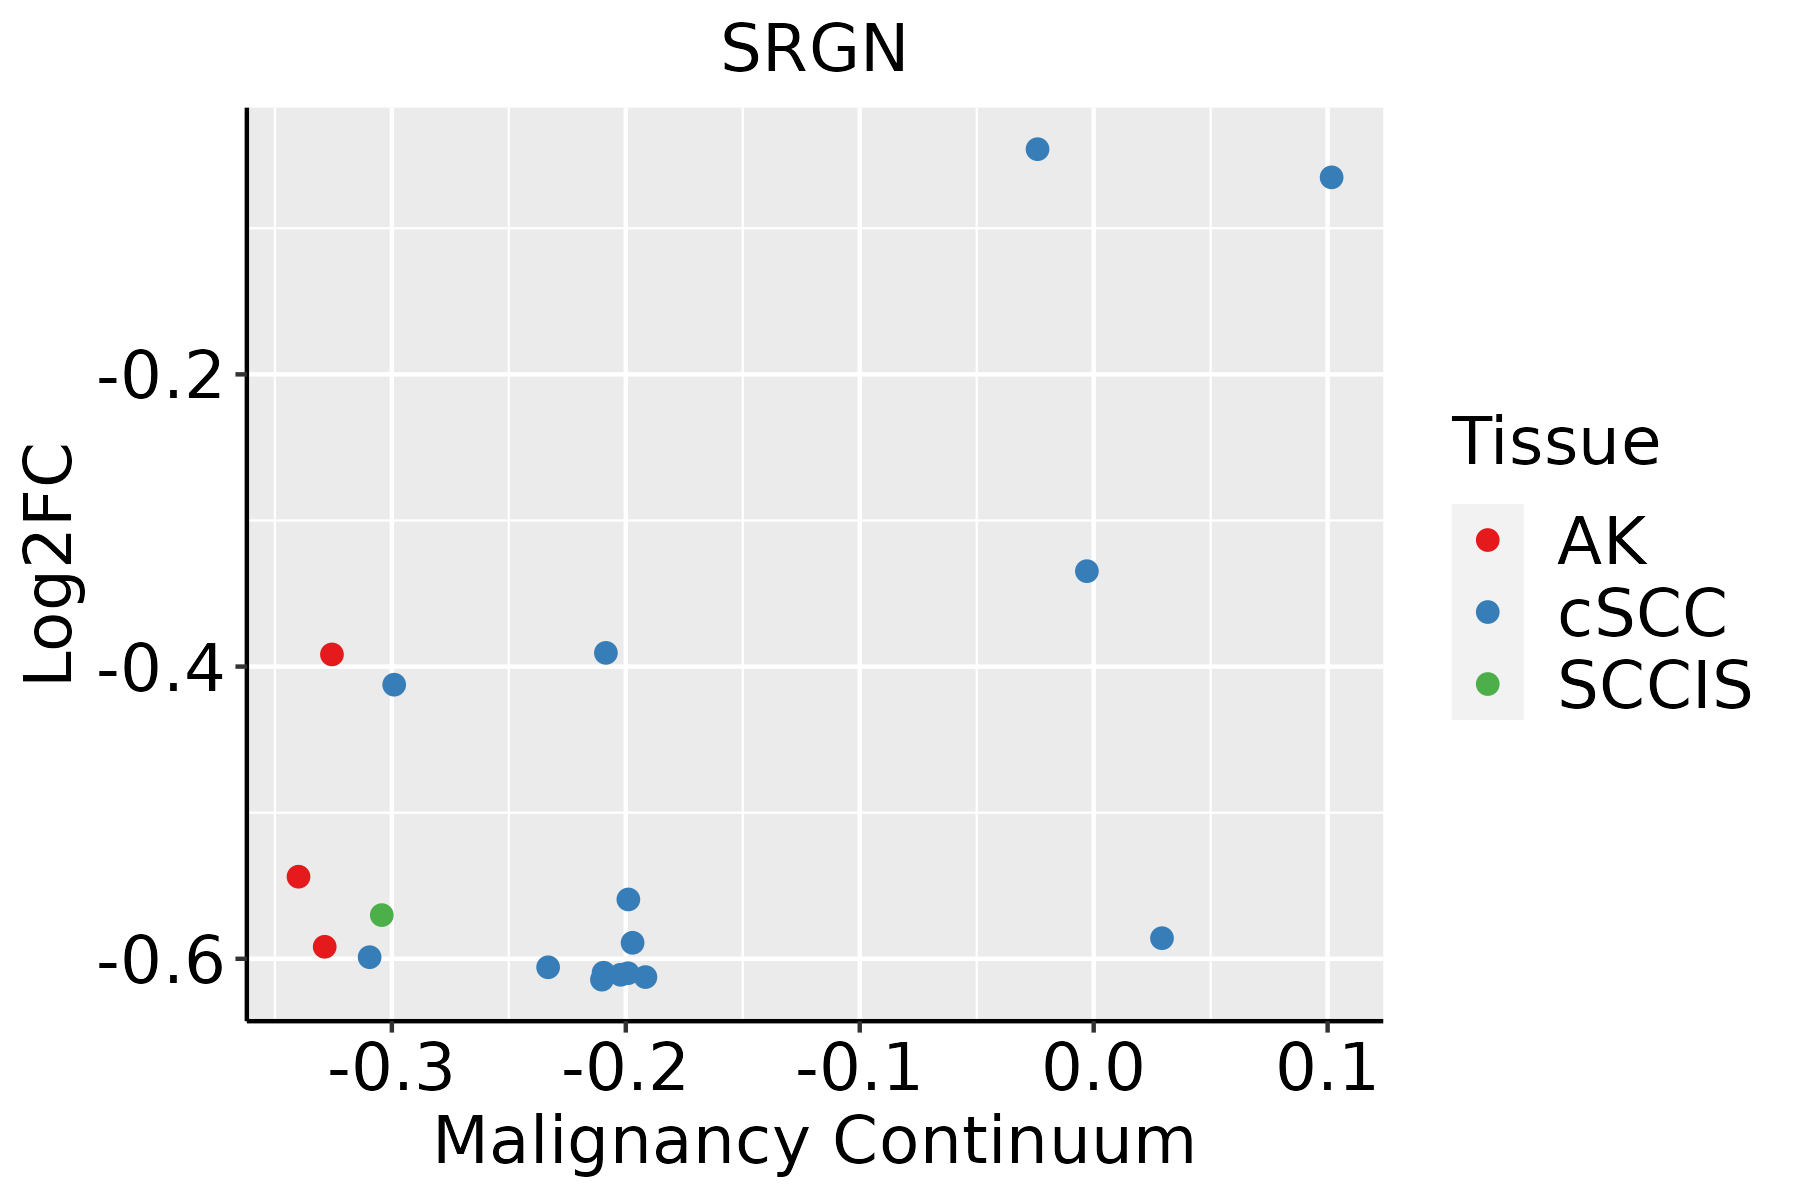 | AK: Actinic keratosis |
| cSCC: Cutaneous squamous cell carcinoma | ||
| SCCIS:squamous cell carcinoma in situ | ||
| Thyroid |  | ATC: Anaplastic thyroid cancer |
| HT: Hashimoto's thyroiditis | ||
| PTC: Papillary thyroid cancer |
| ∗log2FC in expression of this searched gene in stem-like cells from each diseased tissue sample relative to stem-like cells in normal samples in each tissue plotted against the malignancy continuum. Samples are colored based on if they are from different disease stage. |
Top |
Malignant transformation related pathway analysis |
| Find out the enriched GO biological processes and KEGG pathways involved in transition from healthy to precancer to cancer |
| Tissue | Disease Stage | Enriched GO biological Processes |
| Colorectum | AD |  |
| Colorectum | SER |  |
| Colorectum | MSS |  |
| Colorectum | MSI-H |  |
| Colorectum | FAP |  |
| ∗Top 15 enriched GO BP terms are showed in the bar plot of each disease state in each tissue. Each row represents a significant GO biological process which is colored according to the -log10(p.adjust). |
| Page: 1 2 3 4 5 6 7 8 9 |
| GO ID | Tissue | Disease Stage | Description | Gene Ratio | Bg Ratio | pvalue | p.adjust | Count |
| GO:00451859 | Breast | Precancer | maintenance of protein location | 19/1080 | 94/18723 | 1.43e-06 | 5.35e-05 | 19 |
| GO:00512358 | Breast | Precancer | maintenance of location | 40/1080 | 327/18723 | 5.85e-06 | 1.71e-04 | 40 |
| GO:00516519 | Breast | Precancer | maintenance of location in cell | 30/1080 | 214/18723 | 5.91e-06 | 1.71e-04 | 30 |
| GO:00325076 | Breast | Precancer | maintenance of protein location in cell | 14/1080 | 65/18723 | 1.59e-05 | 3.89e-04 | 14 |
| GO:00516047 | Breast | Precancer | protein maturation | 28/1080 | 294/18723 | 6.45e-03 | 4.50e-02 | 28 |
| GO:00015036 | Breast | Precancer | ossification | 36/1080 | 408/18723 | 7.53e-03 | 4.98e-02 | 36 |
| GO:005165114 | Breast | IDC | maintenance of location in cell | 37/1434 | 214/18723 | 2.39e-06 | 9.35e-05 | 37 |
| GO:004518514 | Breast | IDC | maintenance of protein location | 21/1434 | 94/18723 | 6.69e-06 | 2.05e-04 | 21 |
| GO:005123513 | Breast | IDC | maintenance of location | 48/1434 | 327/18723 | 9.90e-06 | 2.77e-04 | 48 |
| GO:003250714 | Breast | IDC | maintenance of protein location in cell | 16/1434 | 65/18723 | 2.29e-05 | 5.51e-04 | 16 |
| GO:000150311 | Breast | IDC | ossification | 50/1434 | 408/18723 | 6.51e-04 | 8.04e-03 | 50 |
| GO:005160413 | Breast | IDC | protein maturation | 35/1434 | 294/18723 | 6.18e-03 | 4.40e-02 | 35 |
| GO:005165123 | Breast | DCIS | maintenance of location in cell | 36/1390 | 214/18723 | 3.07e-06 | 1.02e-04 | 36 |
| GO:004518521 | Breast | DCIS | maintenance of protein location | 21/1390 | 94/18723 | 4.12e-06 | 1.24e-04 | 21 |
| GO:005123523 | Breast | DCIS | maintenance of location | 47/1390 | 327/18723 | 9.55e-06 | 2.56e-04 | 47 |
| GO:003250722 | Breast | DCIS | maintenance of protein location in cell | 16/1390 | 65/18723 | 1.56e-05 | 3.79e-04 | 16 |
| GO:000150321 | Breast | DCIS | ossification | 45/1390 | 408/18723 | 4.98e-03 | 3.72e-02 | 45 |
| GO:005160422 | Breast | DCIS | protein maturation | 34/1390 | 294/18723 | 6.72e-03 | 4.66e-02 | 34 |
| GO:00512359 | Cervix | CC | maintenance of location | 78/2311 | 327/18723 | 5.18e-09 | 4.92e-07 | 78 |
| GO:005165110 | Cervix | CC | maintenance of location in cell | 55/2311 | 214/18723 | 6.63e-08 | 3.85e-06 | 55 |
| Page: 1 2 3 4 5 6 7 8 9 10 11 |
| Pathway ID | Tissue | Disease Stage | Description | Gene Ratio | Bg Ratio | pvalue | p.adjust | qvalue | Count |
| Page: 1 |
Top |
Cell-cell communication analysis |
| Identification of potential cell-cell interactions between two cell types and their ligand-receptor pairs for different disease states |
| Ligand | Receptor | LRpair | Pathway | Tissue | Disease Stage |
| Page: 1 |
Top |
Single-cell gene regulatory network inference analysis |
| Find out the significant the regulons (TFs) and the target genes of each regulon across cell types for different disease states |
| TF | Cell Type | Tissue | Disease Stage | Target Gene | RSS | Regulon Activity |
| ∗The dot plots of a searched regulon are shown for all cell subpopulations in each disease state of each tissue based on the regulon specific score inferred using pySCENIC and by calculating the average expression. |
| Page: 1 |
Top |
Somatic mutation of malignant transformation related genes |
| Annotation of somatic variants for genes involved in malignant transformation |
| Hugo Symbol | Variant Class | Variant Classification | dbSNP RS | HGVSc | HGVSp | HGVSp Short | SWISSPROT | BIOTYPE | SIFT | PolyPhen | Tumor Sample Barcode | Tissue | Histology | Sex | Age | Stage | Therapy Types | Drugs | Outcome |
| SRGN | SNV | Missense_Mutation | novel | c.331G>T | p.Gly111Cys | p.G111C | P10124 | protein_coding | deleterious(0.01) | possibly_damaging(0.89) | TCGA-2W-A8YY-01 | Cervix | cervical & endocervical cancer | Female | <65 | I/II | Chemotherapy | cisplatin | CR |
| SRGN | SNV | Missense_Mutation | c.244G>A | p.Asp82Asn | p.D82N | P10124 | protein_coding | tolerated(1) | benign(0.001) | TCGA-IR-A3LA-01 | Cervix | cervical & endocervical cancer | Female | <65 | I/II | Chemotherapy | cisplatin | CR | |
| SRGN | SNV | Missense_Mutation | novel | c.287N>T | p.Ser96Leu | p.S96L | P10124 | protein_coding | deleterious(0) | probably_damaging(0.999) | TCGA-VS-A9UZ-01 | Cervix | cervical & endocervical cancer | Female | <65 | I/II | Unknown | Unknown | SD |
| SRGN | SNV | Missense_Mutation | c.172N>A | p.Glu58Lys | p.E58K | P10124 | protein_coding | tolerated(0.09) | benign(0.028) | TCGA-AA-A00N-01 | Colorectum | colon adenocarcinoma | Male | >=65 | I/II | Unknown | Unknown | PD | |
| SRGN | SNV | Missense_Mutation | rs186846312 | c.254G>A | p.Arg85His | p.R85H | P10124 | protein_coding | deleterious(0.02) | possibly_damaging(0.493) | TCGA-AZ-4308-01 | Colorectum | colon adenocarcinoma | Female | <65 | III/IV | Targeted Molecular therapy | avastin | CR |
| SRGN | SNV | Missense_Mutation | rs557632542 | c.115N>T | p.Arg39Cys | p.R39C | P10124 | protein_coding | tolerated(0.05) | probably_damaging(0.968) | TCGA-AZ-6601-01 | Colorectum | colon adenocarcinoma | Male | >=65 | I/II | Unknown | Unknown | PD |
| SRGN | SNV | Missense_Mutation | novel | c.227N>T | p.Pro76Leu | p.P76L | P10124 | protein_coding | tolerated(0.89) | benign(0) | TCGA-A5-A2K3-01 | Endometrium | uterine corpus endometrioid carcinoma | Female | >=65 | I/II | Chemotherapy | carboplatin | SD |
| SRGN | SNV | Missense_Mutation | c.373G>A | p.Glu125Lys | p.E125K | P10124 | protein_coding | tolerated(0.06) | benign(0.066) | TCGA-BS-A0UV-01 | Endometrium | uterine corpus endometrioid carcinoma | Female | <65 | III/IV | Unknown | Unknown | SD | |
| SRGN | SNV | Missense_Mutation | novel | c.248T>C | p.Leu83Ser | p.L83S | P10124 | protein_coding | tolerated(0.09) | benign(0.076) | TCGA-DI-A1BU-01 | Endometrium | uterine corpus endometrioid carcinoma | Female | <65 | I/II | Chemotherapy | paclitaxel | SD |
| SRGN | SNV | Missense_Mutation | c.172N>A | p.Glu58Lys | p.E58K | P10124 | protein_coding | tolerated(0.09) | benign(0.028) | TCGA-EO-A3AV-01 | Endometrium | uterine corpus endometrioid carcinoma | Female | <65 | III/IV | Chemotherapy | carboplatin | CR |
| Page: 1 2 |
Top |
Related drugs of malignant transformation related genes |
| Identification of chemicals and drugs interact with genes involved in malignant transfromation |
| (DGIdb 4.0) |
| Entrez ID | Symbol | Category | Interaction Types | Drug Claim Name | Drug Name | PMIDs |
| 5552 | SRGN | DRUGGABLE GENOME, ENZYME | HEPARIN | HEPARIN | 8613703 |
| Page: 1 |

Copyright 2023-Present -The University of Texas Health Science Center at Houston |