
|
|||||
|
 | |
| |
| |
| |
| |
| |
|
Gene: SRGAP2C |
Gene summary for SRGAP2C |
| Gene information | Species | Human | Gene symbol | SRGAP2C | Gene ID | 653464 |
| Gene name | SLIT-ROBO Rho GTPase activating protein 2C | |
| Gene Alias | SRGAP2P1 | |
| Cytomap | 1p11.2 | |
| Gene Type | protein-coding | GO ID | GO:0000226 | UniProtAcc | P0DJJ0 |
Top |
Malignant transformation analysis |
| Identification of the aberrant gene expression in precancerous and cancerous lesions by comparing the gene expression of stem-like cells in diseased tissues with normal stem cells |
| Entrez ID | Symbol | Replicates | Species | Organ | Tissue | Adj P-value | Log2FC | Malignancy |
| 653464 | SRGAP2C | male-WTA | Human | Thyroid | PTC | 3.90e-02 | 5.10e-02 | 0.1037 |
| 653464 | SRGAP2C | PTC04 | Human | Thyroid | PTC | 1.75e-04 | 8.15e-02 | 0.1927 |
| 653464 | SRGAP2C | PTC06 | Human | Thyroid | PTC | 3.64e-11 | 2.71e-01 | 0.2057 |
| 653464 | SRGAP2C | PTC07 | Human | Thyroid | PTC | 9.43e-07 | 1.58e-01 | 0.2044 |
| 653464 | SRGAP2C | ATC09 | Human | Thyroid | ATC | 2.42e-11 | 3.42e-01 | 0.2871 |
| 653464 | SRGAP2C | ATC12 | Human | Thyroid | ATC | 2.13e-09 | 2.11e-01 | 0.34 |
| 653464 | SRGAP2C | ATC13 | Human | Thyroid | ATC | 1.19e-35 | 5.56e-01 | 0.34 |
| 653464 | SRGAP2C | ATC1 | Human | Thyroid | ATC | 1.26e-09 | 3.41e-01 | 0.2878 |
| 653464 | SRGAP2C | ATC2 | Human | Thyroid | ATC | 9.94e-09 | 7.05e-01 | 0.34 |
| 653464 | SRGAP2C | ATC4 | Human | Thyroid | ATC | 8.48e-13 | 2.85e-01 | 0.34 |
| 653464 | SRGAP2C | ATC5 | Human | Thyroid | ATC | 1.26e-29 | 6.10e-01 | 0.34 |
| Page: 1 |
| Tissue | Expression Dynamics | Abbreviation |
| Thyroid | 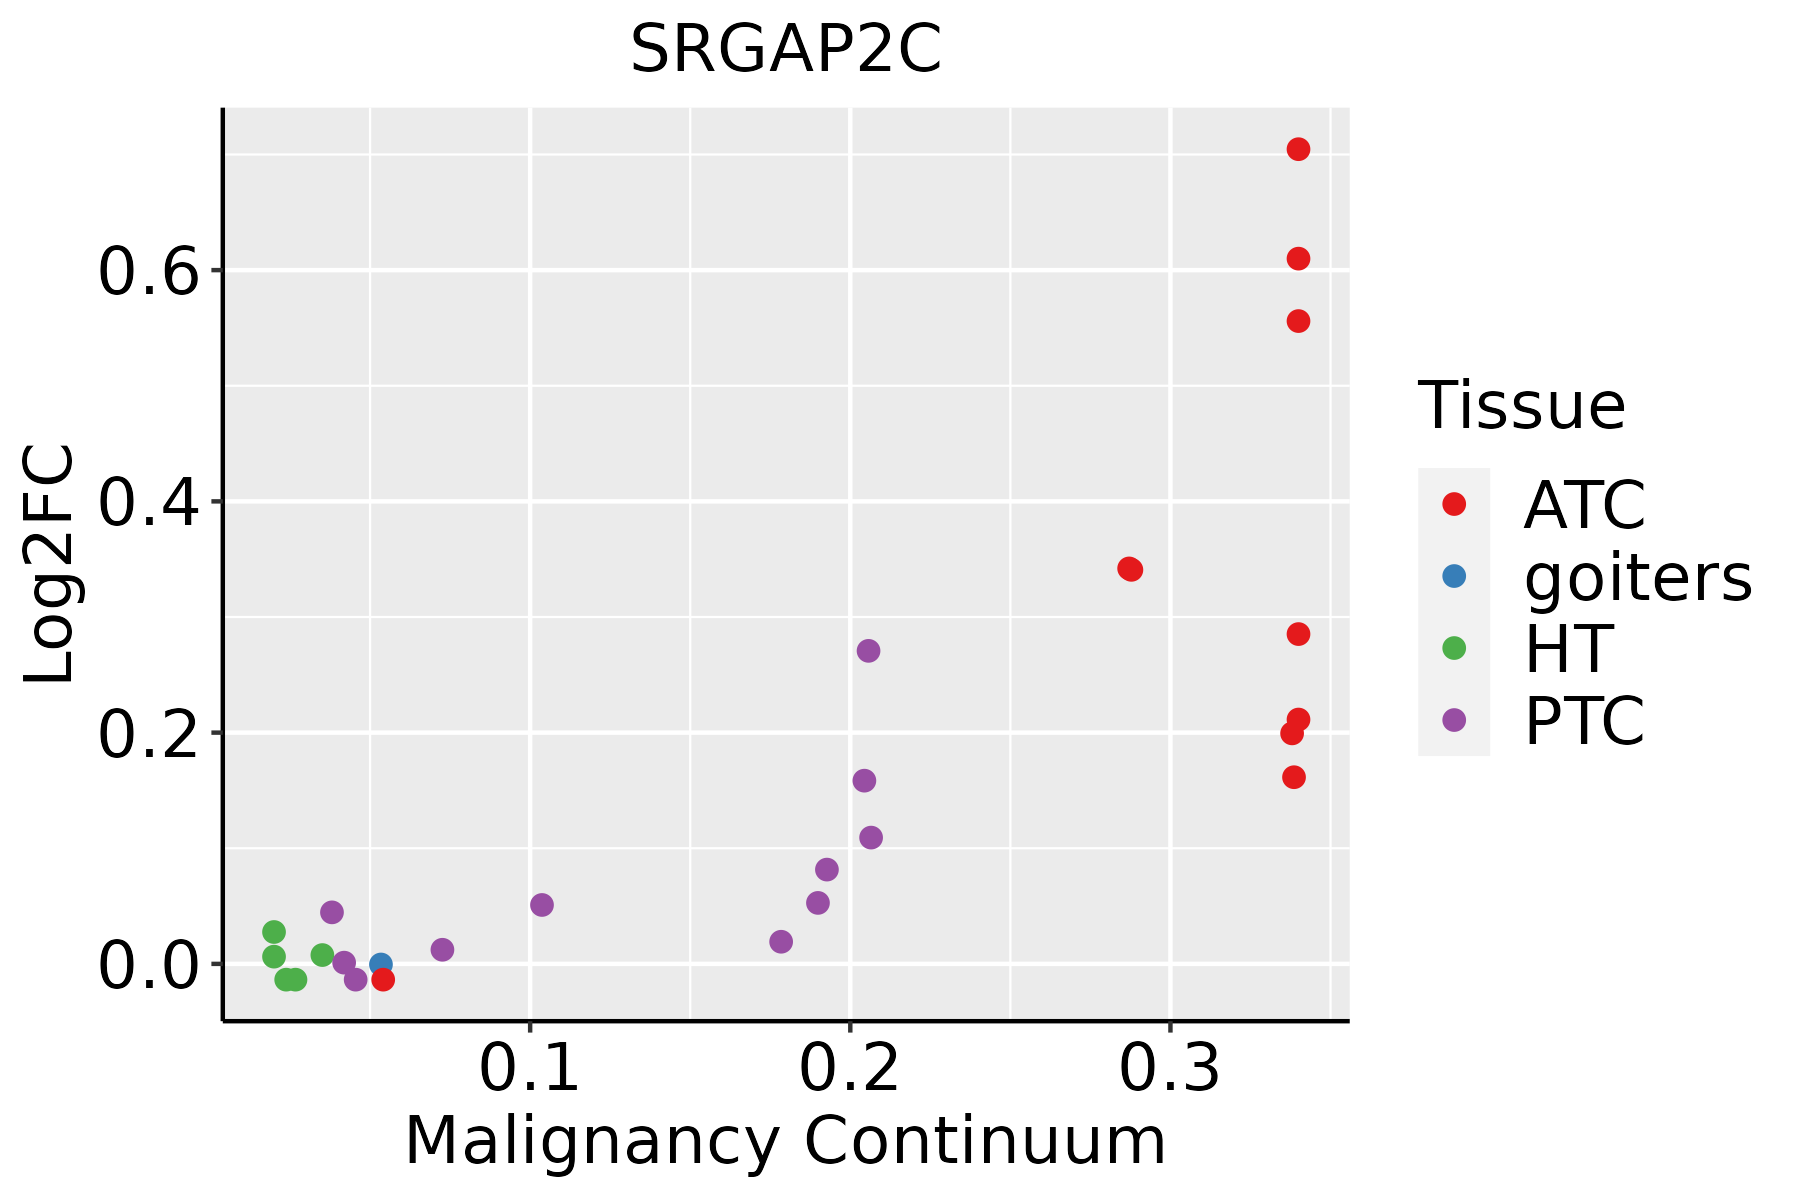 | ATC: Anaplastic thyroid cancer |
| HT: Hashimoto's thyroiditis | ||
| PTC: Papillary thyroid cancer |
| ∗log2FC in expression of this searched gene in stem-like cells from each diseased tissue sample relative to stem-like cells in normal samples in each tissue plotted against the malignancy continuum. Samples are colored based on if they are from different disease stage. |
Top |
Malignant transformation related pathway analysis |
| Find out the enriched GO biological processes and KEGG pathways involved in transition from healthy to precancer to cancer |
| Tissue | Disease Stage | Enriched GO biological Processes |
| Colorectum | AD |  |
| Colorectum | SER |  |
| Colorectum | MSS |  |
| Colorectum | MSI-H |  |
| Colorectum | FAP |  |
| ∗Top 15 enriched GO BP terms are showed in the bar plot of each disease state in each tissue. Each row represents a significant GO biological process which is colored according to the -log10(p.adjust). |
| Page: 1 2 3 4 5 6 7 8 9 |
| GO ID | Tissue | Disease Stage | Description | Gene Ratio | Bg Ratio | pvalue | p.adjust | Count |
| GO:006099616 | Thyroid | PTC | dendritic spine development | 59/5968 | 99/18723 | 1.18e-08 | 2.83e-07 | 59 |
| GO:001635819 | Thyroid | PTC | dendrite development | 115/5968 | 243/18723 | 3.16e-07 | 5.35e-06 | 115 |
| GO:0120032111 | Thyroid | PTC | regulation of plasma membrane bounded cell projection assembly | 92/5968 | 186/18723 | 4.12e-07 | 6.83e-06 | 92 |
| GO:006049120 | Thyroid | PTC | regulation of cell projection assembly | 92/5968 | 188/18723 | 7.55e-07 | 1.18e-05 | 92 |
| GO:00609988 | Thyroid | PTC | regulation of dendritic spine development | 37/5968 | 61/18723 | 3.41e-06 | 4.40e-05 | 37 |
| GO:00313459 | Thyroid | PTC | negative regulation of cell projection organization | 83/5968 | 186/18723 | 1.72e-04 | 1.32e-03 | 83 |
| GO:00514891 | Thyroid | PTC | regulation of filopodium assembly | 26/5968 | 47/18723 | 7.38e-04 | 4.59e-03 | 26 |
| GO:004206315 | Thyroid | PTC | gliogenesis | 121/5968 | 301/18723 | 1.30e-03 | 7.41e-03 | 121 |
| GO:00215438 | Thyroid | PTC | pallium development | 72/5968 | 169/18723 | 2.09e-03 | 1.11e-02 | 72 |
| GO:004684711 | Thyroid | PTC | filopodium assembly | 31/5968 | 62/18723 | 2.23e-03 | 1.18e-02 | 31 |
| GO:00215373 | Thyroid | PTC | telencephalon development | 100/5968 | 248/18723 | 2.90e-03 | 1.44e-02 | 100 |
| GO:00083471 | Thyroid | PTC | glial cell migration | 27/5968 | 53/18723 | 2.98e-03 | 1.47e-02 | 27 |
| GO:002198713 | Thyroid | PTC | cerebral cortex development | 50/5968 | 114/18723 | 4.71e-03 | 2.21e-02 | 50 |
| GO:00218011 | Thyroid | PTC | cerebral cortex radial glia guided migration | 14/5968 | 24/18723 | 6.65e-03 | 2.89e-02 | 14 |
| GO:00220301 | Thyroid | PTC | telencephalon glial cell migration | 14/5968 | 24/18723 | 6.65e-03 | 2.89e-02 | 14 |
| GO:00309007 | Thyroid | PTC | forebrain development | 143/5968 | 379/18723 | 8.47e-03 | 3.56e-02 | 143 |
| GO:0031268 | Thyroid | PTC | pseudopodium organization | 10/5968 | 16/18723 | 1.13e-02 | 4.49e-02 | 10 |
| GO:0016358110 | Thyroid | ATC | dendrite development | 119/6293 | 243/18723 | 4.65e-07 | 6.75e-06 | 119 |
| GO:012003223 | Thyroid | ATC | regulation of plasma membrane bounded cell projection assembly | 95/6293 | 186/18723 | 6.13e-07 | 8.49e-06 | 95 |
| GO:006099623 | Thyroid | ATC | dendritic spine development | 57/6293 | 99/18723 | 8.24e-07 | 1.09e-05 | 57 |
| Page: 1 2 |
| Pathway ID | Tissue | Disease Stage | Description | Gene Ratio | Bg Ratio | pvalue | p.adjust | qvalue | Count |
| Page: 1 |
Top |
Cell-cell communication analysis |
| Identification of potential cell-cell interactions between two cell types and their ligand-receptor pairs for different disease states |
| Ligand | Receptor | LRpair | Pathway | Tissue | Disease Stage |
| Page: 1 |
Top |
Single-cell gene regulatory network inference analysis |
| Find out the significant the regulons (TFs) and the target genes of each regulon across cell types for different disease states |
| TF | Cell Type | Tissue | Disease Stage | Target Gene | RSS | Regulon Activity |
| ∗The dot plots of a searched regulon are shown for all cell subpopulations in each disease state of each tissue based on the regulon specific score inferred using pySCENIC and by calculating the average expression. |
| Page: 1 |
Top |
Somatic mutation of malignant transformation related genes |
| Annotation of somatic variants for genes involved in malignant transformation |
| Hugo Symbol | Variant Class | Variant Classification | dbSNP RS | HGVSc | HGVSp | HGVSp Short | SWISSPROT | BIOTYPE | SIFT | PolyPhen | Tumor Sample Barcode | Tissue | Histology | Sex | Age | Stage | Therapy Types | Drugs | Outcome |
| SRGAP2C | SNV | Missense_Mutation | novel | c.222N>G | p.Phe74Leu | p.F74L | P0DJJ0 | protein_coding | tolerated(0.05) | benign(0.302) | TCGA-EK-A2RJ-01 | Cervix | cervical & endocervical cancer | Female | <65 | I/II | Unknown | Unknown | SD |
| SRGAP2C | SNV | Missense_Mutation | novel | c.673G>T | p.Val225Leu | p.V225L | P0DJJ0 | protein_coding | tolerated(0.46) | probably_damaging(0.971) | TCGA-Q1-A73Q-01 | Cervix | cervical & endocervical cancer | Female | <65 | I/II | Chemotherapy | cisplatin | SD |
| SRGAP2C | SNV | Missense_Mutation | novel | c.983N>A | p.Arg328His | p.R328H | P0DJJ0 | protein_coding | deleterious(0.01) | possibly_damaging(0.759) | TCGA-A6-6780-01 | Colorectum | colon adenocarcinoma | Male | >=65 | I/II | Unknown | Unknown | SD |
| SRGAP2C | SNV | Missense_Mutation | novel | c.599A>G | p.Asp200Gly | p.D200G | P0DJJ0 | protein_coding | tolerated(0.48) | benign(0.058) | TCGA-AA-3855-01 | Colorectum | colon adenocarcinoma | Male | >=65 | I/II | Unknown | Unknown | SD |
| SRGAP2C | SNV | Missense_Mutation | novel | c.1337C>A | p.Thr446Lys | p.T446K | P0DJJ0 | protein_coding | deleterious(0) | probably_damaging(0.994) | TCGA-D5-6531-01 | Colorectum | colon adenocarcinoma | Male | >=65 | I/II | Unknown | Unknown | SD |
| SRGAP2C | SNV | Missense_Mutation | novel | c.567N>T | p.Glu189Asp | p.E189D | P0DJJ0 | protein_coding | deleterious(0) | probably_damaging(0.971) | TCGA-EI-6917-01 | Colorectum | rectum adenocarcinoma | Male | <65 | III/IV | Chemotherapy | 5fluorouracil+oxaciplatina+l-folinian | SD |
| SRGAP2C | SNV | Missense_Mutation | novel | c.954N>C | p.Glu318Asp | p.E318D | P0DJJ0 | protein_coding | tolerated(0.79) | probably_damaging(0.971) | TCGA-A5-A0GP-01 | Endometrium | uterine corpus endometrioid carcinoma | Female | <65 | I/II | Unknown | Unknown | SD |
| SRGAP2C | SNV | Missense_Mutation | novel | c.683T>C | p.Ile228Thr | p.I228T | P0DJJ0 | protein_coding | tolerated(0.05) | probably_damaging(0.978) | TCGA-AJ-A3EK-01 | Endometrium | uterine corpus endometrioid carcinoma | Female | <65 | I/II | Chemotherapy | carboplatin | CR |
| SRGAP2C | SNV | Missense_Mutation | novel | c.872N>T | p.Ala291Val | p.A291V | P0DJJ0 | protein_coding | tolerated(1) | benign(0.015) | TCGA-AJ-A3NH-01 | Endometrium | uterine corpus endometrioid carcinoma | Female | >=65 | I/II | Chemotherapy | carboplatin | CR |
| SRGAP2C | SNV | Missense_Mutation | novel | c.728A>C | p.Lys243Thr | p.K243T | P0DJJ0 | protein_coding | deleterious(0.01) | benign(0.129) | TCGA-AP-A056-01 | Endometrium | uterine corpus endometrioid carcinoma | Female | <65 | I/II | Unknown | Unknown | SD |
| Page: 1 2 3 |
Top |
Related drugs of malignant transformation related genes |
| Identification of chemicals and drugs interact with genes involved in malignant transfromation |
| (DGIdb 4.0) |
| Entrez ID | Symbol | Category | Interaction Types | Drug Claim Name | Drug Name | PMIDs |
| Page: 1 |

Copyright 2023-Present -The University of Texas Health Science Center at Houston |