
|
|||||
|
 | |
| |
| |
| |
| |
| |
|
Gene: SRGAP2 |
Gene summary for SRGAP2 |
| Gene information | Species | Human | Gene symbol | SRGAP2 | Gene ID | 23380 |
| Gene name | SLIT-ROBO Rho GTPase activating protein 2 | |
| Gene Alias | ARHGAP34 | |
| Cytomap | 1q32.1 | |
| Gene Type | protein-coding | GO ID | GO:0000226 | UniProtAcc | B4DFE5 |
Top |
Malignant transformation analysis |
| Identification of the aberrant gene expression in precancerous and cancerous lesions by comparing the gene expression of stem-like cells in diseased tissues with normal stem cells |
| Entrez ID | Symbol | Replicates | Species | Organ | Tissue | Adj P-value | Log2FC | Malignancy |
| 23380 | SRGAP2 | CCI_1 | Human | Cervix | CC | 3.88e-04 | 7.35e-01 | 0.528 |
| 23380 | SRGAP2 | CCI_2 | Human | Cervix | CC | 2.29e-02 | 5.46e-01 | 0.5249 |
| 23380 | SRGAP2 | CCI_3 | Human | Cervix | CC | 4.86e-06 | 5.62e-01 | 0.516 |
| 23380 | SRGAP2 | S014 | Human | Liver | HCC | 1.22e-15 | 6.20e-01 | 0.2254 |
| 23380 | SRGAP2 | S015 | Human | Liver | HCC | 5.55e-06 | 3.71e-01 | 0.2375 |
| 23380 | SRGAP2 | S016 | Human | Liver | HCC | 4.32e-15 | 5.27e-01 | 0.2243 |
| 23380 | SRGAP2 | S028 | Human | Liver | HCC | 1.23e-03 | 3.01e-01 | 0.2503 |
| 23380 | SRGAP2 | S029 | Human | Liver | HCC | 4.37e-06 | 3.50e-01 | 0.2581 |
| 23380 | SRGAP2 | PTC04 | Human | Thyroid | PTC | 5.43e-04 | 1.13e-01 | 0.1927 |
| 23380 | SRGAP2 | PTC05 | Human | Thyroid | PTC | 2.87e-07 | 2.80e-01 | 0.2065 |
| 23380 | SRGAP2 | PTC06 | Human | Thyroid | PTC | 3.15e-09 | 2.69e-01 | 0.2057 |
| 23380 | SRGAP2 | PTC07 | Human | Thyroid | PTC | 4.67e-07 | 1.60e-01 | 0.2044 |
| 23380 | SRGAP2 | ATC09 | Human | Thyroid | ATC | 4.52e-12 | 3.47e-01 | 0.2871 |
| 23380 | SRGAP2 | ATC12 | Human | Thyroid | ATC | 3.77e-15 | 2.91e-01 | 0.34 |
| 23380 | SRGAP2 | ATC13 | Human | Thyroid | ATC | 1.45e-24 | 3.44e-01 | 0.34 |
| 23380 | SRGAP2 | ATC1 | Human | Thyroid | ATC | 3.37e-11 | 3.45e-01 | 0.2878 |
| 23380 | SRGAP2 | ATC2 | Human | Thyroid | ATC | 3.39e-19 | 9.19e-01 | 0.34 |
| 23380 | SRGAP2 | ATC4 | Human | Thyroid | ATC | 8.26e-18 | 3.46e-01 | 0.34 |
| 23380 | SRGAP2 | ATC5 | Human | Thyroid | ATC | 1.50e-26 | 3.85e-01 | 0.34 |
| Page: 1 |
| Tissue | Expression Dynamics | Abbreviation |
| Cervix |  | CC: Cervix cancer |
| HSIL_HPV: HPV-infected high-grade squamous intraepithelial lesions | ||
| N_HPV: HPV-infected normal cervix | ||
| Liver | 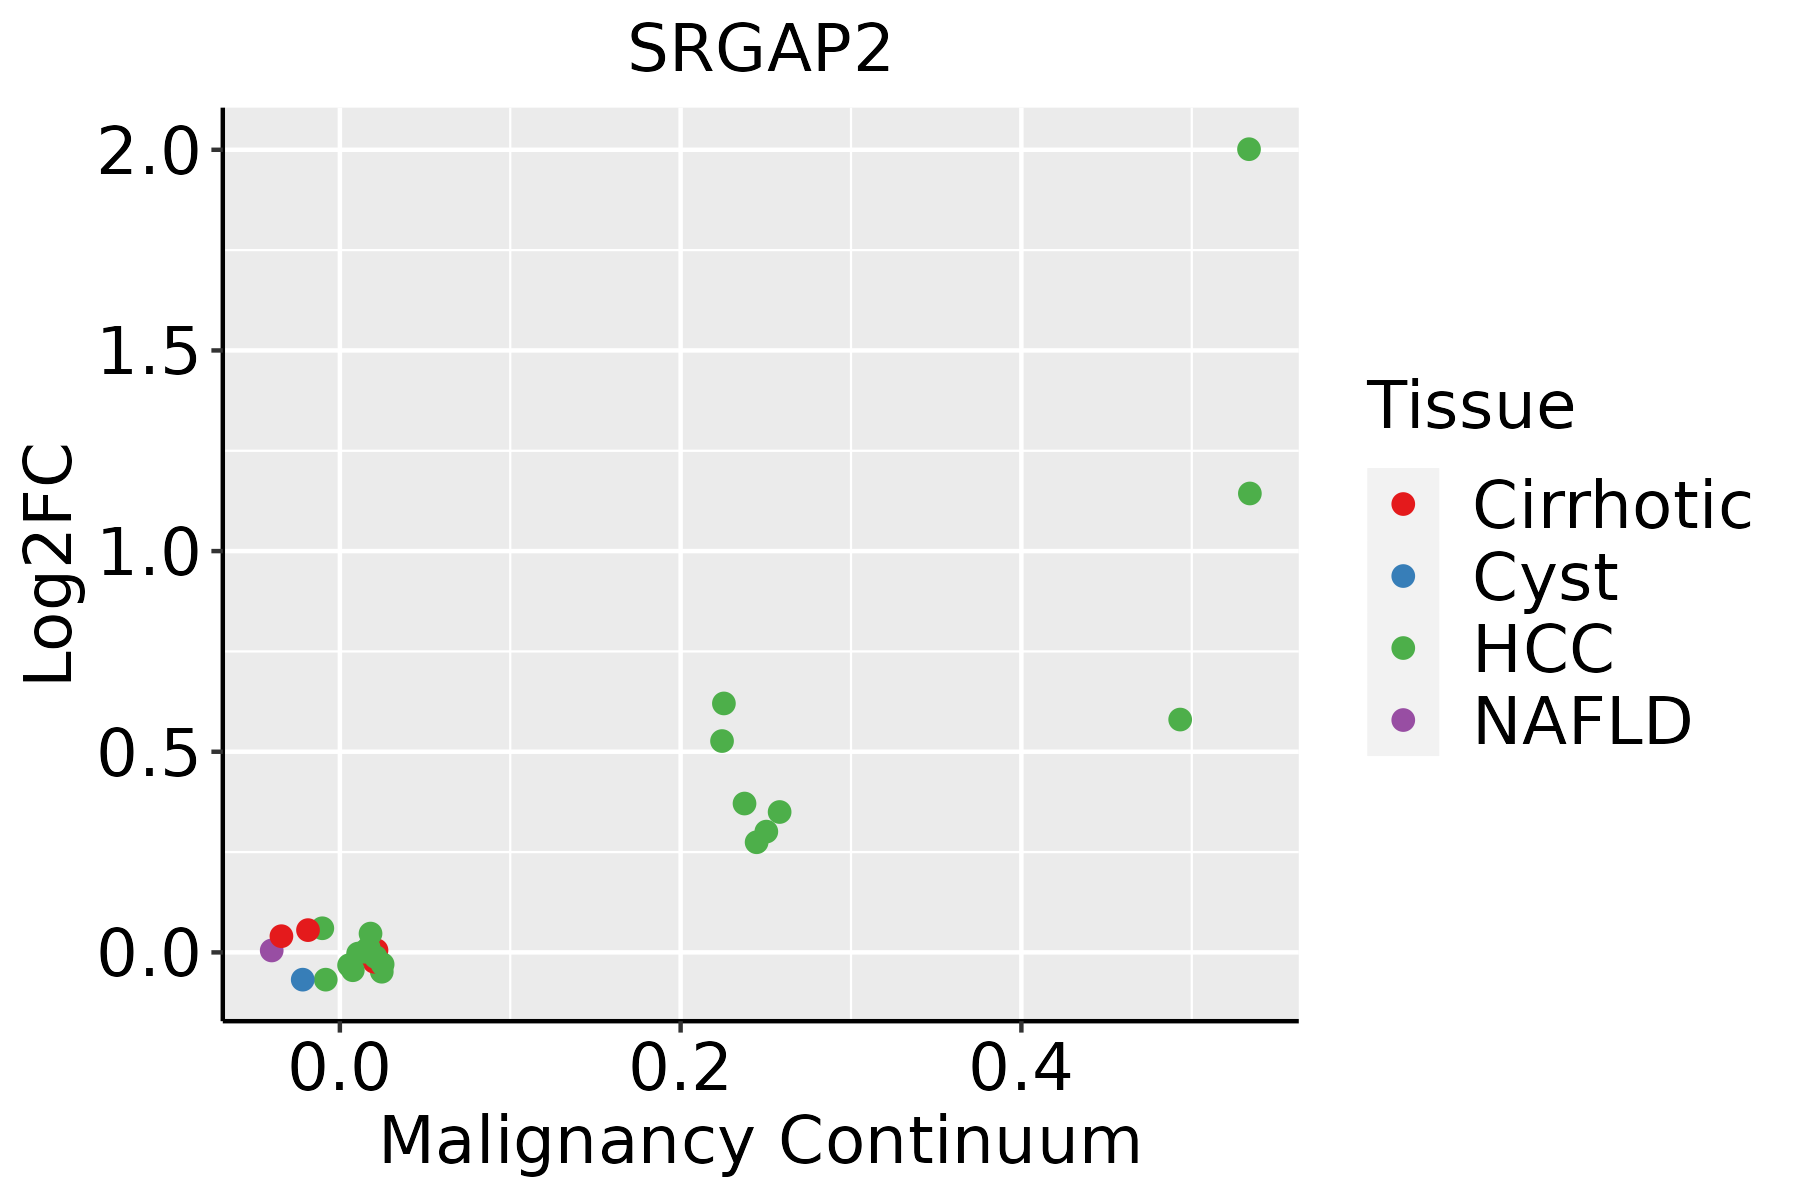 | HCC: Hepatocellular carcinoma |
| NAFLD: Non-alcoholic fatty liver disease | ||
| Thyroid | 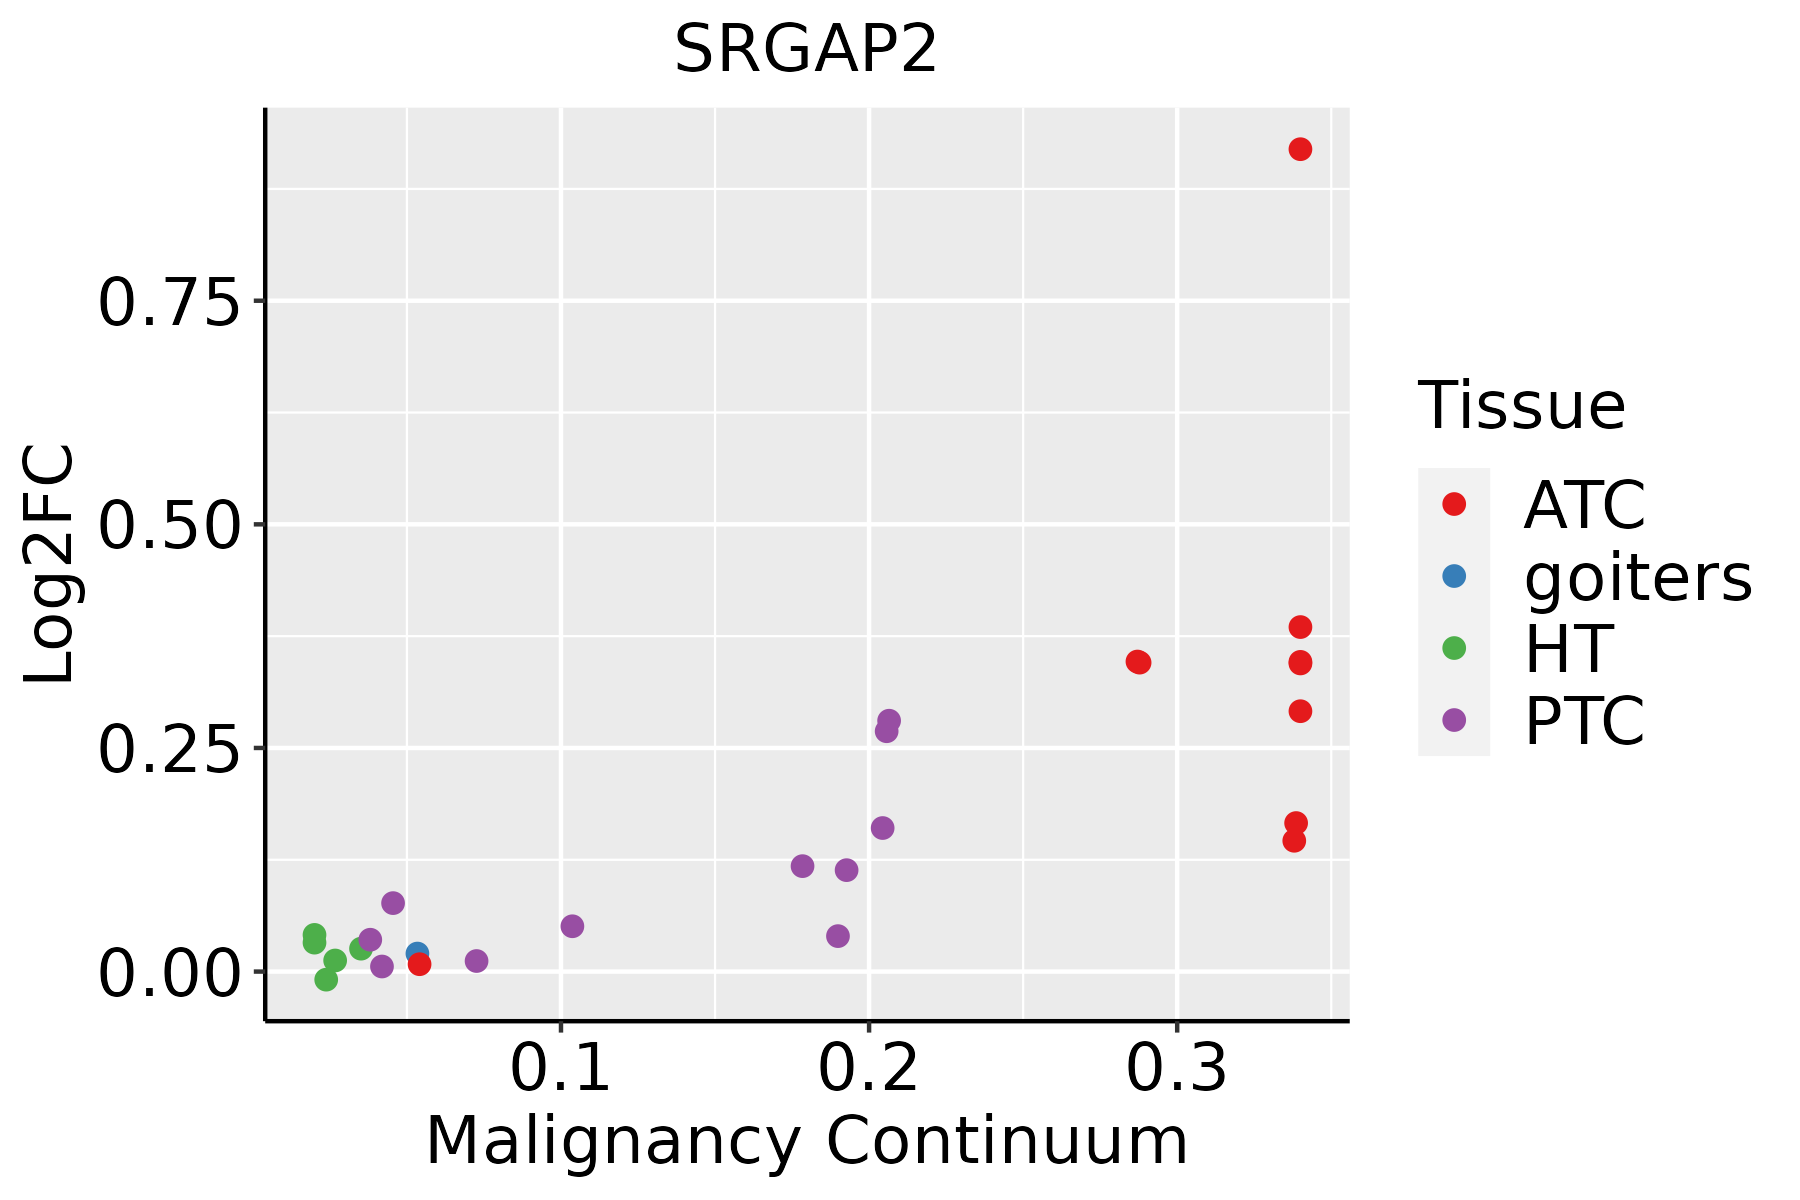 | ATC: Anaplastic thyroid cancer |
| HT: Hashimoto's thyroiditis | ||
| PTC: Papillary thyroid cancer |
| ∗log2FC in expression of this searched gene in stem-like cells from each diseased tissue sample relative to stem-like cells in normal samples in each tissue plotted against the malignancy continuum. Samples are colored based on if they are from different disease stage. |
Top |
Malignant transformation related pathway analysis |
| Find out the enriched GO biological processes and KEGG pathways involved in transition from healthy to precancer to cancer |
| Tissue | Disease Stage | Enriched GO biological Processes |
| Colorectum | AD |  |
| Colorectum | SER |  |
| Colorectum | MSS |  |
| Colorectum | MSI-H |  |
| Colorectum | FAP |  |
| ∗Top 15 enriched GO BP terms are showed in the bar plot of each disease state in each tissue. Each row represents a significant GO biological process which is colored according to the -log10(p.adjust). |
| Page: 1 2 3 4 5 6 7 8 9 |
| GO ID | Tissue | Disease Stage | Description | Gene Ratio | Bg Ratio | pvalue | p.adjust | Count |
| GO:00315898 | Cervix | CC | cell-substrate adhesion | 96/2311 | 363/18723 | 1.48e-13 | 8.85e-11 | 96 |
| GO:00016679 | Cervix | CC | ameboidal-type cell migration | 110/2311 | 475/18723 | 2.66e-11 | 6.36e-09 | 110 |
| GO:00510566 | Cervix | CC | regulation of small GTPase mediated signal transduction | 75/2311 | 302/18723 | 1.54e-09 | 1.74e-07 | 75 |
| GO:00430877 | Cervix | CC | regulation of GTPase activity | 79/2311 | 348/18723 | 4.21e-08 | 2.60e-06 | 79 |
| GO:00975817 | Cervix | CC | lamellipodium organization | 31/2311 | 90/18723 | 4.57e-08 | 2.76e-06 | 31 |
| GO:00300325 | Cervix | CC | lamellipodium assembly | 26/2311 | 72/18723 | 1.87e-07 | 8.48e-06 | 26 |
| GO:00163587 | Cervix | CC | dendrite development | 58/2311 | 243/18723 | 4.52e-07 | 1.76e-05 | 58 |
| GO:00344469 | Cervix | CC | substrate adhesion-dependent cell spreading | 32/2311 | 108/18723 | 1.36e-06 | 4.55e-05 | 32 |
| GO:00609965 | Cervix | CC | dendritic spine development | 28/2311 | 99/18723 | 1.61e-05 | 3.15e-04 | 28 |
| GO:00512713 | Cervix | CC | negative regulation of cellular component movement | 73/2311 | 367/18723 | 2.22e-05 | 3.95e-04 | 73 |
| GO:00400133 | Cervix | CC | negative regulation of locomotion | 76/2311 | 391/18723 | 3.47e-05 | 5.60e-04 | 76 |
| GO:20001463 | Cervix | CC | negative regulation of cell motility | 71/2311 | 359/18723 | 3.47e-05 | 5.60e-04 | 71 |
| GO:00303363 | Cervix | CC | negative regulation of cell migration | 68/2311 | 344/18723 | 5.11e-05 | 7.70e-04 | 68 |
| GO:00435476 | Cervix | CC | positive regulation of GTPase activity | 53/2311 | 255/18723 | 8.72e-05 | 1.16e-03 | 53 |
| GO:00219873 | Cervix | CC | cerebral cortex development | 25/2311 | 114/18723 | 2.81e-03 | 1.88e-02 | 25 |
| GO:00309003 | Cervix | CC | forebrain development | 64/2311 | 379/18723 | 5.53e-03 | 3.19e-02 | 64 |
| GO:00215433 | Cervix | CC | pallium development | 32/2311 | 169/18723 | 8.73e-03 | 4.48e-02 | 32 |
| GO:00510143 | Cervix | CC | actin filament severing | 6/2311 | 16/18723 | 9.35e-03 | 4.66e-02 | 6 |
| GO:009758121 | Liver | HCC | lamellipodium organization | 58/7958 | 90/18723 | 2.16e-05 | 2.30e-04 | 58 |
| GO:003444622 | Liver | HCC | substrate adhesion-dependent cell spreading | 67/7958 | 108/18723 | 3.24e-05 | 3.28e-04 | 67 |
| Page: 1 2 3 4 |
| Pathway ID | Tissue | Disease Stage | Description | Gene Ratio | Bg Ratio | pvalue | p.adjust | qvalue | Count |
| hsa043609 | Cervix | CC | Axon guidance | 47/1267 | 182/8465 | 8.13e-05 | 5.38e-04 | 3.18e-04 | 47 |
| hsa0436012 | Cervix | CC | Axon guidance | 47/1267 | 182/8465 | 8.13e-05 | 5.38e-04 | 3.18e-04 | 47 |
| Page: 1 |
Top |
Cell-cell communication analysis |
| Identification of potential cell-cell interactions between two cell types and their ligand-receptor pairs for different disease states |
| Ligand | Receptor | LRpair | Pathway | Tissue | Disease Stage |
| Page: 1 |
Top |
Single-cell gene regulatory network inference analysis |
| Find out the significant the regulons (TFs) and the target genes of each regulon across cell types for different disease states |
| TF | Cell Type | Tissue | Disease Stage | Target Gene | RSS | Regulon Activity |
| ∗The dot plots of a searched regulon are shown for all cell subpopulations in each disease state of each tissue based on the regulon specific score inferred using pySCENIC and by calculating the average expression. |
| Page: 1 |
Top |
Somatic mutation of malignant transformation related genes |
| Annotation of somatic variants for genes involved in malignant transformation |
| Hugo Symbol | Variant Class | Variant Classification | dbSNP RS | HGVSc | HGVSp | HGVSp Short | SWISSPROT | BIOTYPE | SIFT | PolyPhen | Tumor Sample Barcode | Tissue | Histology | Sex | Age | Stage | Therapy Types | Drugs | Outcome |
| SRGAP2 | SNV | Missense_Mutation | novel | c.2214N>A | p.Asp738Glu | p.D738E | protein_coding | deleterious(0) | probably_damaging(0.926) | TCGA-A2-A0D0-01 | Breast | breast invasive carcinoma | Female | <65 | I/II | Chemotherapy | cytoxan | SD | |
| SRGAP2 | SNV | Missense_Mutation | rs782210132 | c.2744N>G | p.Asp915Gly | p.D915G | protein_coding | deleterious(0) | possibly_damaging(0.735) | TCGA-A2-A0D0-01 | Breast | breast invasive carcinoma | Female | <65 | I/II | Chemotherapy | cytoxan | SD | |
| SRGAP2 | SNV | Missense_Mutation | c.1959N>T | p.Glu653Asp | p.E653D | protein_coding | tolerated(1) | benign(0.006) | TCGA-AO-A128-01 | Breast | breast invasive carcinoma | Female | <65 | I/II | Chemotherapy | doxorubicin | SD | ||
| SRGAP2 | SNV | Missense_Mutation | c.1529N>A | p.Ser510Asn | p.S510N | protein_coding | deleterious(0) | possibly_damaging(0.876) | TCGA-AR-A1AS-01 | Breast | breast invasive carcinoma | Female | <65 | I/II | Chemotherapy | doxorubicin | SD | ||
| SRGAP2 | SNV | Missense_Mutation | c.617N>T | p.Ser206Phe | p.S206F | protein_coding | deleterious(0.01) | possibly_damaging(0.88) | TCGA-AR-A1AX-01 | Breast | breast invasive carcinoma | Female | <65 | I/II | Chemotherapy | cytoxan | SD | ||
| SRGAP2 | SNV | Missense_Mutation | c.2889G>C | p.Gln963His | p.Q963H | protein_coding | deleterious_low_confidence(0) | probably_damaging(0.999) | TCGA-C8-A12K-01 | Breast | breast invasive carcinoma | Female | >=65 | I/II | Unknown | Unknown | SD | ||
| SRGAP2 | SNV | Missense_Mutation | c.1996G>C | p.Glu666Gln | p.E666Q | protein_coding | tolerated(0.26) | benign(0.148) | TCGA-D8-A1JC-01 | Breast | breast invasive carcinoma | Female | <65 | III/IV | Chemotherapy | adriamycin | SD | ||
| SRGAP2 | SNV | Missense_Mutation | c.1637A>T | p.Glu546Val | p.E546V | protein_coding | deleterious(0) | probably_damaging(0.993) | TCGA-D8-A1XQ-01 | Breast | breast invasive carcinoma | Female | >=65 | I/II | Unknown | Unknown | SD | ||
| SRGAP2 | SNV | Missense_Mutation | novel | c.1239N>G | p.Phe413Leu | p.F413L | protein_coding | tolerated(0.09) | probably_damaging(0.998) | TCGA-E2-A1LG-01 | Breast | breast invasive carcinoma | Female | <65 | I/II | Chemotherapy | doxorubicin | SD | |
| SRGAP2 | SNV | Missense_Mutation | novel | c.1631N>C | p.Arg544Thr | p.R544T | protein_coding | deleterious(0) | probably_damaging(0.983) | TCGA-EK-A2RN-01 | Cervix | cervical & endocervical cancer | Female | <65 | I/II | Unknown | Unknown | SD |
| Page: 1 2 3 4 5 6 7 8 9 |
Top |
Related drugs of malignant transformation related genes |
| Identification of chemicals and drugs interact with genes involved in malignant transfromation |
| (DGIdb 4.0) |
| Entrez ID | Symbol | Category | Interaction Types | Drug Claim Name | Drug Name | PMIDs |
| Page: 1 |

Copyright 2023-Present -The University of Texas Health Science Center at Houston |