
|
|||||
|
 | |
| |
| |
| |
| |
| |
|
Gene: SRGAP1 |
Gene summary for SRGAP1 |
| Gene information | Species | Human | Gene symbol | SRGAP1 | Gene ID | 57522 |
| Gene name | SLIT-ROBO Rho GTPase activating protein 1 | |
| Gene Alias | ARHGAP13 | |
| Cytomap | 12q14.2 | |
| Gene Type | protein-coding | GO ID | GO:0006928 | UniProtAcc | Q7Z6B7 |
Top |
Malignant transformation analysis |
| Identification of the aberrant gene expression in precancerous and cancerous lesions by comparing the gene expression of stem-like cells in diseased tissues with normal stem cells |
| Entrez ID | Symbol | Replicates | Species | Organ | Tissue | Adj P-value | Log2FC | Malignancy |
| 57522 | SRGAP1 | HSIL_HPV_2 | Human | Cervix | HSIL_HPV | 6.26e-03 | 2.01e-01 | 0.0208 |
| 57522 | SRGAP1 | CCI_1 | Human | Cervix | CC | 6.20e-09 | 9.62e-01 | 0.528 |
| 57522 | SRGAP1 | H2 | Human | Cervix | HSIL_HPV | 8.87e-04 | 2.21e-01 | 0.0632 |
| 57522 | SRGAP1 | HTA11_3410_2000001011 | Human | Colorectum | AD | 1.10e-14 | -5.35e-01 | 0.0155 |
| 57522 | SRGAP1 | HTA11_347_2000001011 | Human | Colorectum | AD | 1.82e-03 | 4.01e-01 | -0.1954 |
| 57522 | SRGAP1 | HTA11_866_3004761011 | Human | Colorectum | AD | 8.55e-08 | -5.46e-01 | 0.096 |
| 57522 | SRGAP1 | HTA11_10711_2000001011 | Human | Colorectum | AD | 2.37e-02 | -4.96e-01 | 0.0338 |
| 57522 | SRGAP1 | HTA11_7696_3000711011 | Human | Colorectum | AD | 9.10e-12 | -4.79e-01 | 0.0674 |
| 57522 | SRGAP1 | HTA11_6818_2000001021 | Human | Colorectum | AD | 1.72e-03 | -5.17e-01 | 0.0588 |
| 57522 | SRGAP1 | HTA11_99999970781_79442 | Human | Colorectum | MSS | 1.09e-17 | -5.70e-01 | 0.294 |
| 57522 | SRGAP1 | HTA11_99999973899_84307 | Human | Colorectum | MSS | 1.00e-06 | -7.24e-01 | 0.2585 |
| 57522 | SRGAP1 | HTA11_99999974143_84620 | Human | Colorectum | MSS | 1.22e-16 | -6.17e-01 | 0.3005 |
| 57522 | SRGAP1 | F007 | Human | Colorectum | FAP | 4.48e-03 | -3.66e-01 | 0.1176 |
| 57522 | SRGAP1 | A001-C-207 | Human | Colorectum | FAP | 3.13e-06 | -4.40e-01 | 0.1278 |
| 57522 | SRGAP1 | A015-C-203 | Human | Colorectum | FAP | 4.14e-27 | -5.28e-01 | -0.1294 |
| 57522 | SRGAP1 | A015-C-204 | Human | Colorectum | FAP | 2.63e-05 | -3.26e-01 | -0.0228 |
| 57522 | SRGAP1 | A014-C-040 | Human | Colorectum | FAP | 1.16e-05 | -6.23e-01 | -0.1184 |
| 57522 | SRGAP1 | A002-C-201 | Human | Colorectum | FAP | 4.35e-14 | -4.82e-01 | 0.0324 |
| 57522 | SRGAP1 | A002-C-203 | Human | Colorectum | FAP | 3.02e-02 | -1.96e-01 | 0.2786 |
| 57522 | SRGAP1 | A001-C-119 | Human | Colorectum | FAP | 2.53e-06 | -4.81e-01 | -0.1557 |
| Page: 1 2 3 4 5 6 7 8 |
| Tissue | Expression Dynamics | Abbreviation |
| Cervix | 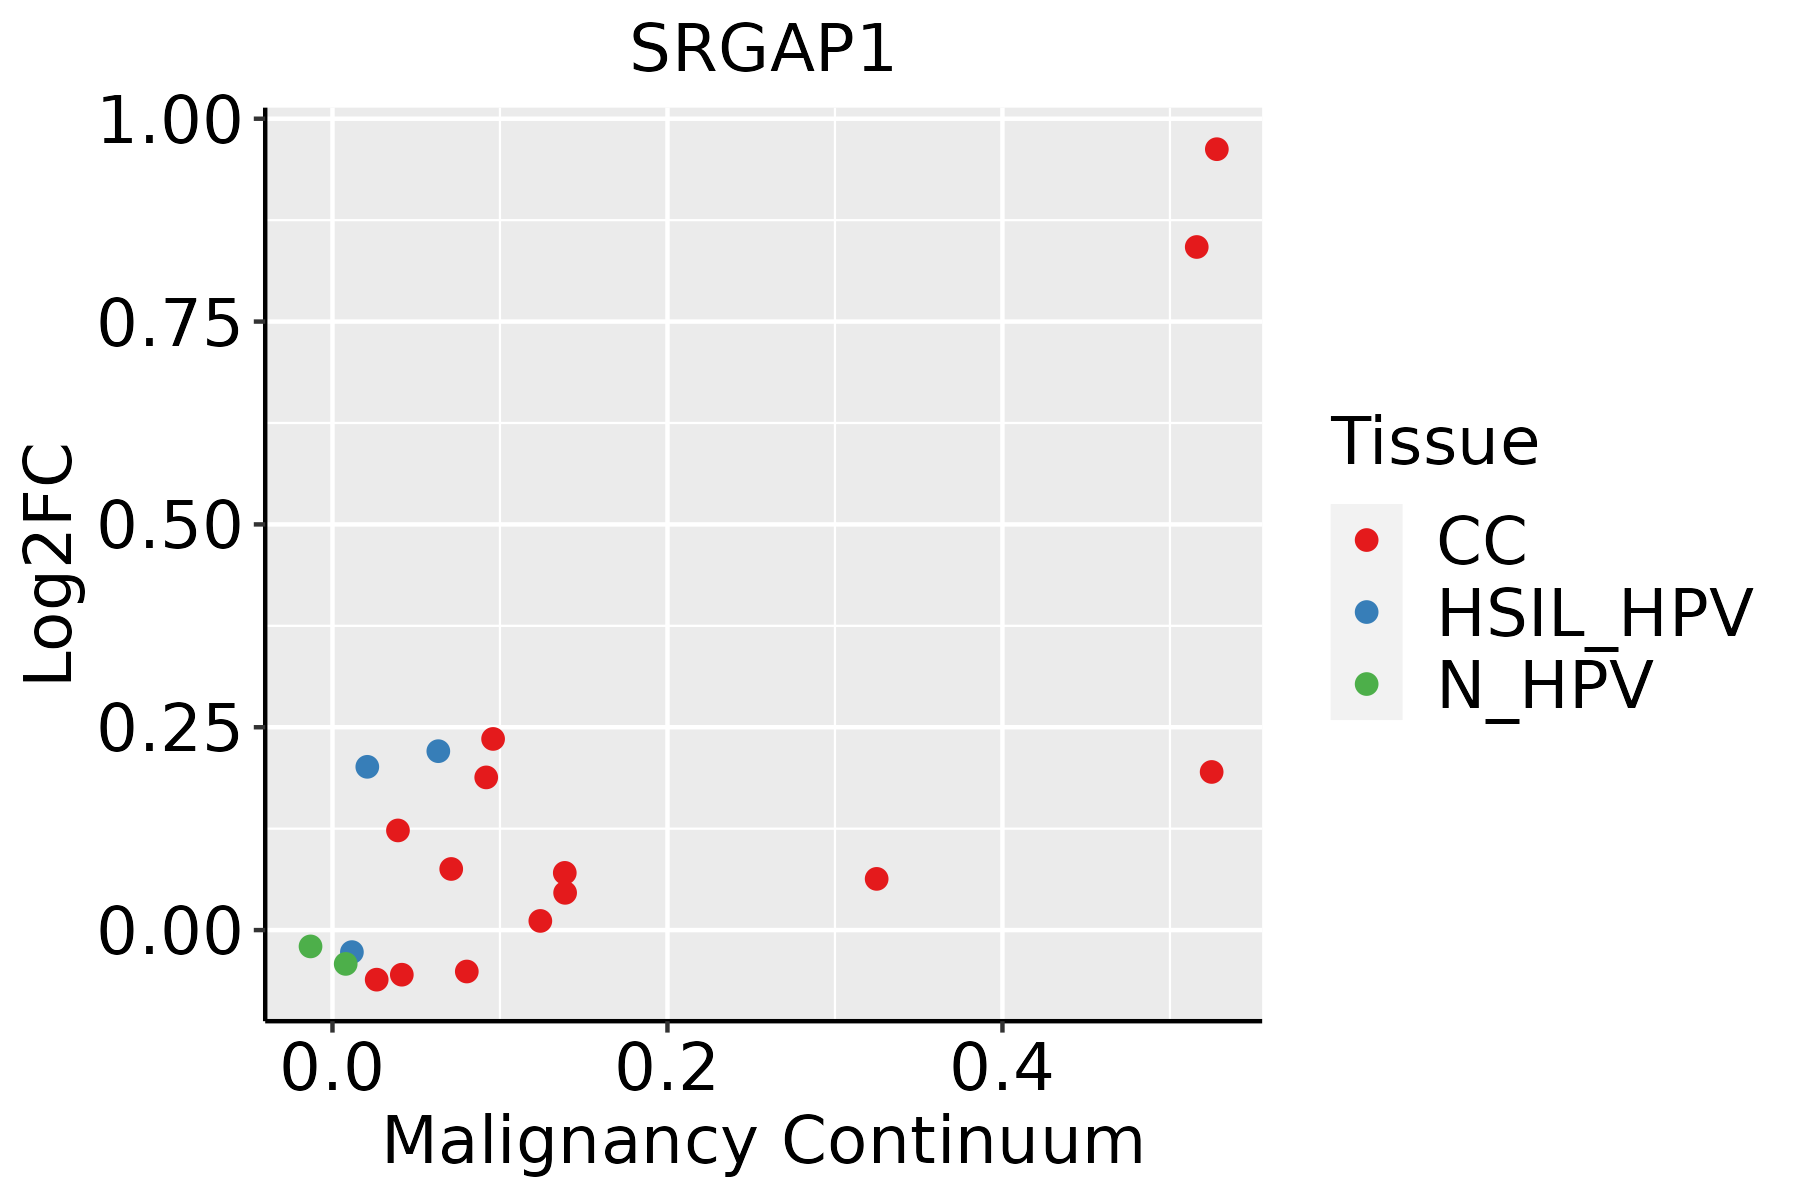 | CC: Cervix cancer |
| HSIL_HPV: HPV-infected high-grade squamous intraepithelial lesions | ||
| N_HPV: HPV-infected normal cervix | ||
| Colorectum (GSE201348) |  | FAP: Familial adenomatous polyposis |
| CRC: Colorectal cancer | ||
| Colorectum (HTA11) |  | AD: Adenomas |
| SER: Sessile serrated lesions | ||
| MSI-H: Microsatellite-high colorectal cancer | ||
| MSS: Microsatellite stable colorectal cancer | ||
| Endometrium | 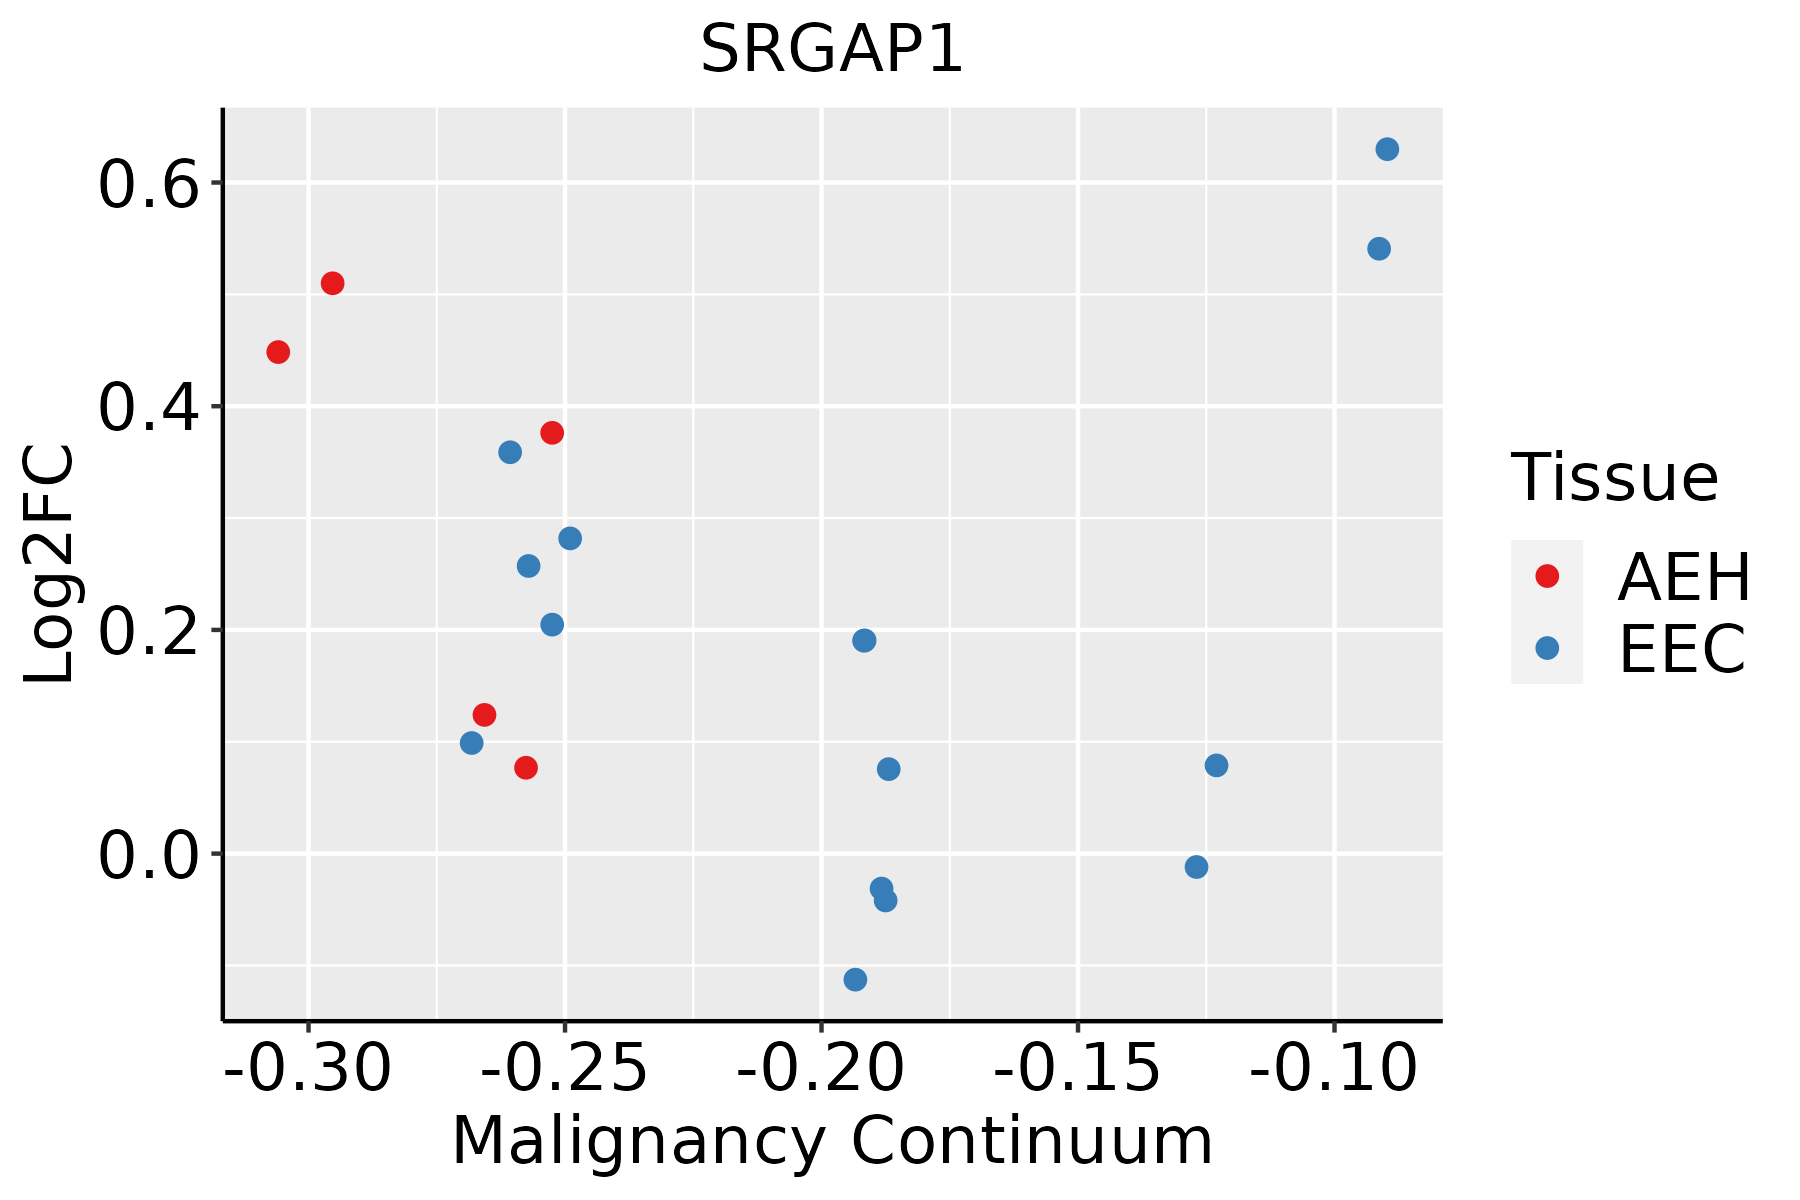 | AEH: Atypical endometrial hyperplasia |
| EEC: Endometrioid Cancer | ||
| Esophagus |  | ESCC: Esophageal squamous cell carcinoma |
| HGIN: High-grade intraepithelial neoplasias | ||
| LGIN: Low-grade intraepithelial neoplasias | ||
| Oral Cavity | 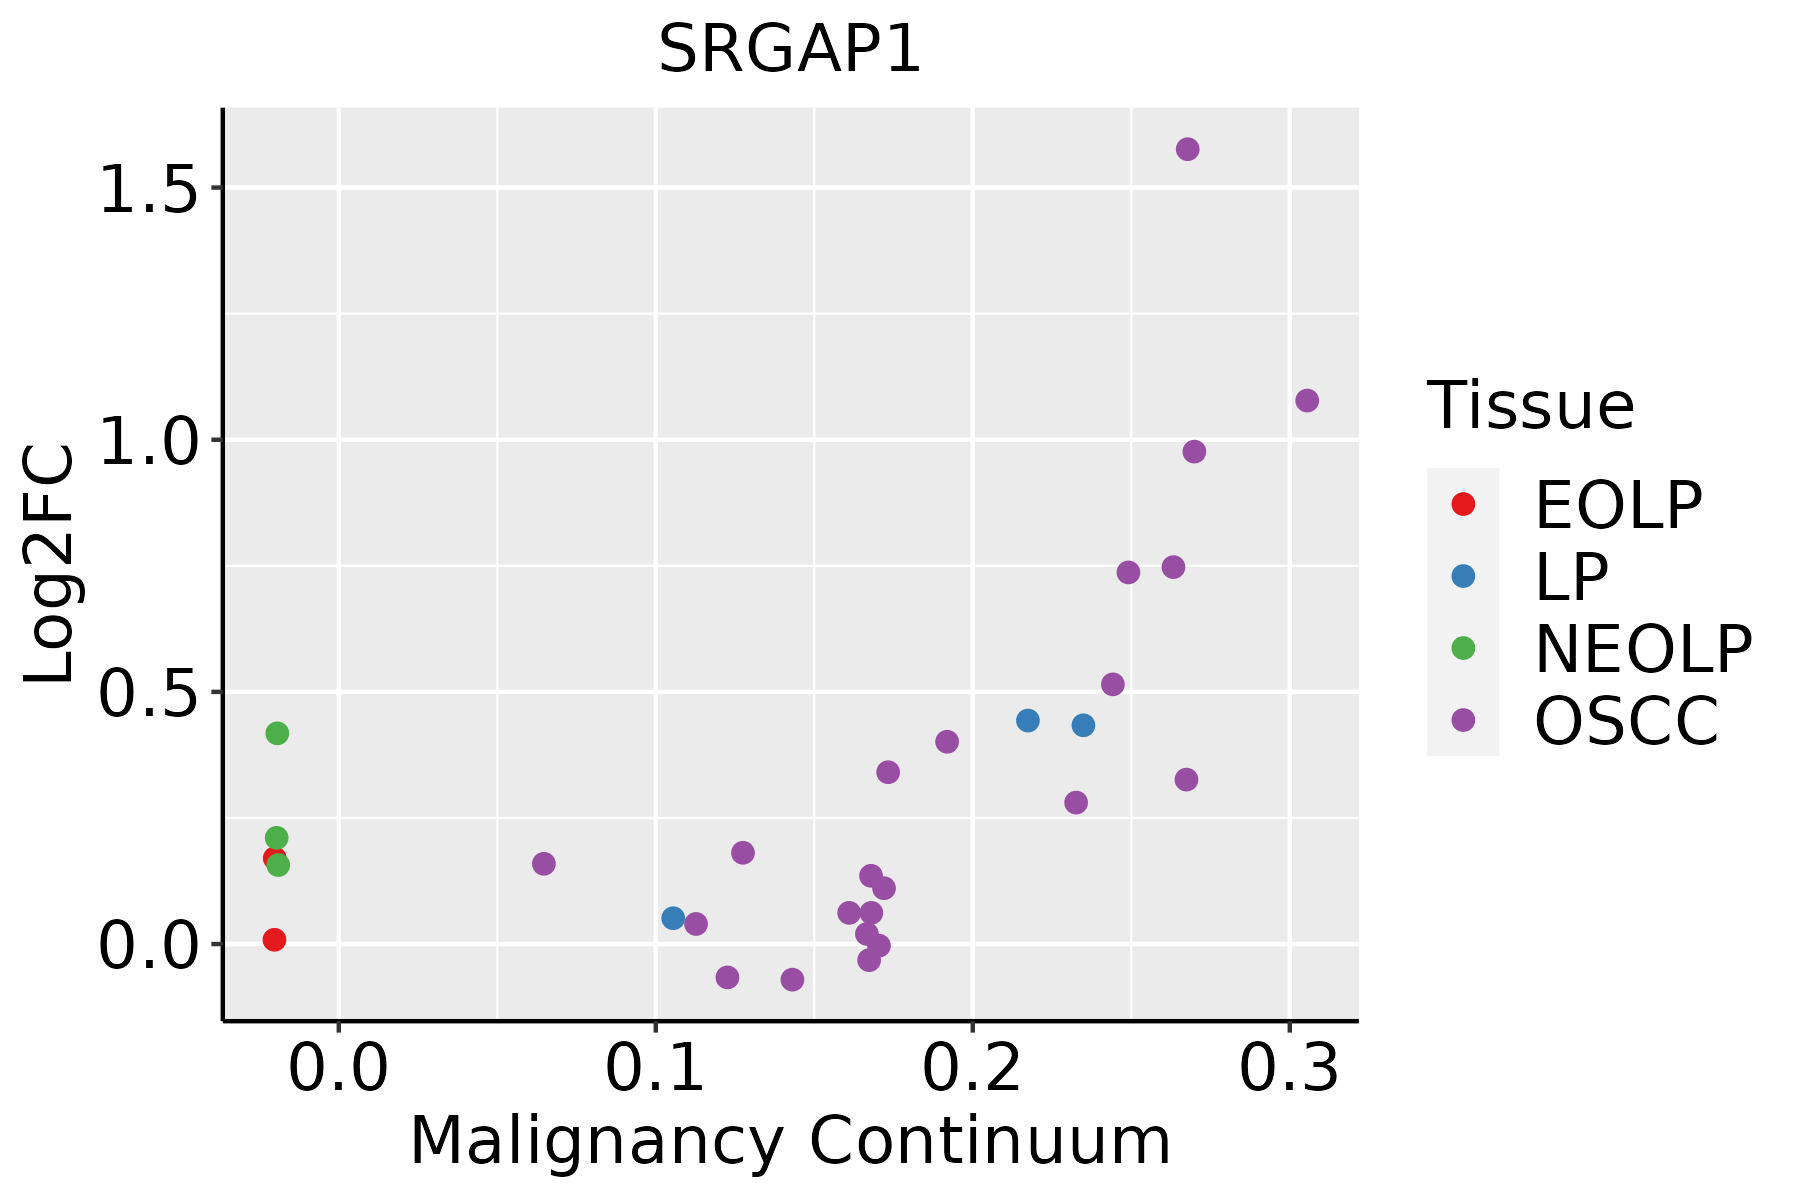 | EOLP: Erosive Oral lichen planus |
| LP: leukoplakia | ||
| NEOLP: Non-erosive oral lichen planus | ||
| OSCC: Oral squamous cell carcinoma | ||
| Prostate | 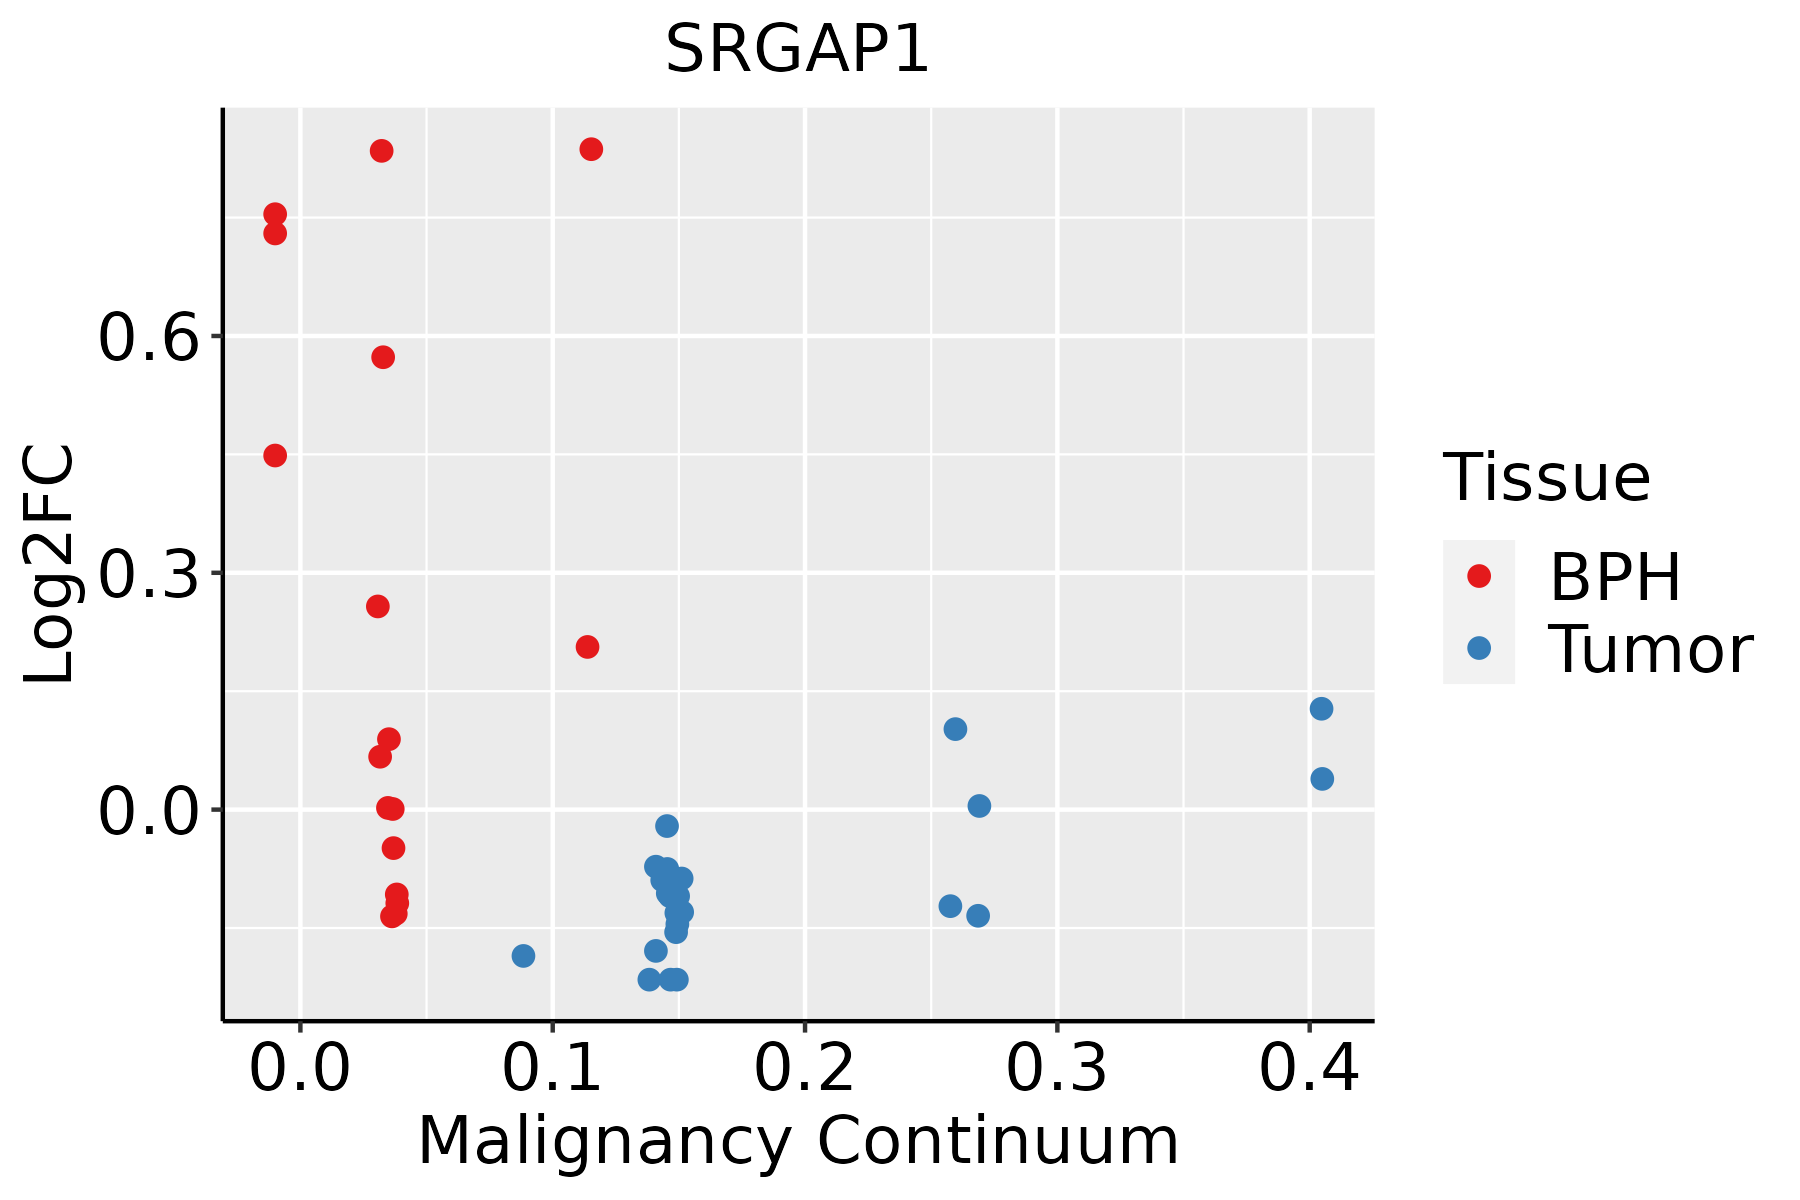 | BPH: Benign Prostatic Hyperplasia |
| Thyroid | 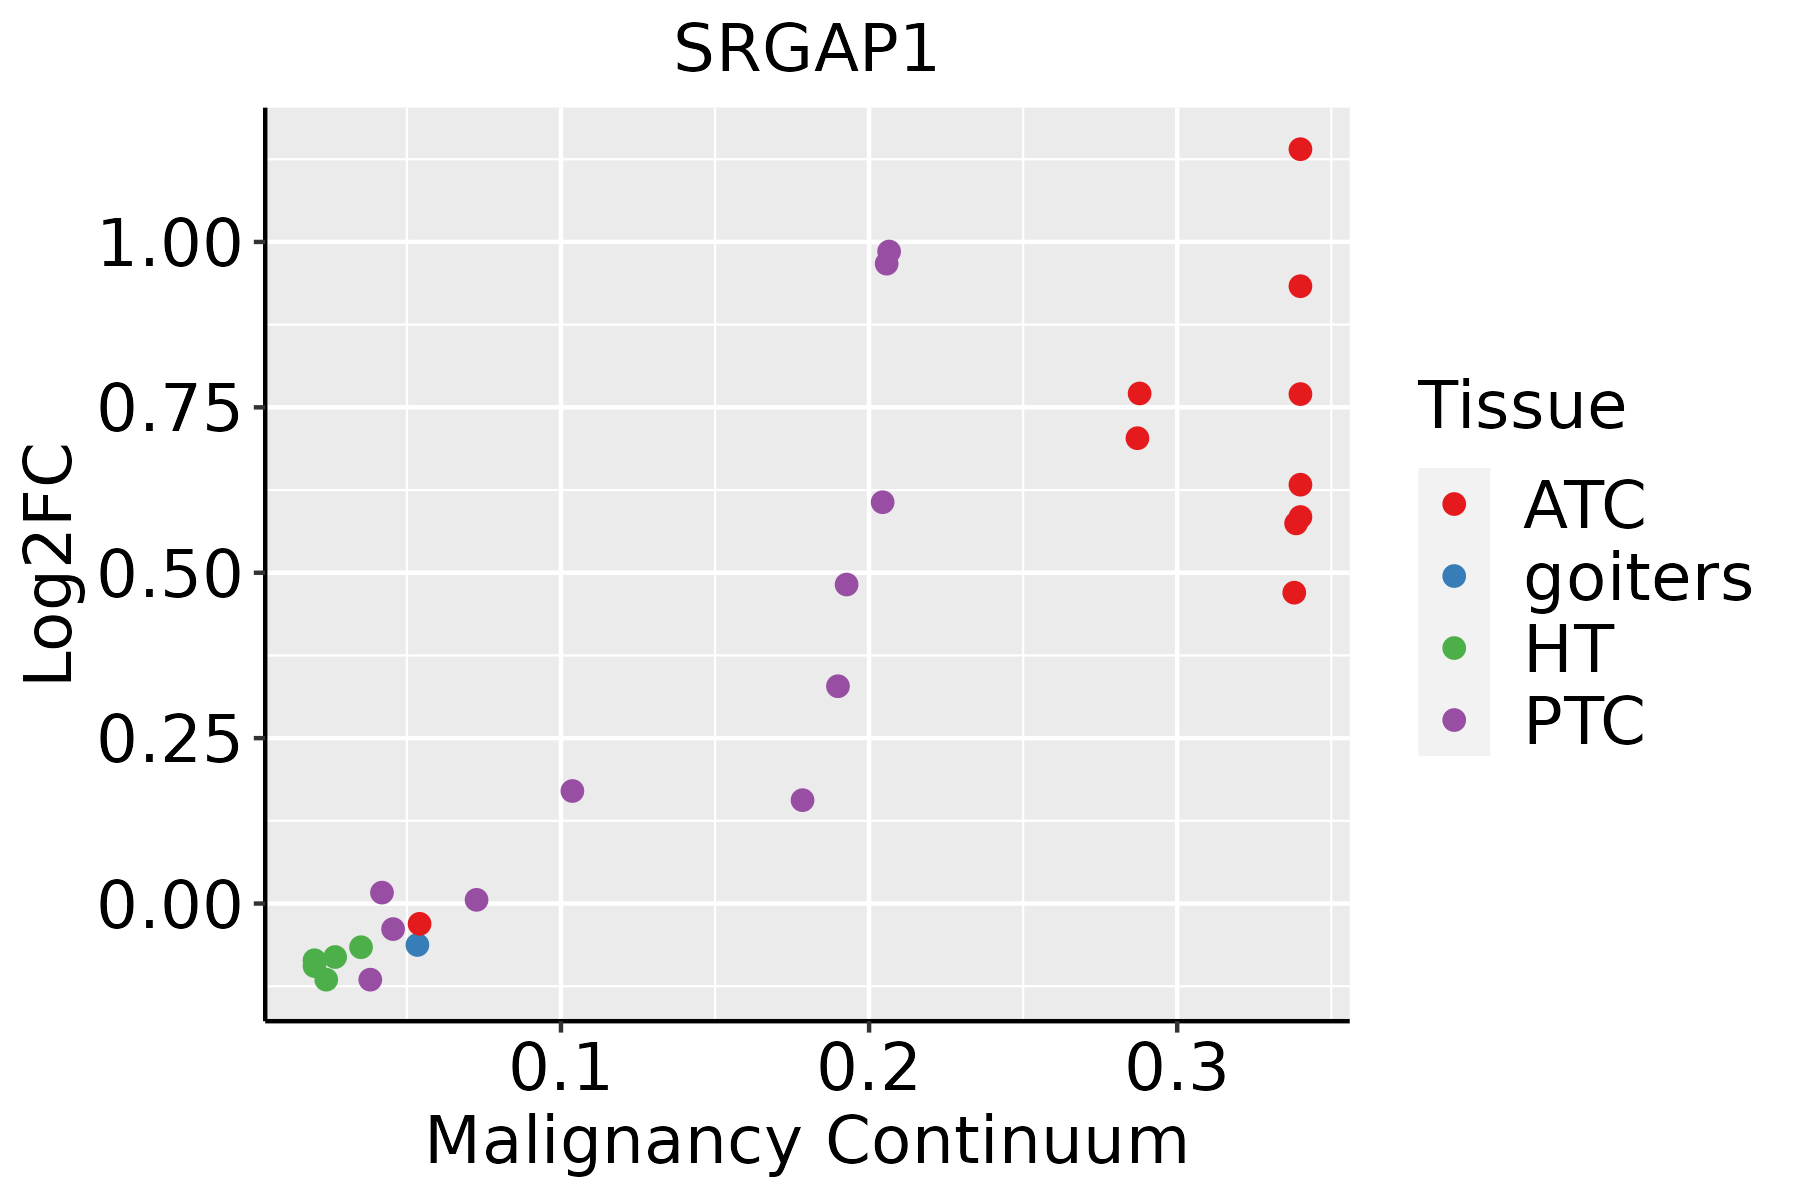 | ATC: Anaplastic thyroid cancer |
| HT: Hashimoto's thyroiditis | ||
| PTC: Papillary thyroid cancer |
| ∗log2FC in expression of this searched gene in stem-like cells from each diseased tissue sample relative to stem-like cells in normal samples in each tissue plotted against the malignancy continuum. Samples are colored based on if they are from different disease stage. |
Top |
Malignant transformation related pathway analysis |
| Find out the enriched GO biological processes and KEGG pathways involved in transition from healthy to precancer to cancer |
| Tissue | Disease Stage | Enriched GO biological Processes |
| Colorectum | AD |  |
| Colorectum | SER |  |
| Colorectum | MSS |  |
| Colorectum | MSI-H |  |
| Colorectum | FAP |  |
| ∗Top 15 enriched GO BP terms are showed in the bar plot of each disease state in each tissue. Each row represents a significant GO biological process which is colored according to the -log10(p.adjust). |
| Page: 1 2 3 4 5 6 7 8 9 |
| GO ID | Tissue | Disease Stage | Description | Gene Ratio | Bg Ratio | pvalue | p.adjust | Count |
| GO:00512713 | Cervix | CC | negative regulation of cellular component movement | 73/2311 | 367/18723 | 2.22e-05 | 3.95e-04 | 73 |
| GO:00400133 | Cervix | CC | negative regulation of locomotion | 76/2311 | 391/18723 | 3.47e-05 | 5.60e-04 | 76 |
| GO:20001463 | Cervix | CC | negative regulation of cell motility | 71/2311 | 359/18723 | 3.47e-05 | 5.60e-04 | 71 |
| GO:00303363 | Cervix | CC | negative regulation of cell migration | 68/2311 | 344/18723 | 5.11e-05 | 7.70e-04 | 68 |
| GO:00303364 | Endometrium | AEH | negative regulation of cell migration | 65/2100 | 344/18723 | 1.65e-05 | 3.42e-04 | 65 |
| GO:20001464 | Endometrium | AEH | negative regulation of cell motility | 67/2100 | 359/18723 | 1.86e-05 | 3.77e-04 | 67 |
| GO:00512714 | Endometrium | AEH | negative regulation of cellular component movement | 68/2100 | 367/18723 | 2.06e-05 | 4.11e-04 | 68 |
| GO:00400134 | Endometrium | AEH | negative regulation of locomotion | 70/2100 | 391/18723 | 4.95e-05 | 8.05e-04 | 70 |
| GO:200014613 | Endometrium | EEC | negative regulation of cell motility | 71/2168 | 359/18723 | 3.98e-06 | 1.04e-04 | 71 |
| GO:005127113 | Endometrium | EEC | negative regulation of cellular component movement | 72/2168 | 367/18723 | 4.59e-06 | 1.15e-04 | 72 |
| GO:003033612 | Endometrium | EEC | negative regulation of cell migration | 67/2168 | 344/18723 | 1.24e-05 | 2.54e-04 | 67 |
| GO:004001312 | Endometrium | EEC | negative regulation of locomotion | 74/2168 | 391/18723 | 1.28e-05 | 2.59e-04 | 74 |
| GO:00303366 | Oral cavity | EOLP | negative regulation of cell migration | 64/2218 | 344/18723 | 1.57e-04 | 1.67e-03 | 64 |
| GO:00512716 | Oral cavity | EOLP | negative regulation of cellular component movement | 67/2218 | 367/18723 | 1.97e-04 | 2.00e-03 | 67 |
| GO:20001466 | Oral cavity | EOLP | negative regulation of cell motility | 65/2218 | 359/18723 | 3.09e-04 | 2.89e-03 | 65 |
| GO:00400136 | Oral cavity | EOLP | negative regulation of locomotion | 67/2218 | 391/18723 | 1.17e-03 | 8.47e-03 | 67 |
| GO:005127115 | Oral cavity | NEOLP | negative regulation of cellular component movement | 70/2005 | 367/18723 | 1.10e-06 | 2.90e-05 | 70 |
| GO:200014615 | Oral cavity | NEOLP | negative regulation of cell motility | 68/2005 | 359/18723 | 2.01e-06 | 4.77e-05 | 68 |
| GO:003033614 | Oral cavity | NEOLP | negative regulation of cell migration | 65/2005 | 344/18723 | 3.65e-06 | 7.97e-05 | 65 |
| GO:004001314 | Oral cavity | NEOLP | negative regulation of locomotion | 69/2005 | 391/18723 | 2.05e-05 | 3.41e-04 | 69 |
| Page: 1 2 |
| Pathway ID | Tissue | Disease Stage | Description | Gene Ratio | Bg Ratio | pvalue | p.adjust | qvalue | Count |
| hsa043609 | Cervix | CC | Axon guidance | 47/1267 | 182/8465 | 8.13e-05 | 5.38e-04 | 3.18e-04 | 47 |
| hsa0436012 | Cervix | CC | Axon guidance | 47/1267 | 182/8465 | 8.13e-05 | 5.38e-04 | 3.18e-04 | 47 |
| hsa04360 | Colorectum | AD | Axon guidance | 61/2092 | 182/8465 | 4.36e-03 | 2.17e-02 | 1.38e-02 | 61 |
| hsa043601 | Colorectum | AD | Axon guidance | 61/2092 | 182/8465 | 4.36e-03 | 2.17e-02 | 1.38e-02 | 61 |
| hsa043602 | Colorectum | MSS | Axon guidance | 54/1875 | 182/8465 | 1.03e-02 | 3.69e-02 | 2.26e-02 | 54 |
| hsa043603 | Colorectum | MSS | Axon guidance | 54/1875 | 182/8465 | 1.03e-02 | 3.69e-02 | 2.26e-02 | 54 |
| hsa043604 | Colorectum | FAP | Axon guidance | 47/1404 | 182/8465 | 9.09e-04 | 5.20e-03 | 3.16e-03 | 47 |
| hsa043605 | Colorectum | FAP | Axon guidance | 47/1404 | 182/8465 | 9.09e-04 | 5.20e-03 | 3.16e-03 | 47 |
| hsa043606 | Colorectum | CRC | Axon guidance | 43/1091 | 182/8465 | 4.38e-05 | 8.70e-04 | 5.90e-04 | 43 |
| hsa043607 | Colorectum | CRC | Axon guidance | 43/1091 | 182/8465 | 4.38e-05 | 8.70e-04 | 5.90e-04 | 43 |
| hsa0436010 | Endometrium | AEH | Axon guidance | 39/1197 | 182/8465 | 4.47e-03 | 2.46e-02 | 1.80e-02 | 39 |
| hsa0436013 | Endometrium | AEH | Axon guidance | 39/1197 | 182/8465 | 4.47e-03 | 2.46e-02 | 1.80e-02 | 39 |
| hsa0436022 | Endometrium | EEC | Axon guidance | 39/1237 | 182/8465 | 7.78e-03 | 3.66e-02 | 2.73e-02 | 39 |
| hsa0436032 | Endometrium | EEC | Axon guidance | 39/1237 | 182/8465 | 7.78e-03 | 3.66e-02 | 2.73e-02 | 39 |
| hsa0436016 | Esophagus | ESCC | Axon guidance | 108/4205 | 182/8465 | 5.13e-03 | 1.30e-02 | 6.67e-03 | 108 |
| hsa0436017 | Esophagus | ESCC | Axon guidance | 108/4205 | 182/8465 | 5.13e-03 | 1.30e-02 | 6.67e-03 | 108 |
| hsa0436014 | Oral cavity | OSCC | Axon guidance | 97/3704 | 182/8465 | 5.59e-03 | 1.33e-02 | 6.76e-03 | 97 |
| hsa0436015 | Oral cavity | OSCC | Axon guidance | 97/3704 | 182/8465 | 5.59e-03 | 1.33e-02 | 6.76e-03 | 97 |
| hsa0436023 | Oral cavity | EOLP | Axon guidance | 38/1218 | 182/8465 | 1.02e-02 | 2.80e-02 | 1.65e-02 | 38 |
| hsa0436033 | Oral cavity | EOLP | Axon guidance | 38/1218 | 182/8465 | 1.02e-02 | 2.80e-02 | 1.65e-02 | 38 |
| Page: 1 2 |
Top |
Cell-cell communication analysis |
| Identification of potential cell-cell interactions between two cell types and their ligand-receptor pairs for different disease states |
| Ligand | Receptor | LRpair | Pathway | Tissue | Disease Stage |
| Page: 1 |
Top |
Single-cell gene regulatory network inference analysis |
| Find out the significant the regulons (TFs) and the target genes of each regulon across cell types for different disease states |
| TF | Cell Type | Tissue | Disease Stage | Target Gene | RSS | Regulon Activity |
| ∗The dot plots of a searched regulon are shown for all cell subpopulations in each disease state of each tissue based on the regulon specific score inferred using pySCENIC and by calculating the average expression. |
| Page: 1 |
Top |
Somatic mutation of malignant transformation related genes |
| Annotation of somatic variants for genes involved in malignant transformation |
| Hugo Symbol | Variant Class | Variant Classification | dbSNP RS | HGVSc | HGVSp | HGVSp Short | SWISSPROT | BIOTYPE | SIFT | PolyPhen | Tumor Sample Barcode | Tissue | Histology | Sex | Age | Stage | Therapy Types | Drugs | Outcome |
| SRGAP1 | SNV | Missense_Mutation | rs371057876 | c.1583G>A | p.Arg528Gln | p.R528Q | Q7Z6B7 | protein_coding | deleterious(0.01) | probably_damaging(0.955) | TCGA-A7-A26F-01 | Breast | breast invasive carcinoma | Female | <65 | I/II | Chemotherapy | taxotere | SD |
| SRGAP1 | SNV | Missense_Mutation | rs144647166 | c.2516G>A | p.Arg839His | p.R839H | Q7Z6B7 | protein_coding | tolerated(0.45) | benign(0.003) | TCGA-A7-A4SB-01 | Breast | breast invasive carcinoma | Female | <65 | III/IV | Chemotherapy | docetaxel | CR |
| SRGAP1 | SNV | Missense_Mutation | c.1570N>A | p.Glu524Lys | p.E524K | Q7Z6B7 | protein_coding | tolerated(0.08) | possibly_damaging(0.908) | TCGA-A8-A06Q-01 | Breast | breast invasive carcinoma | Female | <65 | III/IV | Unknown | Unknown | SD | |
| SRGAP1 | SNV | Missense_Mutation | rs758022220 | c.2270G>A | p.Arg757Gln | p.R757Q | Q7Z6B7 | protein_coding | deleterious(0.02) | probably_damaging(0.994) | TCGA-A8-A076-01 | Breast | breast invasive carcinoma | Female | >=65 | I/II | Hormone Therapy | anastrozole | SD |
| SRGAP1 | SNV | Missense_Mutation | c.88N>A | p.Glu30Lys | p.E30K | Q7Z6B7 | protein_coding | deleterious(0) | probably_damaging(0.992) | TCGA-AC-A23H-01 | Breast | breast invasive carcinoma | Female | >=65 | I/II | Unknown | Unknown | PD | |
| SRGAP1 | SNV | Missense_Mutation | c.202N>C | p.Glu68Gln | p.E68Q | Q7Z6B7 | protein_coding | deleterious(0) | probably_damaging(0.986) | TCGA-AC-A23H-01 | Breast | breast invasive carcinoma | Female | >=65 | I/II | Unknown | Unknown | PD | |
| SRGAP1 | SNV | Missense_Mutation | novel | c.954N>A | p.Phe318Leu | p.F318L | Q7Z6B7 | protein_coding | tolerated(1) | benign(0.02) | TCGA-AN-A046-01 | Breast | breast invasive carcinoma | Female | >=65 | I/II | Unknown | Unknown | SD |
| SRGAP1 | SNV | Missense_Mutation | rs373227457 | c.2731C>T | p.Arg911Cys | p.R911C | Q7Z6B7 | protein_coding | deleterious_low_confidence(0.01) | possibly_damaging(0.794) | TCGA-AN-A0AK-01 | Breast | breast invasive carcinoma | Female | >=65 | I/II | Unknown | Unknown | SD |
| SRGAP1 | SNV | Missense_Mutation | c.1831N>C | p.Glu611Gln | p.E611Q | Q7Z6B7 | protein_coding | deleterious(0.02) | probably_damaging(0.93) | TCGA-B6-A0IJ-01 | Breast | breast invasive carcinoma | Female | <65 | I/II | Unknown | Unknown | SD | |
| SRGAP1 | SNV | Missense_Mutation | c.3061G>C | p.Glu1021Gln | p.E1021Q | Q7Z6B7 | protein_coding | tolerated_low_confidence(0.1) | benign(0.01) | TCGA-B6-A0WX-01 | Breast | breast invasive carcinoma | Female | <65 | III/IV | Unknown | Unknown | PD |
| Page: 1 2 3 4 5 6 7 8 9 10 11 12 13 14 15 |
Top |
Related drugs of malignant transformation related genes |
| Identification of chemicals and drugs interact with genes involved in malignant transfromation |
| (DGIdb 4.0) |
| Entrez ID | Symbol | Category | Interaction Types | Drug Claim Name | Drug Name | PMIDs |
| Page: 1 |

Copyright 2023-Present -The University of Texas Health Science Center at Houston |