
|
|||||
|
 | |
| |
| |
| |
| |
| |
|
Gene: SRF |
Gene summary for SRF |
| Gene information | Species | Human | Gene symbol | SRF | Gene ID | 6722 |
| Gene name | serum response factor | |
| Gene Alias | MCM1 | |
| Cytomap | 6p21.1 | |
| Gene Type | protein-coding | GO ID | GO:0000122 | UniProtAcc | B4DU24 |
Top |
Malignant transformation analysis |
| Identification of the aberrant gene expression in precancerous and cancerous lesions by comparing the gene expression of stem-like cells in diseased tissues with normal stem cells |
| Entrez ID | Symbol | Replicates | Species | Organ | Tissue | Adj P-value | Log2FC | Malignancy |
| 6722 | SRF | HTA11_1938_2000001011 | Human | Colorectum | AD | 1.08e-04 | 3.42e-01 | -0.0811 |
| 6722 | SRF | HTA11_696_2000001011 | Human | Colorectum | AD | 7.01e-05 | 2.10e-01 | -0.1464 |
| 6722 | SRF | HTA11_1391_2000001011 | Human | Colorectum | AD | 6.39e-10 | 3.69e-01 | -0.059 |
| 6722 | SRF | HTA11_866_3004761011 | Human | Colorectum | AD | 3.51e-03 | 2.42e-01 | 0.096 |
| 6722 | SRF | HTA11_7696_3000711011 | Human | Colorectum | AD | 3.53e-07 | 2.32e-01 | 0.0674 |
| 6722 | SRF | HTA11_99999970781_79442 | Human | Colorectum | MSS | 8.59e-15 | 4.12e-01 | 0.294 |
| 6722 | SRF | HTA11_99999971662_82457 | Human | Colorectum | MSS | 3.38e-24 | 5.53e-01 | 0.3859 |
| 6722 | SRF | HTA11_99999973899_84307 | Human | Colorectum | MSS | 2.97e-09 | 4.77e-01 | 0.2585 |
| 6722 | SRF | HTA11_99999974143_84620 | Human | Colorectum | MSS | 1.10e-04 | 1.99e-01 | 0.3005 |
| 6722 | SRF | LZE8T | Human | Esophagus | ESCC | 1.64e-04 | 4.89e-02 | 0.067 |
| 6722 | SRF | LZE20T | Human | Esophagus | ESCC | 2.83e-02 | -4.23e-02 | 0.0662 |
| 6722 | SRF | LZE24T | Human | Esophagus | ESCC | 8.90e-06 | 2.54e-01 | 0.0596 |
| 6722 | SRF | P2T-E | Human | Esophagus | ESCC | 4.47e-11 | 9.40e-02 | 0.1177 |
| 6722 | SRF | P4T-E | Human | Esophagus | ESCC | 6.97e-14 | 2.19e-01 | 0.1323 |
| 6722 | SRF | P5T-E | Human | Esophagus | ESCC | 2.95e-12 | 9.77e-02 | 0.1327 |
| 6722 | SRF | P8T-E | Human | Esophagus | ESCC | 7.41e-05 | 3.32e-02 | 0.0889 |
| 6722 | SRF | P9T-E | Human | Esophagus | ESCC | 1.03e-09 | 1.76e-02 | 0.1131 |
| 6722 | SRF | P10T-E | Human | Esophagus | ESCC | 5.36e-14 | 1.43e-01 | 0.116 |
| 6722 | SRF | P11T-E | Human | Esophagus | ESCC | 5.84e-06 | 3.81e-02 | 0.1426 |
| 6722 | SRF | P12T-E | Human | Esophagus | ESCC | 4.59e-14 | 1.82e-02 | 0.1122 |
| Page: 1 2 3 4 5 6 |
| Tissue | Expression Dynamics | Abbreviation |
| Colorectum (GSE201348) |  | FAP: Familial adenomatous polyposis |
| CRC: Colorectal cancer | ||
| Colorectum (HTA11) |  | AD: Adenomas |
| SER: Sessile serrated lesions | ||
| MSI-H: Microsatellite-high colorectal cancer | ||
| MSS: Microsatellite stable colorectal cancer | ||
| Esophagus |  | ESCC: Esophageal squamous cell carcinoma |
| HGIN: High-grade intraepithelial neoplasias | ||
| LGIN: Low-grade intraepithelial neoplasias | ||
| Liver | 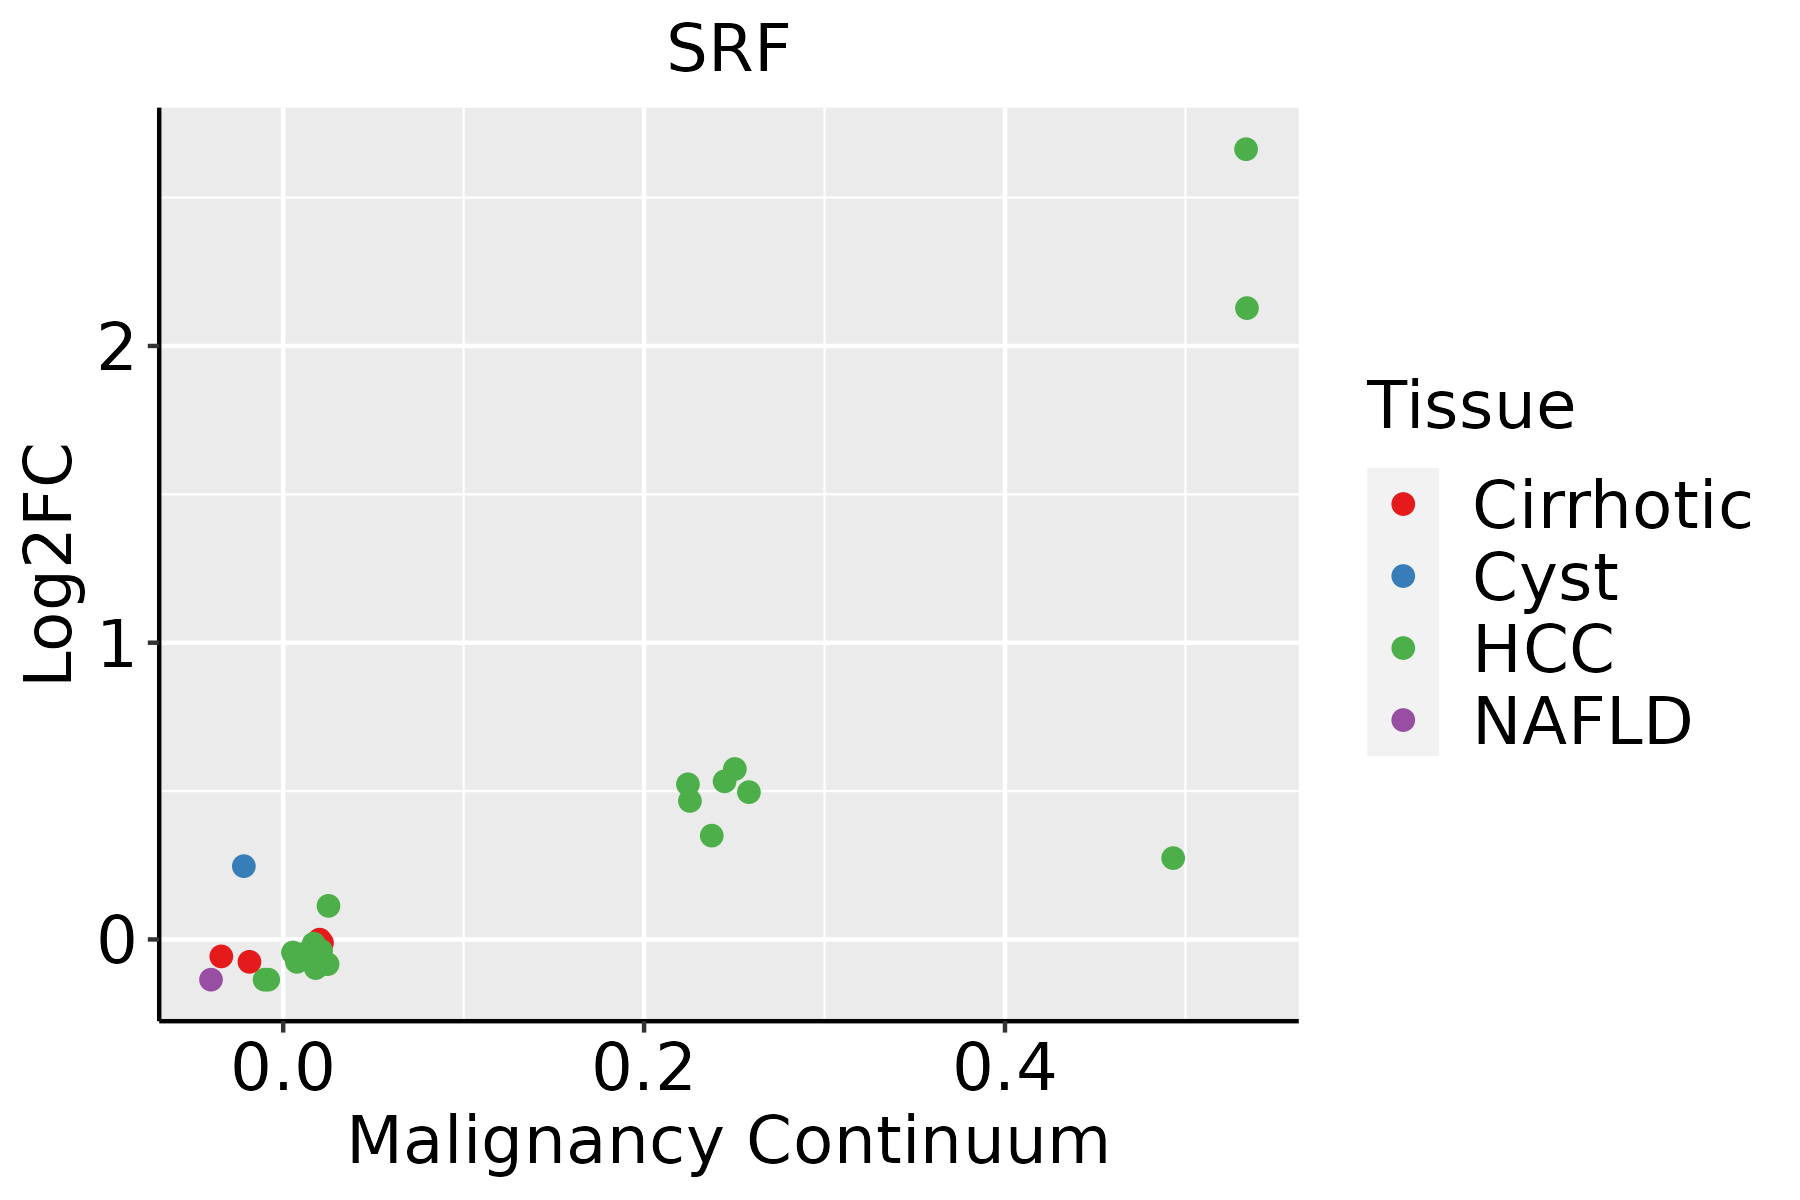 | HCC: Hepatocellular carcinoma |
| NAFLD: Non-alcoholic fatty liver disease | ||
| Oral Cavity | 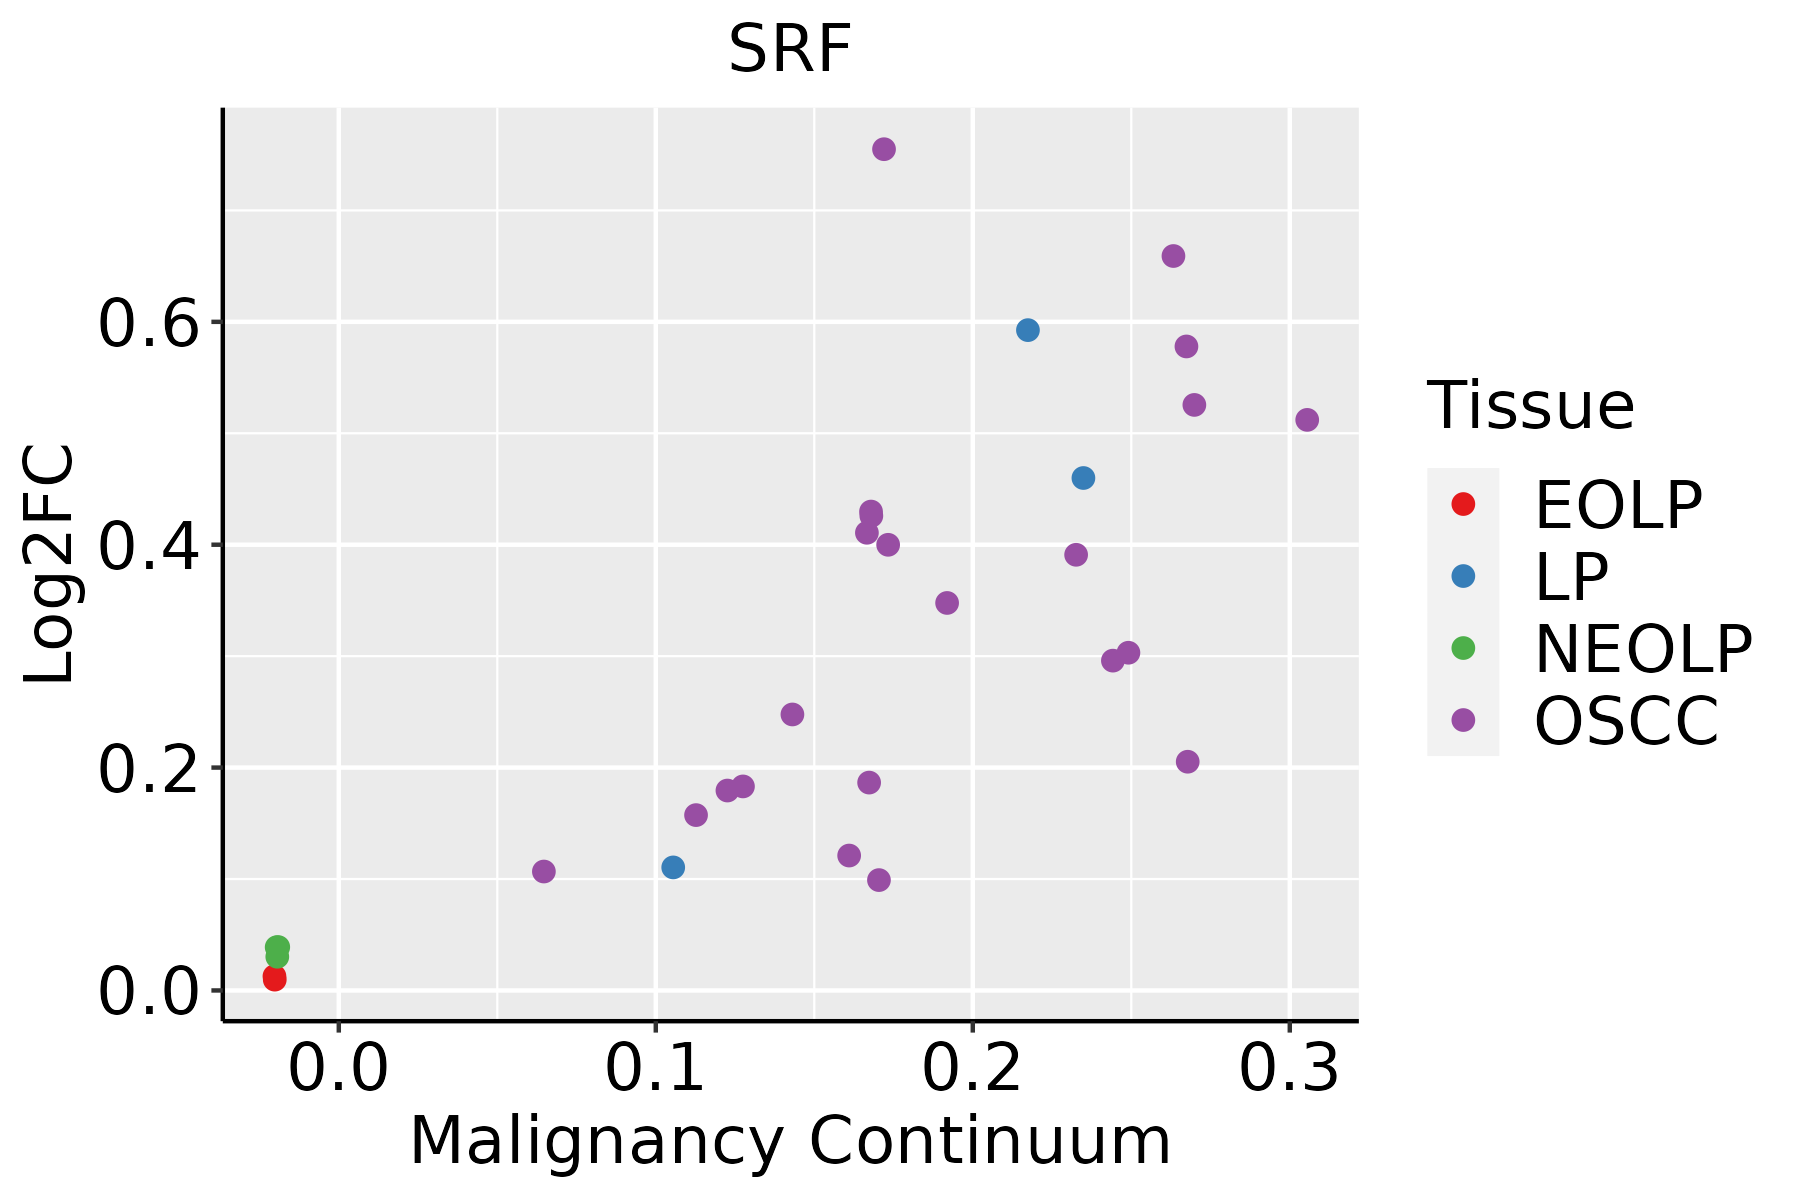 | EOLP: Erosive Oral lichen planus |
| LP: leukoplakia | ||
| NEOLP: Non-erosive oral lichen planus | ||
| OSCC: Oral squamous cell carcinoma | ||
| Thyroid | 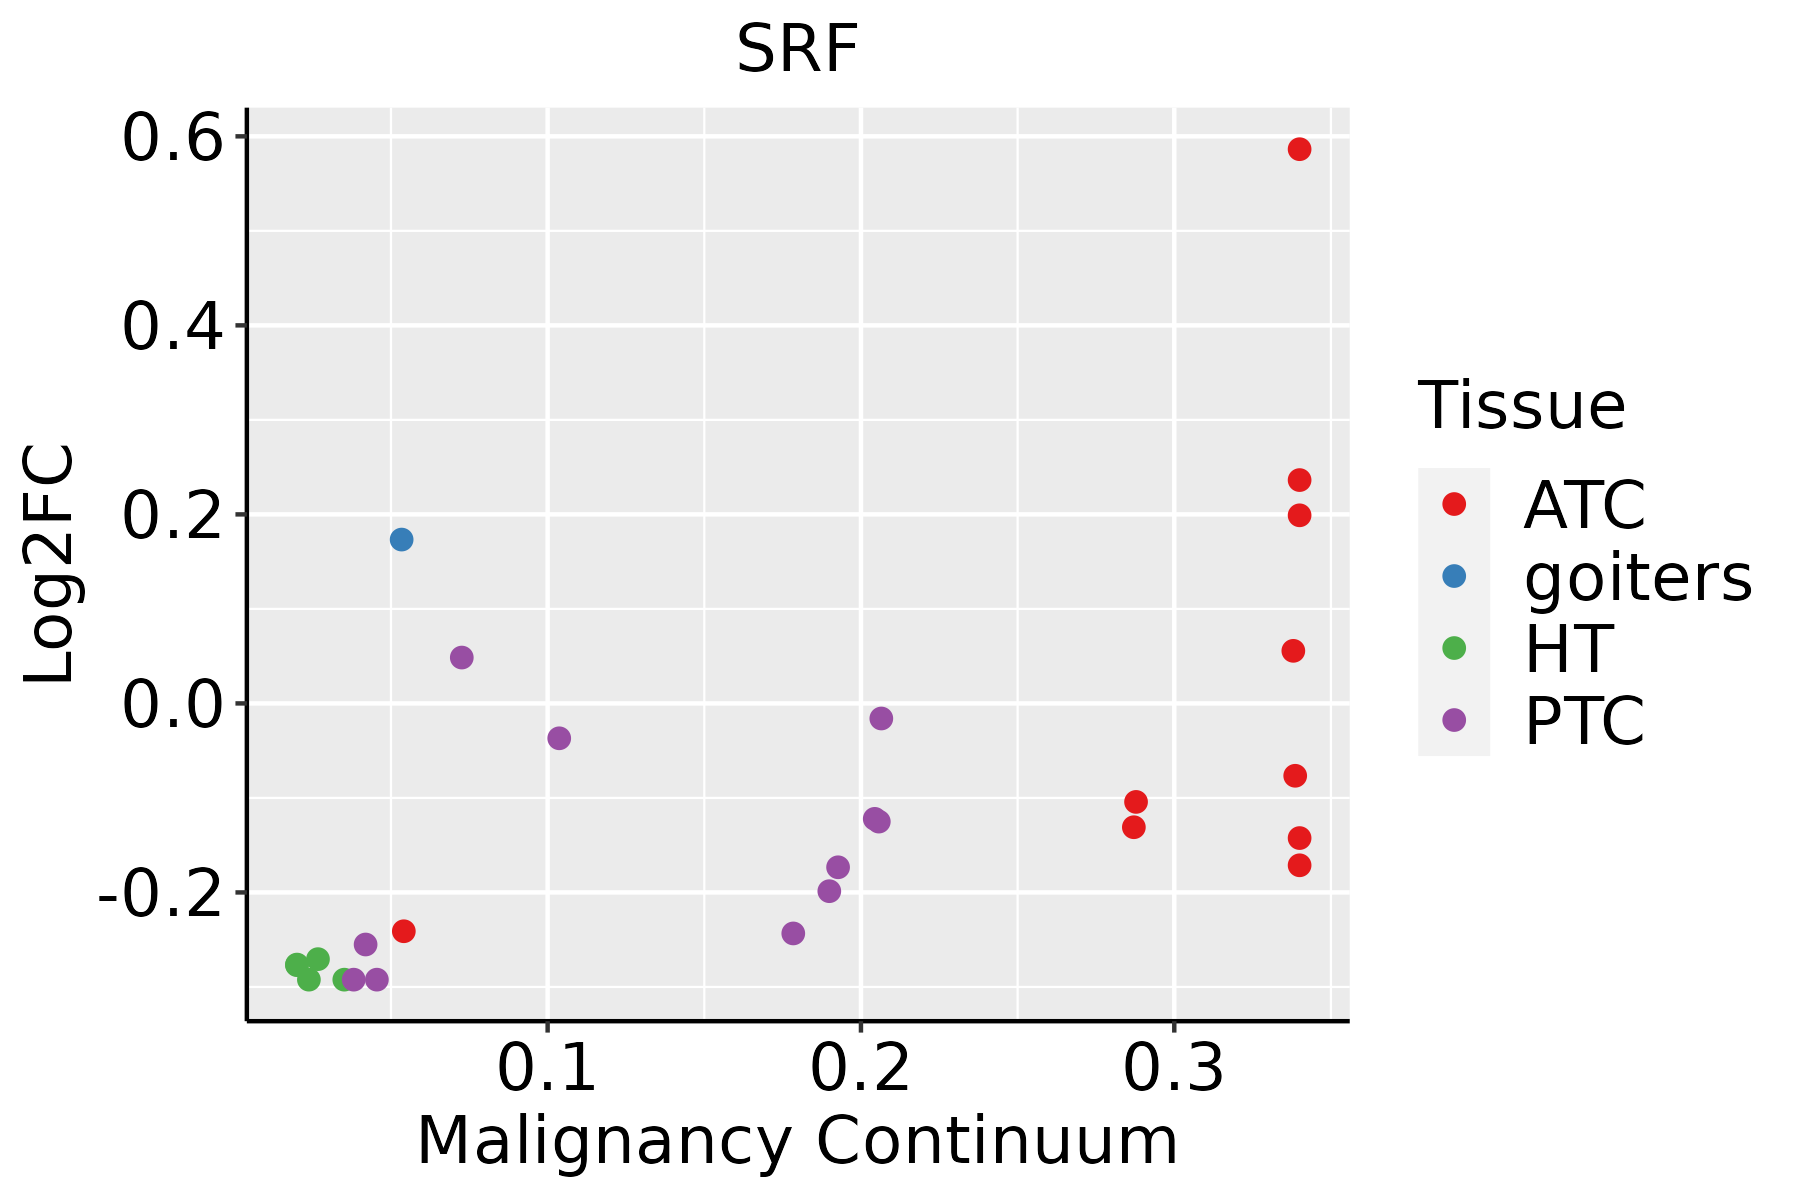 | ATC: Anaplastic thyroid cancer |
| HT: Hashimoto's thyroiditis | ||
| PTC: Papillary thyroid cancer |
| ∗log2FC in expression of this searched gene in stem-like cells from each diseased tissue sample relative to stem-like cells in normal samples in each tissue plotted against the malignancy continuum. Samples are colored based on if they are from different disease stage. |
Top |
Malignant transformation related pathway analysis |
| Find out the enriched GO biological processes and KEGG pathways involved in transition from healthy to precancer to cancer |
| Tissue | Disease Stage | Enriched GO biological Processes |
| Colorectum | AD |  |
| Colorectum | SER |  |
| Colorectum | MSS |  |
| Colorectum | MSI-H |  |
| Colorectum | FAP |  |
| ∗Top 15 enriched GO BP terms are showed in the bar plot of each disease state in each tissue. Each row represents a significant GO biological process which is colored according to the -log10(p.adjust). |
| Page: 1 2 3 4 5 6 7 8 9 |
| GO ID | Tissue | Disease Stage | Description | Gene Ratio | Bg Ratio | pvalue | p.adjust | Count |
| GO:0007015 | Colorectum | AD | actin filament organization | 167/3918 | 442/18723 | 1.65e-16 | 7.94e-14 | 167 |
| GO:0032535 | Colorectum | AD | regulation of cellular component size | 142/3918 | 383/18723 | 1.74e-13 | 3.41e-11 | 142 |
| GO:0048732 | Colorectum | AD | gland development | 149/3918 | 436/18723 | 6.07e-11 | 6.33e-09 | 149 |
| GO:0045216 | Colorectum | AD | cell-cell junction organization | 80/3918 | 200/18723 | 5.57e-10 | 4.58e-08 | 80 |
| GO:0034329 | Colorectum | AD | cell junction assembly | 136/3918 | 420/18723 | 2.02e-08 | 1.15e-06 | 136 |
| GO:0007043 | Colorectum | AD | cell-cell junction assembly | 57/3918 | 146/18723 | 4.18e-07 | 1.61e-05 | 57 |
| GO:0031589 | Colorectum | AD | cell-substrate adhesion | 116/3918 | 363/18723 | 4.68e-07 | 1.76e-05 | 116 |
| GO:0009743 | Colorectum | AD | response to carbohydrate | 86/3918 | 253/18723 | 8.43e-07 | 2.90e-05 | 86 |
| GO:0034101 | Colorectum | AD | erythrocyte homeostasis | 51/3918 | 129/18723 | 1.07e-06 | 3.59e-05 | 51 |
| GO:0009636 | Colorectum | AD | response to toxic substance | 88/3918 | 262/18723 | 1.12e-06 | 3.72e-05 | 88 |
| GO:0030099 | Colorectum | AD | myeloid cell differentiation | 119/3918 | 381/18723 | 1.24e-06 | 4.01e-05 | 119 |
| GO:0061572 | Colorectum | AD | actin filament bundle organization | 60/3918 | 161/18723 | 1.33e-06 | 4.23e-05 | 60 |
| GO:0042060 | Colorectum | AD | wound healing | 128/3918 | 422/18723 | 2.73e-06 | 7.89e-05 | 128 |
| GO:0051017 | Colorectum | AD | actin filament bundle assembly | 58/3918 | 157/18723 | 2.74e-06 | 7.89e-05 | 58 |
| GO:0016049 | Colorectum | AD | cell growth | 143/3918 | 482/18723 | 2.83e-06 | 8.09e-05 | 143 |
| GO:0034284 | Colorectum | AD | response to monosaccharide | 76/3918 | 225/18723 | 4.64e-06 | 1.23e-04 | 76 |
| GO:0043297 | Colorectum | AD | apical junction assembly | 34/3918 | 78/18723 | 5.31e-06 | 1.37e-04 | 34 |
| GO:0002262 | Colorectum | AD | myeloid cell homeostasis | 57/3918 | 157/18723 | 6.17e-06 | 1.56e-04 | 57 |
| GO:0001558 | Colorectum | AD | regulation of cell growth | 124/3918 | 414/18723 | 7.67e-06 | 1.86e-04 | 124 |
| GO:0033500 | Colorectum | AD | carbohydrate homeostasis | 84/3918 | 259/18723 | 9.10e-06 | 2.15e-04 | 84 |
| Page: 1 2 3 4 5 6 7 8 9 10 11 12 13 14 15 16 17 18 19 20 21 22 23 24 25 26 27 28 29 30 31 32 33 34 35 36 37 38 39 40 41 42 43 44 45 46 47 48 |
| Pathway ID | Tissue | Disease Stage | Description | Gene Ratio | Bg Ratio | pvalue | p.adjust | qvalue | Count |
| hsa05166 | Colorectum | AD | Human T-cell leukemia virus 1 infection | 72/2092 | 222/8465 | 5.24e-03 | 2.44e-02 | 1.55e-02 | 72 |
| hsa051661 | Colorectum | AD | Human T-cell leukemia virus 1 infection | 72/2092 | 222/8465 | 5.24e-03 | 2.44e-02 | 1.55e-02 | 72 |
| hsa051662 | Colorectum | MSS | Human T-cell leukemia virus 1 infection | 68/1875 | 222/8465 | 1.84e-03 | 9.61e-03 | 5.89e-03 | 68 |
| hsa04022 | Colorectum | MSS | cGMP-PKG signaling pathway | 51/1875 | 167/8465 | 6.83e-03 | 2.73e-02 | 1.67e-02 | 51 |
| hsa051663 | Colorectum | MSS | Human T-cell leukemia virus 1 infection | 68/1875 | 222/8465 | 1.84e-03 | 9.61e-03 | 5.89e-03 | 68 |
| hsa040221 | Colorectum | MSS | cGMP-PKG signaling pathway | 51/1875 | 167/8465 | 6.83e-03 | 2.73e-02 | 1.67e-02 | 51 |
| hsa05166211 | Esophagus | ESCC | Human T-cell leukemia virus 1 infection | 164/4205 | 222/8465 | 8.13e-14 | 2.09e-12 | 1.07e-12 | 164 |
| hsa0520325 | Esophagus | ESCC | Viral carcinogenesis | 137/4205 | 204/8465 | 2.47e-07 | 1.88e-06 | 9.62e-07 | 137 |
| hsa05166310 | Esophagus | ESCC | Human T-cell leukemia virus 1 infection | 164/4205 | 222/8465 | 8.13e-14 | 2.09e-12 | 1.07e-12 | 164 |
| hsa0520335 | Esophagus | ESCC | Viral carcinogenesis | 137/4205 | 204/8465 | 2.47e-07 | 1.88e-06 | 9.62e-07 | 137 |
| hsa0516622 | Liver | HCC | Human T-cell leukemia virus 1 infection | 139/4020 | 222/8465 | 3.17e-06 | 2.79e-05 | 1.55e-05 | 139 |
| hsa052032 | Liver | HCC | Viral carcinogenesis | 117/4020 | 204/8465 | 2.68e-03 | 8.98e-03 | 5.00e-03 | 117 |
| hsa0516632 | Liver | HCC | Human T-cell leukemia virus 1 infection | 139/4020 | 222/8465 | 3.17e-06 | 2.79e-05 | 1.55e-05 | 139 |
| hsa052033 | Liver | HCC | Viral carcinogenesis | 117/4020 | 204/8465 | 2.68e-03 | 8.98e-03 | 5.00e-03 | 117 |
| hsa0516630 | Oral cavity | OSCC | Human T-cell leukemia virus 1 infection | 150/3704 | 222/8465 | 3.68e-13 | 7.26e-12 | 3.70e-12 | 150 |
| hsa052038 | Oral cavity | OSCC | Viral carcinogenesis | 124/3704 | 204/8465 | 5.57e-07 | 3.28e-06 | 1.67e-06 | 124 |
| hsa0401014 | Oral cavity | OSCC | MAPK signaling pathway | 165/3704 | 302/8465 | 7.11e-05 | 2.74e-04 | 1.40e-04 | 165 |
| hsa05166113 | Oral cavity | OSCC | Human T-cell leukemia virus 1 infection | 150/3704 | 222/8465 | 3.68e-13 | 7.26e-12 | 3.70e-12 | 150 |
| hsa0520314 | Oral cavity | OSCC | Viral carcinogenesis | 124/3704 | 204/8465 | 5.57e-07 | 3.28e-06 | 1.67e-06 | 124 |
| hsa0401015 | Oral cavity | OSCC | MAPK signaling pathway | 165/3704 | 302/8465 | 7.11e-05 | 2.74e-04 | 1.40e-04 | 165 |
| Page: 1 2 |
Top |
Cell-cell communication analysis |
| Identification of potential cell-cell interactions between two cell types and their ligand-receptor pairs for different disease states |
| Ligand | Receptor | LRpair | Pathway | Tissue | Disease Stage |
| Page: 1 |
Top |
Single-cell gene regulatory network inference analysis |
| Find out the significant the regulons (TFs) and the target genes of each regulon across cell types for different disease states |
| TF | Cell Type | Tissue | Disease Stage | Target Gene | RSS | Regulon Activity |
| SRF | STM | Thyroid | ADJ | TFCP2L1,AC016831.1,ST7-AS1, etc. | 5.35e-01 |  |
| SRF | STM | Thyroid | goiters | TFCP2L1,AC016831.1,ST7-AS1, etc. | 6.93e-01 |  |
| ∗The dot plots of a searched regulon are shown for all cell subpopulations in each disease state of each tissue based on the regulon specific score inferred using pySCENIC and by calculating the average expression. |
| Page: 1 |
Top |
Somatic mutation of malignant transformation related genes |
| Annotation of somatic variants for genes involved in malignant transformation |
| Hugo Symbol | Variant Class | Variant Classification | dbSNP RS | HGVSc | HGVSp | HGVSp Short | SWISSPROT | BIOTYPE | SIFT | PolyPhen | Tumor Sample Barcode | Tissue | Histology | Sex | Age | Stage | Therapy Types | Drugs | Outcome |
| SRF | SNV | Missense_Mutation | novel | c.1081C>G | p.Gln361Glu | p.Q361E | P11831 | protein_coding | deleterious(0) | possibly_damaging(0.9) | TCGA-AC-A23H-01 | Breast | breast invasive carcinoma | Female | >=65 | I/II | Unknown | Unknown | PD |
| SRF | SNV | Missense_Mutation | novel | c.627G>C | p.Glu209Asp | p.E209D | P11831 | protein_coding | tolerated(0.14) | benign(0.269) | TCGA-BH-A0BF-01 | Breast | breast invasive carcinoma | Female | <65 | I/II | Unknown | Unknown | SD |
| SRF | SNV | Missense_Mutation | novel | c.1313N>T | p.Pro438Leu | p.P438L | P11831 | protein_coding | deleterious(0) | benign(0.015) | TCGA-E9-A1RF-01 | Breast | breast invasive carcinoma | Female | >=65 | III/IV | Hormone Therapy | tamoxiphen | SD |
| SRF | SNV | Missense_Mutation | novel | c.857N>G | p.Ser286Cys | p.S286C | P11831 | protein_coding | deleterious(0) | possibly_damaging(0.781) | TCGA-C5-A1BQ-01 | Cervix | cervical & endocervical cancer | Female | >=65 | III/IV | Chemotherapy | cisplatin | CR |
| SRF | SNV | Missense_Mutation | novel | c.655C>A | p.Leu219Ile | p.L219I | P11831 | protein_coding | deleterious(0.01) | probably_damaging(0.998) | TCGA-AA-3949-01 | Colorectum | colon adenocarcinoma | Female | >=65 | III/IV | Unknown | Unknown | SD |
| SRF | SNV | Missense_Mutation | rs761821794 | c.1174N>A | p.Ala392Thr | p.A392T | P11831 | protein_coding | tolerated(0.12) | probably_damaging(0.985) | TCGA-AA-3984-01 | Colorectum | colon adenocarcinoma | Female | <65 | I/II | Unknown | Unknown | SD |
| SRF | SNV | Missense_Mutation | c.1036A>G | p.Met346Val | p.M346V | P11831 | protein_coding | tolerated(0.14) | possibly_damaging(0.878) | TCGA-AA-A01R-01 | Colorectum | colon adenocarcinoma | Male | <65 | III/IV | Chemotherapy | 5-fluorouracil | PD | |
| SRF | SNV | Missense_Mutation | c.1504N>A | p.Ala502Thr | p.A502T | P11831 | protein_coding | tolerated_low_confidence(0.76) | benign(0) | TCGA-CK-6746-01 | Colorectum | colon adenocarcinoma | Female | >=65 | I/II | Unknown | Unknown | SD | |
| SRF | SNV | Missense_Mutation | c.1328T>C | p.Val443Ala | p.V443A | P11831 | protein_coding | tolerated(0.1) | probably_damaging(0.956) | TCGA-NH-A5IV-01 | Colorectum | colon adenocarcinoma | Female | >=65 | I/II | Unknown | Unknown | SD | |
| SRF | SNV | Missense_Mutation | c.1097C>T | p.Pro366Leu | p.P366L | P11831 | protein_coding | tolerated(0.08) | benign(0.115) | TCGA-A5-A0G9-01 | Endometrium | uterine corpus endometrioid carcinoma | Female | >=65 | I/II | Unknown | Unknown | SD |
| Page: 1 2 3 |
Top |
Related drugs of malignant transformation related genes |
| Identification of chemicals and drugs interact with genes involved in malignant transfromation |
| (DGIdb 4.0) |
| Entrez ID | Symbol | Category | Interaction Types | Drug Claim Name | Drug Name | PMIDs |
| Page: 1 |

Copyright 2023-Present -The University of Texas Health Science Center at Houston |