
|
|||||
|
 | |
| |
| |
| |
| |
| |
|
Gene: SREK1IP1 |
Gene summary for SREK1IP1 |
| Gene information | Species | Human | Gene symbol | SREK1IP1 | Gene ID | 285672 |
| Gene name | SREK1 interacting protein 1 | |
| Gene Alias | P18SRP | |
| Cytomap | 5q12.3 | |
| Gene Type | protein-coding | GO ID | GO:0006139 | UniProtAcc | Q8N9Q2 |
Top |
Malignant transformation analysis |
| Identification of the aberrant gene expression in precancerous and cancerous lesions by comparing the gene expression of stem-like cells in diseased tissues with normal stem cells |
| Entrez ID | Symbol | Replicates | Species | Organ | Tissue | Adj P-value | Log2FC | Malignancy |
| 285672 | SREK1IP1 | LZE4T | Human | Esophagus | ESCC | 1.42e-05 | 1.63e-01 | 0.0811 |
| 285672 | SREK1IP1 | LZE5T | Human | Esophagus | ESCC | 1.22e-02 | -6.18e-03 | 0.0514 |
| 285672 | SREK1IP1 | LZE7T | Human | Esophagus | ESCC | 1.22e-03 | 3.60e-01 | 0.0667 |
| 285672 | SREK1IP1 | LZE8T | Human | Esophagus | ESCC | 9.84e-04 | -2.41e-04 | 0.067 |
| 285672 | SREK1IP1 | LZE20T | Human | Esophagus | ESCC | 6.04e-07 | 1.32e-01 | 0.0662 |
| 285672 | SREK1IP1 | LZE22D1 | Human | Esophagus | HGIN | 6.47e-07 | -3.05e-02 | 0.0595 |
| 285672 | SREK1IP1 | LZE22T | Human | Esophagus | ESCC | 4.66e-04 | -3.48e-02 | 0.068 |
| 285672 | SREK1IP1 | LZE24T | Human | Esophagus | ESCC | 2.84e-11 | 1.64e-01 | 0.0596 |
| 285672 | SREK1IP1 | LZE6T | Human | Esophagus | ESCC | 8.44e-06 | 1.91e-01 | 0.0845 |
| 285672 | SREK1IP1 | P1T-E | Human | Esophagus | ESCC | 1.93e-10 | 7.46e-01 | 0.0875 |
| 285672 | SREK1IP1 | P2T-E | Human | Esophagus | ESCC | 4.42e-17 | 3.88e-01 | 0.1177 |
| 285672 | SREK1IP1 | P4T-E | Human | Esophagus | ESCC | 7.96e-11 | 3.14e-01 | 0.1323 |
| 285672 | SREK1IP1 | P5T-E | Human | Esophagus | ESCC | 2.73e-14 | 2.64e-01 | 0.1327 |
| 285672 | SREK1IP1 | P8T-E | Human | Esophagus | ESCC | 2.99e-31 | 5.03e-01 | 0.0889 |
| 285672 | SREK1IP1 | P9T-E | Human | Esophagus | ESCC | 1.42e-16 | 4.88e-01 | 0.1131 |
| 285672 | SREK1IP1 | P10T-E | Human | Esophagus | ESCC | 4.88e-24 | 3.15e-01 | 0.116 |
| 285672 | SREK1IP1 | P11T-E | Human | Esophagus | ESCC | 4.17e-11 | 6.96e-01 | 0.1426 |
| 285672 | SREK1IP1 | P12T-E | Human | Esophagus | ESCC | 9.22e-22 | 4.85e-01 | 0.1122 |
| 285672 | SREK1IP1 | P15T-E | Human | Esophagus | ESCC | 8.44e-14 | 2.08e-01 | 0.1149 |
| 285672 | SREK1IP1 | P16T-E | Human | Esophagus | ESCC | 2.23e-16 | 1.54e-01 | 0.1153 |
| Page: 1 2 3 4 5 6 7 |
| Tissue | Expression Dynamics | Abbreviation |
| Esophagus |  | ESCC: Esophageal squamous cell carcinoma |
| HGIN: High-grade intraepithelial neoplasias | ||
| LGIN: Low-grade intraepithelial neoplasias | ||
| Liver |  | HCC: Hepatocellular carcinoma |
| NAFLD: Non-alcoholic fatty liver disease | ||
| Oral Cavity | 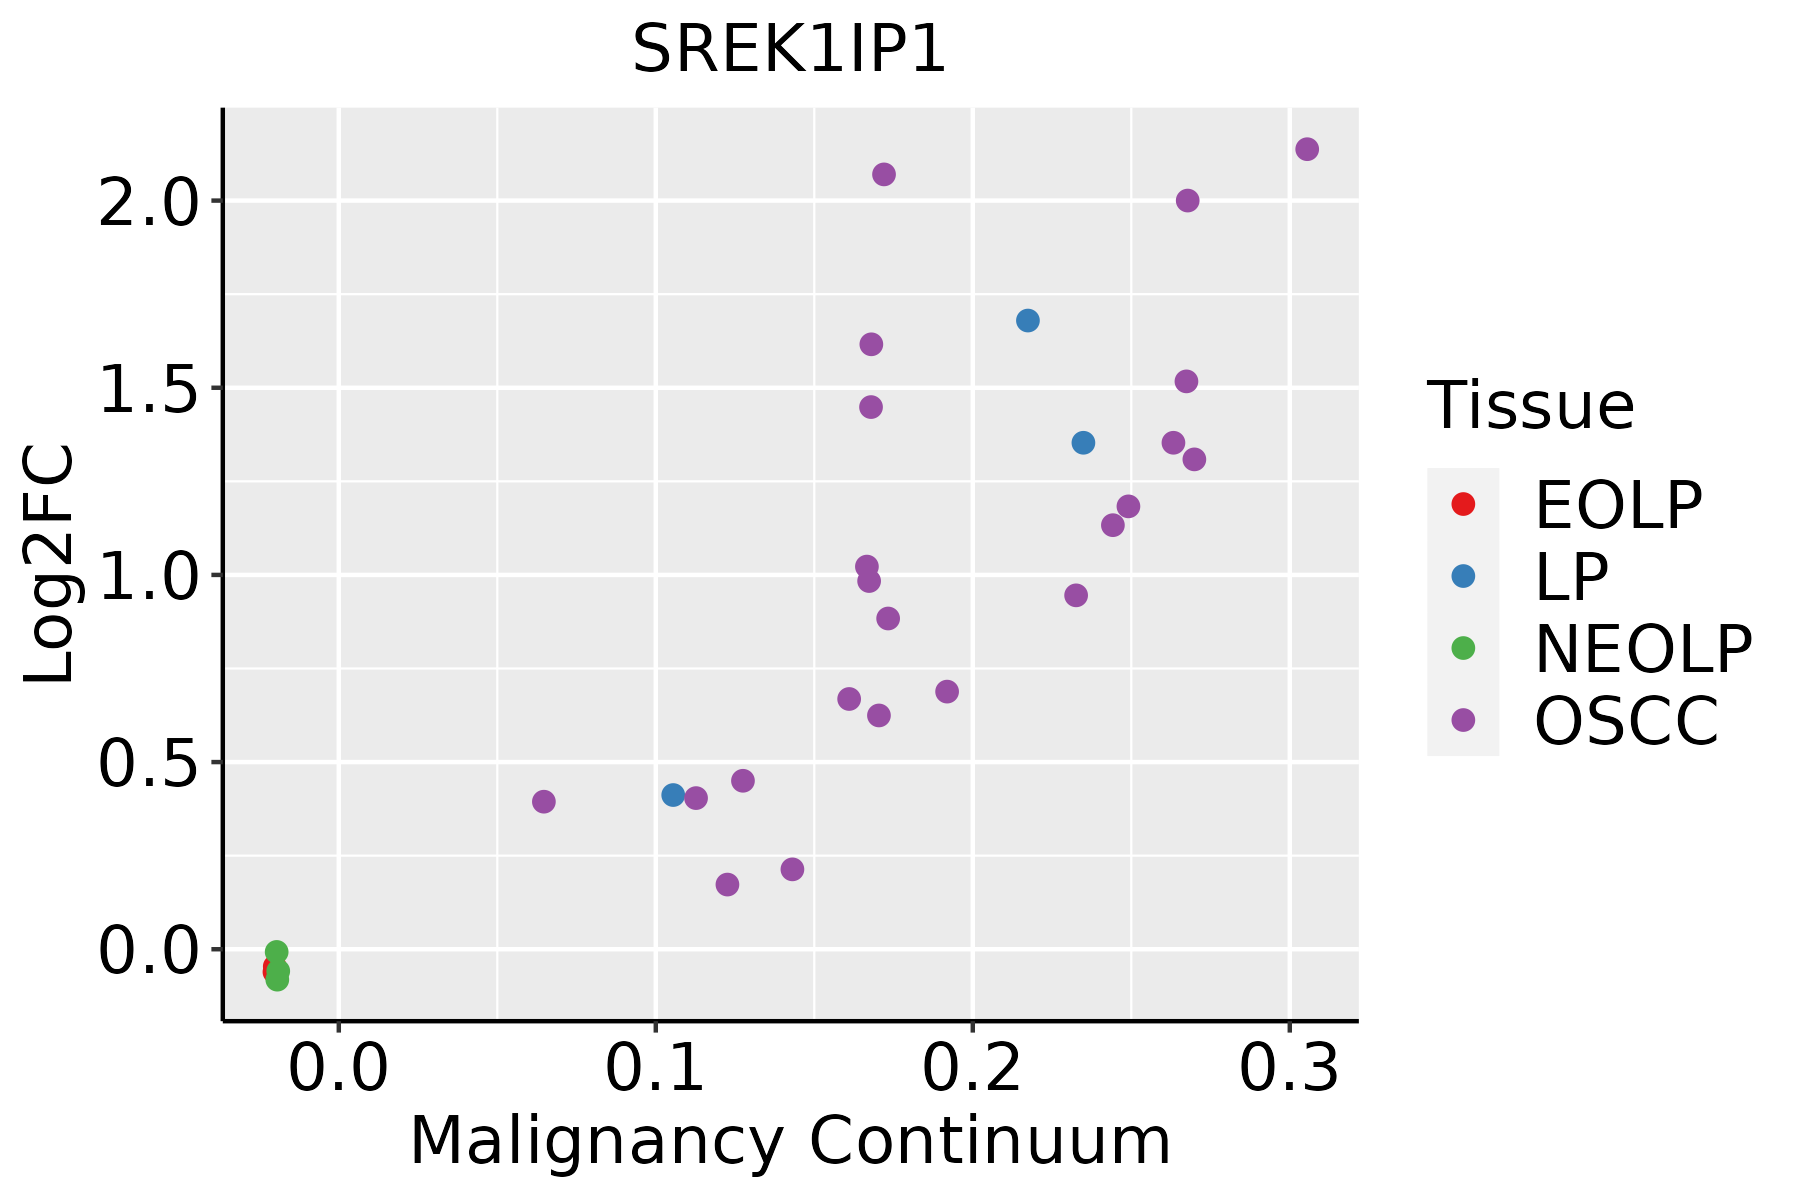 | EOLP: Erosive Oral lichen planus |
| LP: leukoplakia | ||
| NEOLP: Non-erosive oral lichen planus | ||
| OSCC: Oral squamous cell carcinoma | ||
| Skin |  | AK: Actinic keratosis |
| cSCC: Cutaneous squamous cell carcinoma | ||
| SCCIS:squamous cell carcinoma in situ | ||
| Thyroid |  | ATC: Anaplastic thyroid cancer |
| HT: Hashimoto's thyroiditis | ||
| PTC: Papillary thyroid cancer |
| ∗log2FC in expression of this searched gene in stem-like cells from each diseased tissue sample relative to stem-like cells in normal samples in each tissue plotted against the malignancy continuum. Samples are colored based on if they are from different disease stage. |
Top |
Malignant transformation related pathway analysis |
| Find out the enriched GO biological processes and KEGG pathways involved in transition from healthy to precancer to cancer |
| Tissue | Disease Stage | Enriched GO biological Processes |
| Colorectum | AD |  |
| Colorectum | SER |  |
| Colorectum | MSS |  |
| Colorectum | MSI-H |  |
| Colorectum | FAP |  |
| ∗Top 15 enriched GO BP terms are showed in the bar plot of each disease state in each tissue. Each row represents a significant GO biological process which is colored according to the -log10(p.adjust). |
| Page: 1 2 3 4 5 6 7 8 9 |
| GO ID | Tissue | Disease Stage | Description | Gene Ratio | Bg Ratio | pvalue | p.adjust | Count |
| GO:000838026 | Esophagus | HGIN | RNA splicing | 160/2587 | 434/18723 | 3.74e-34 | 1.12e-30 | 160 |
| GO:0008380111 | Esophagus | ESCC | RNA splicing | 336/8552 | 434/18723 | 1.74e-42 | 3.67e-39 | 336 |
| GO:000838012 | Liver | Cirrhotic | RNA splicing | 229/4634 | 434/18723 | 9.13e-37 | 2.86e-33 | 229 |
| GO:000838022 | Liver | HCC | RNA splicing | 313/7958 | 434/18723 | 1.36e-36 | 1.73e-33 | 313 |
| GO:000838020 | Oral cavity | OSCC | RNA splicing | 308/7305 | 434/18723 | 2.43e-42 | 7.70e-39 | 308 |
| GO:0008380110 | Oral cavity | LP | RNA splicing | 237/4623 | 434/18723 | 1.82e-41 | 3.79e-38 | 237 |
| GO:000838027 | Skin | AK | RNA splicing | 111/1910 | 434/18723 | 1.85e-20 | 5.49e-17 | 111 |
| GO:0008380112 | Skin | cSCC | RNA splicing | 263/4864 | 434/18723 | 2.45e-53 | 5.13e-50 | 263 |
| GO:000838028 | Thyroid | HT | RNA splicing | 84/1272 | 434/18723 | 1.23e-18 | 1.14e-15 | 84 |
| GO:0008380113 | Thyroid | PTC | RNA splicing | 273/5968 | 434/18723 | 4.44e-41 | 1.40e-37 | 273 |
| GO:000838034 | Thyroid | ATC | RNA splicing | 270/6293 | 434/18723 | 7.50e-35 | 1.19e-31 | 270 |
| Page: 1 |
| Pathway ID | Tissue | Disease Stage | Description | Gene Ratio | Bg Ratio | pvalue | p.adjust | qvalue | Count |
| Page: 1 |
Top |
Cell-cell communication analysis |
| Identification of potential cell-cell interactions between two cell types and their ligand-receptor pairs for different disease states |
| Ligand | Receptor | LRpair | Pathway | Tissue | Disease Stage |
| Page: 1 |
Top |
Single-cell gene regulatory network inference analysis |
| Find out the significant the regulons (TFs) and the target genes of each regulon across cell types for different disease states |
| TF | Cell Type | Tissue | Disease Stage | Target Gene | RSS | Regulon Activity |
| ∗The dot plots of a searched regulon are shown for all cell subpopulations in each disease state of each tissue based on the regulon specific score inferred using pySCENIC and by calculating the average expression. |
| Page: 1 |
Top |
Somatic mutation of malignant transformation related genes |
| Annotation of somatic variants for genes involved in malignant transformation |
| Hugo Symbol | Variant Class | Variant Classification | dbSNP RS | HGVSc | HGVSp | HGVSp Short | SWISSPROT | BIOTYPE | SIFT | PolyPhen | Tumor Sample Barcode | Tissue | Histology | Sex | Age | Stage | Therapy Types | Drugs | Outcome |
| SREK1IP1 | SNV | Missense_Mutation | c.35N>A | p.Arg12Lys | p.R12K | Q8N9Q2 | protein_coding | deleterious(0.02) | probably_damaging(0.973) | TCGA-AO-A0J9-01 | Breast | breast invasive carcinoma | Female | <65 | III/IV | Chemotherapy | cyclophosphamide | PD | |
| SREK1IP1 | deletion | Frame_Shift_Del | rs758194195 | c.271delN | p.Arg91GlyfsTer67 | p.R91Gfs*67 | Q8N9Q2 | protein_coding | TCGA-A8-A09Z-01 | Breast | breast invasive carcinoma | Female | >=65 | I/II | Unknown | Unknown | SD | ||
| SREK1IP1 | deletion | Frame_Shift_Del | novel | c.115delN | p.Asp39ThrfsTer2 | p.D39Tfs*2 | Q8N9Q2 | protein_coding | TCGA-D8-A27V-01 | Breast | breast invasive carcinoma | Female | <65 | I/II | Hormone Therapy | tamoxiphen | SD | ||
| SREK1IP1 | SNV | Missense_Mutation | novel | c.223G>A | p.Glu75Lys | p.E75K | Q8N9Q2 | protein_coding | tolerated(0.17) | benign(0.054) | TCGA-VS-A9UC-01 | Cervix | cervical & endocervical cancer | Female | <65 | I/II | Chemotherapy | cisplatin | SD |
| SREK1IP1 | SNV | Missense_Mutation | novel | c.135N>A | p.Ser45Arg | p.S45R | Q8N9Q2 | protein_coding | deleterious(0) | probably_damaging(0.995) | TCGA-VS-A9UD-01 | Cervix | cervical & endocervical cancer | Female | >=65 | III/IV | Chemotherapy | cisplatin | CR |
| SREK1IP1 | deletion | Frame_Shift_Del | c.381delN | p.Lys129AsnfsTer29 | p.K129Nfs*29 | Q8N9Q2 | protein_coding | TCGA-VS-A9U6-01 | Cervix | cervical & endocervical cancer | Female | <65 | I/II | Chemotherapy | cisplatin | PD | |||
| SREK1IP1 | SNV | Missense_Mutation | rs752181049 | c.86N>A | p.Arg29His | p.R29H | Q8N9Q2 | protein_coding | deleterious(0.01) | probably_damaging(0.971) | TCGA-D5-6930-01 | Colorectum | colon adenocarcinoma | Male | >=65 | I/II | Unknown | Unknown | SD |
| SREK1IP1 | SNV | Missense_Mutation | c.242N>C | p.Ser81Thr | p.S81T | Q8N9Q2 | protein_coding | tolerated(0.18) | possibly_damaging(0.483) | TCGA-AG-3890-01 | Colorectum | rectum adenocarcinoma | Male | <65 | I/II | Unknown | Unknown | SD | |
| SREK1IP1 | SNV | Missense_Mutation | novel | c.456C>A | p.Phe152Leu | p.F152L | Q8N9Q2 | protein_coding | tolerated_low_confidence(0.05) | benign(0) | TCGA-AG-A002-01 | Colorectum | rectum adenocarcinoma | Male | <65 | I/II | Unknown | Unknown | SD |
| SREK1IP1 | deletion | In_Frame_Del | novel | c.346_354delGAAAAGAAA | p.Glu116_Lys118del | p.E116_K118del | Q8N9Q2 | protein_coding | TCGA-5M-AATA-01 | Colorectum | colon adenocarcinoma | Unknown | Unknown | I/II | Unknown | Unknown | Unknown |
| Page: 1 2 3 4 |
Top |
Related drugs of malignant transformation related genes |
| Identification of chemicals and drugs interact with genes involved in malignant transfromation |
| (DGIdb 4.0) |
| Entrez ID | Symbol | Category | Interaction Types | Drug Claim Name | Drug Name | PMIDs |
| Page: 1 |

Copyright 2023-Present -The University of Texas Health Science Center at Houston |