
|
|||||
|
 | |
| |
| |
| |
| |
| |
|
Gene: SREK1 |
Gene summary for SREK1 |
| Gene information | Species | Human | Gene symbol | SREK1 | Gene ID | 140890 |
| Gene name | splicing regulatory glutamic acid and lysine rich protein 1 | |
| Gene Alias | SFRS12 | |
| Cytomap | 5q12.3 | |
| Gene Type | protein-coding | GO ID | GO:0006139 | UniProtAcc | Q8WXA9 |
Top |
Malignant transformation analysis |
| Identification of the aberrant gene expression in precancerous and cancerous lesions by comparing the gene expression of stem-like cells in diseased tissues with normal stem cells |
| Entrez ID | Symbol | Replicates | Species | Organ | Tissue | Adj P-value | Log2FC | Malignancy |
| 140890 | SREK1 | HTA11_3410_2000001011 | Human | Colorectum | AD | 7.92e-17 | -6.29e-01 | 0.0155 |
| 140890 | SREK1 | HTA11_2487_2000001011 | Human | Colorectum | SER | 2.15e-04 | -4.96e-01 | -0.1808 |
| 140890 | SREK1 | HTA11_3361_2000001011 | Human | Colorectum | AD | 3.90e-04 | -5.54e-01 | -0.1207 |
| 140890 | SREK1 | HTA11_696_2000001011 | Human | Colorectum | AD | 1.74e-07 | -4.27e-01 | -0.1464 |
| 140890 | SREK1 | HTA11_866_2000001011 | Human | Colorectum | AD | 1.30e-05 | -4.52e-01 | -0.1001 |
| 140890 | SREK1 | HTA11_866_3004761011 | Human | Colorectum | AD | 1.92e-03 | -4.12e-01 | 0.096 |
| 140890 | SREK1 | HTA11_7696_3000711011 | Human | Colorectum | AD | 8.31e-04 | -3.09e-01 | 0.0674 |
| 140890 | SREK1 | HTA11_6818_2000001021 | Human | Colorectum | AD | 3.42e-02 | -4.57e-01 | 0.0588 |
| 140890 | SREK1 | HTA11_99999974143_84620 | Human | Colorectum | MSS | 5.60e-08 | -4.70e-01 | 0.3005 |
| 140890 | SREK1 | A015-C-203 | Human | Colorectum | FAP | 1.25e-23 | 3.56e-05 | -0.1294 |
| 140890 | SREK1 | A015-C-204 | Human | Colorectum | FAP | 2.14e-02 | 9.13e-02 | -0.0228 |
| 140890 | SREK1 | A002-C-201 | Human | Colorectum | FAP | 1.20e-08 | -6.39e-02 | 0.0324 |
| 140890 | SREK1 | A001-C-119 | Human | Colorectum | FAP | 1.40e-08 | 3.58e-01 | -0.1557 |
| 140890 | SREK1 | A001-C-108 | Human | Colorectum | FAP | 2.69e-13 | 1.11e-01 | -0.0272 |
| 140890 | SREK1 | A002-C-205 | Human | Colorectum | FAP | 3.34e-17 | 4.92e-02 | -0.1236 |
| 140890 | SREK1 | A001-C-104 | Human | Colorectum | FAP | 1.47e-03 | 7.21e-02 | 0.0184 |
| 140890 | SREK1 | A015-C-006 | Human | Colorectum | FAP | 1.05e-11 | 5.56e-02 | -0.0994 |
| 140890 | SREK1 | A015-C-106 | Human | Colorectum | FAP | 5.20e-07 | 5.32e-02 | -0.0511 |
| 140890 | SREK1 | A002-C-114 | Human | Colorectum | FAP | 1.18e-13 | 4.24e-02 | -0.1561 |
| 140890 | SREK1 | A015-C-104 | Human | Colorectum | FAP | 8.61e-27 | 1.00e-01 | -0.1899 |
| Page: 1 2 3 4 5 6 7 8 9 10 |
| Tissue | Expression Dynamics | Abbreviation |
| Colorectum (GSE201348) |  | FAP: Familial adenomatous polyposis |
| CRC: Colorectal cancer | ||
| Colorectum (HTA11) |  | AD: Adenomas |
| SER: Sessile serrated lesions | ||
| MSI-H: Microsatellite-high colorectal cancer | ||
| MSS: Microsatellite stable colorectal cancer | ||
| Endometrium | 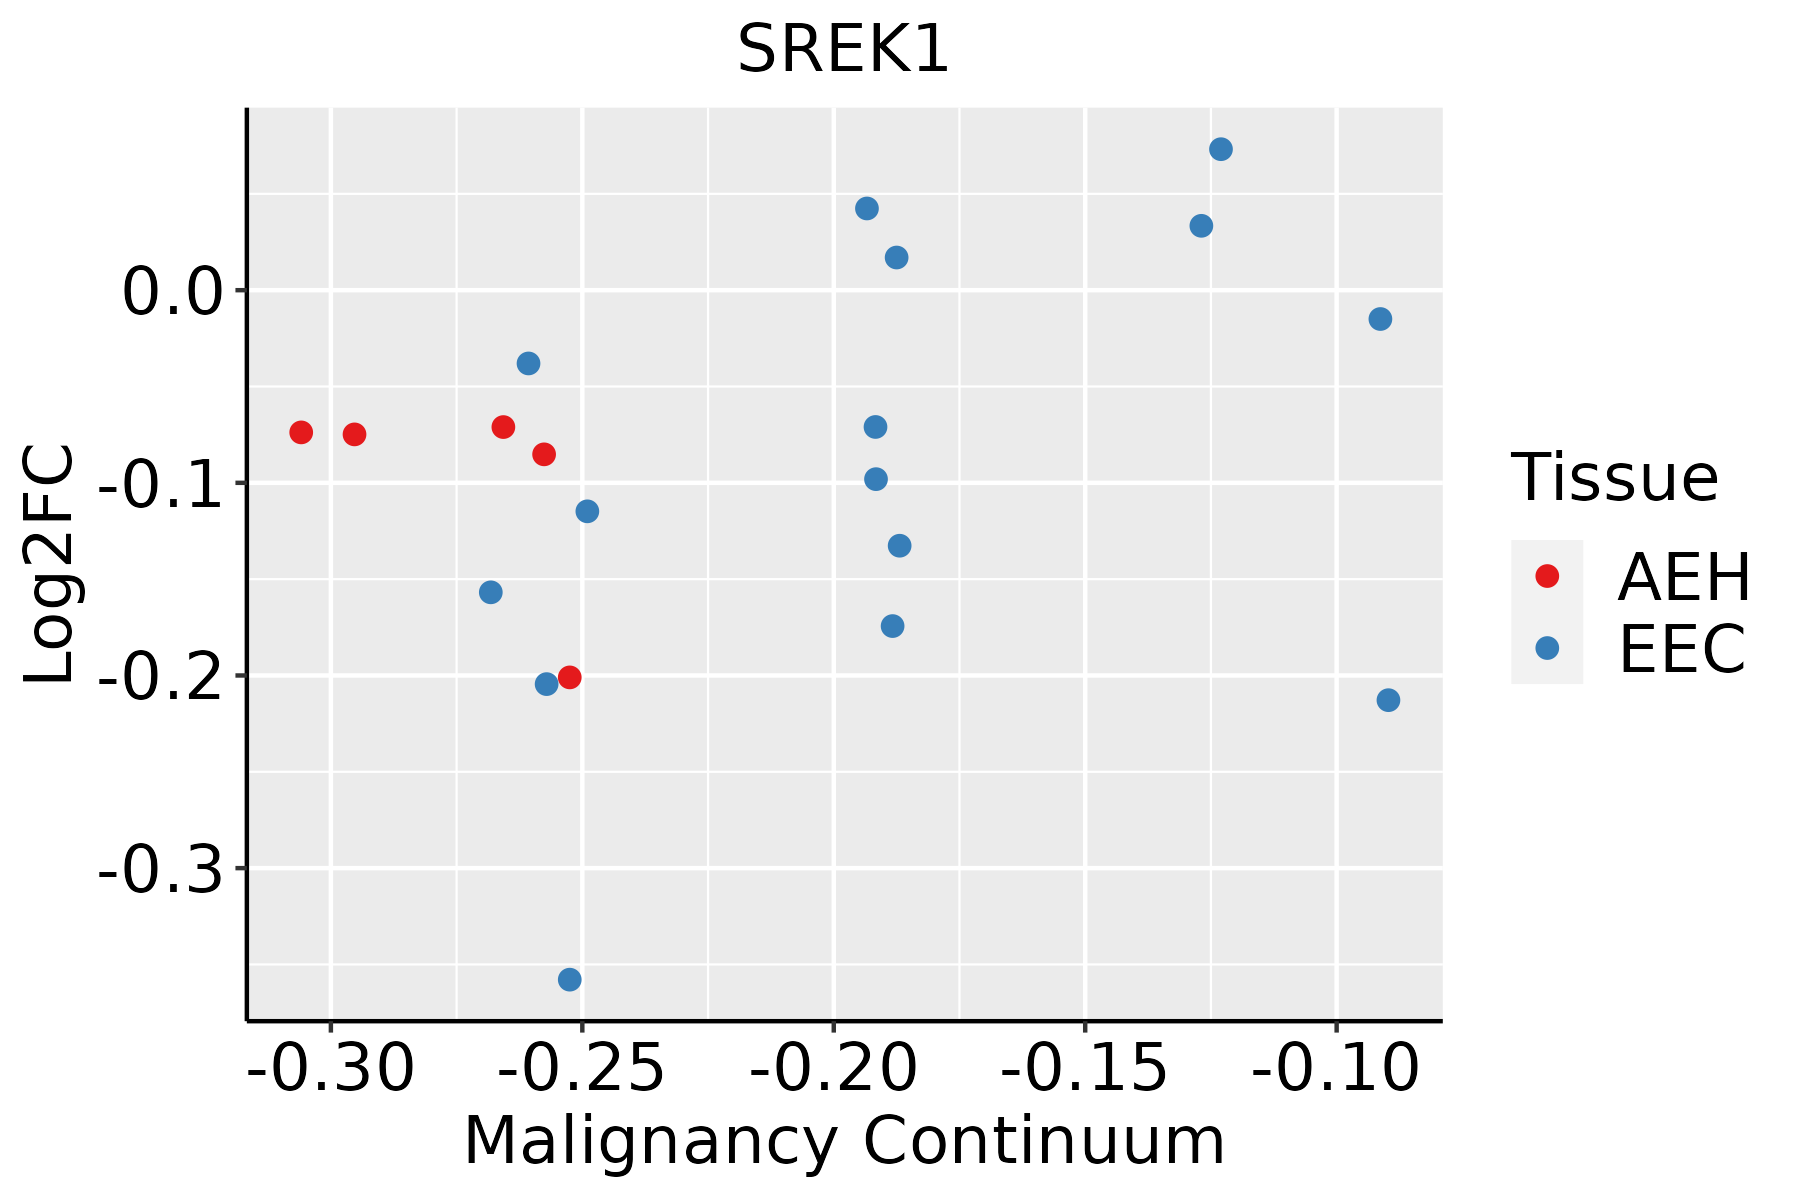 | AEH: Atypical endometrial hyperplasia |
| EEC: Endometrioid Cancer | ||
| Esophagus | 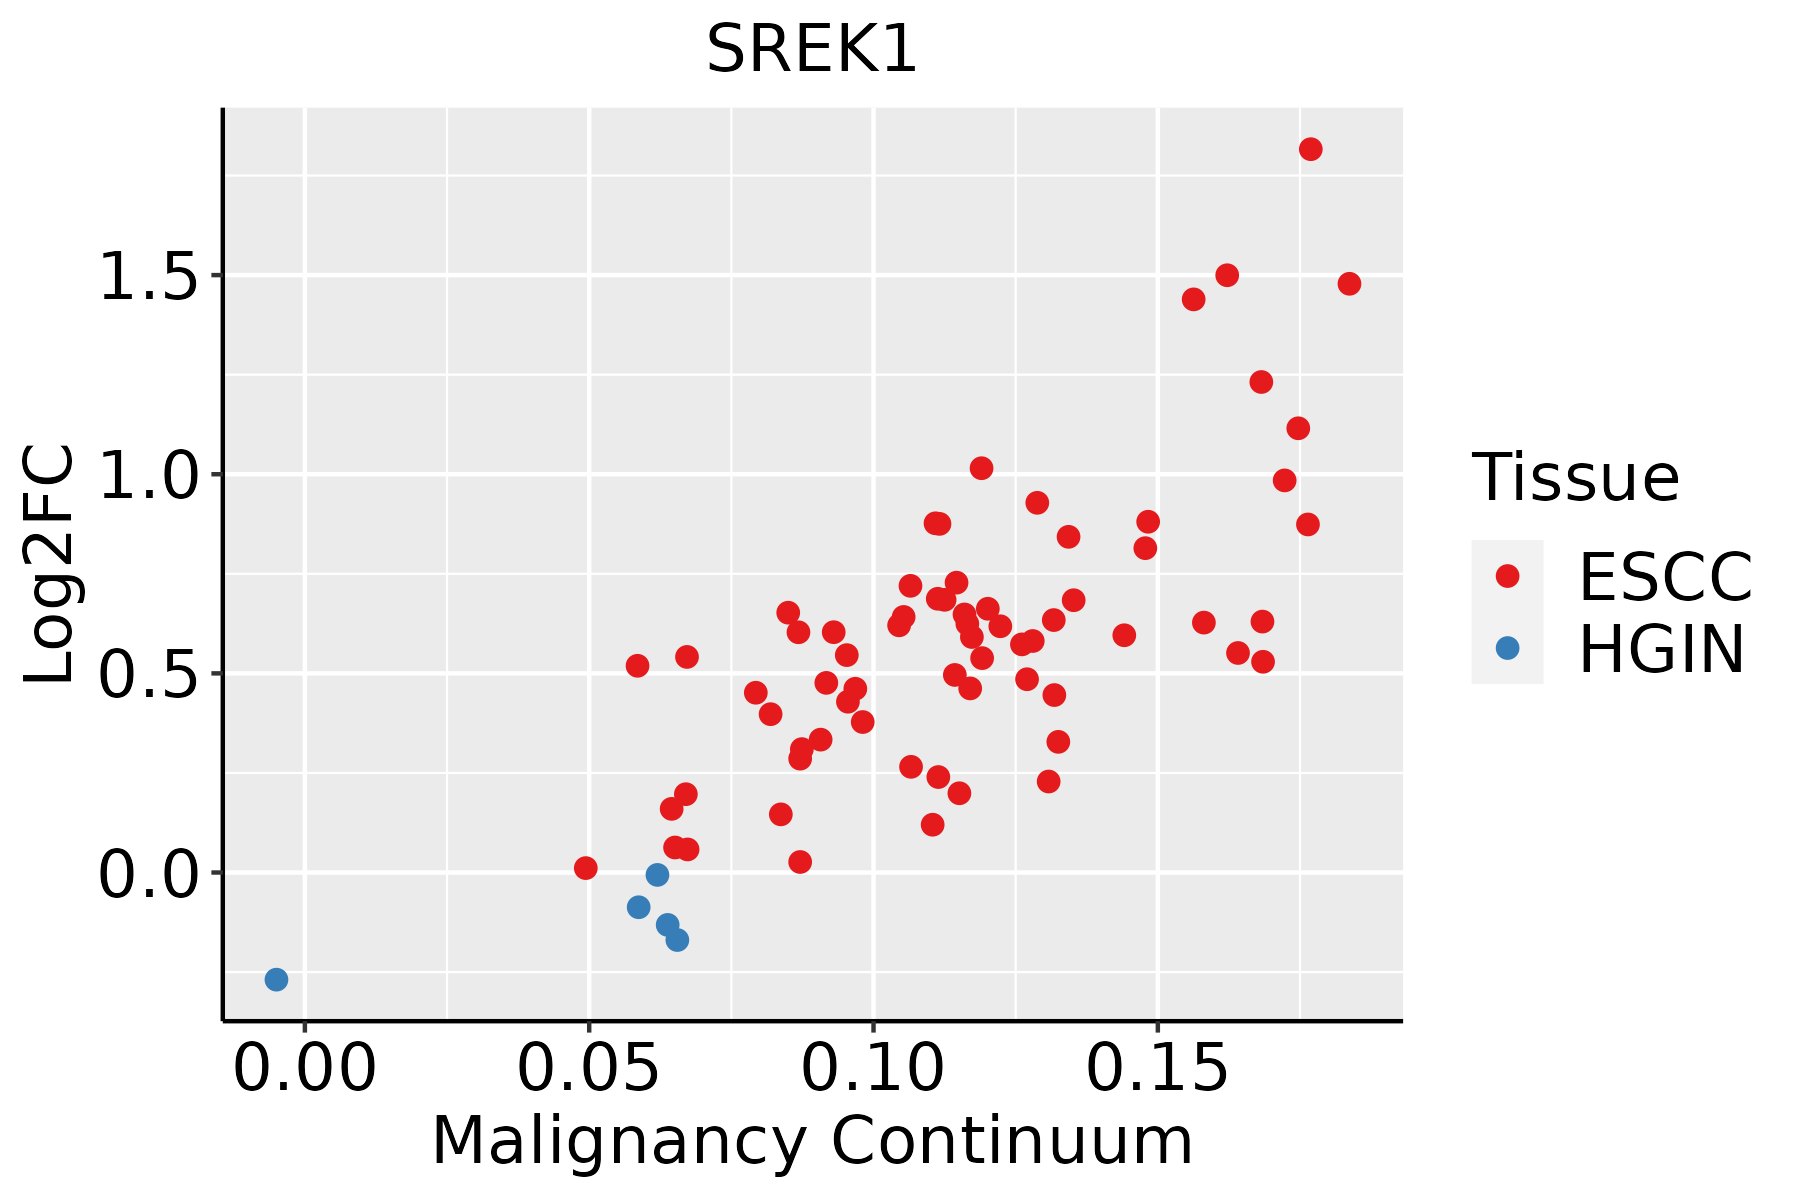 | ESCC: Esophageal squamous cell carcinoma |
| HGIN: High-grade intraepithelial neoplasias | ||
| LGIN: Low-grade intraepithelial neoplasias | ||
| Liver |  | HCC: Hepatocellular carcinoma |
| NAFLD: Non-alcoholic fatty liver disease | ||
| Oral Cavity |  | EOLP: Erosive Oral lichen planus |
| LP: leukoplakia | ||
| NEOLP: Non-erosive oral lichen planus | ||
| OSCC: Oral squamous cell carcinoma | ||
| Prostate |  | BPH: Benign Prostatic Hyperplasia |
| Skin | 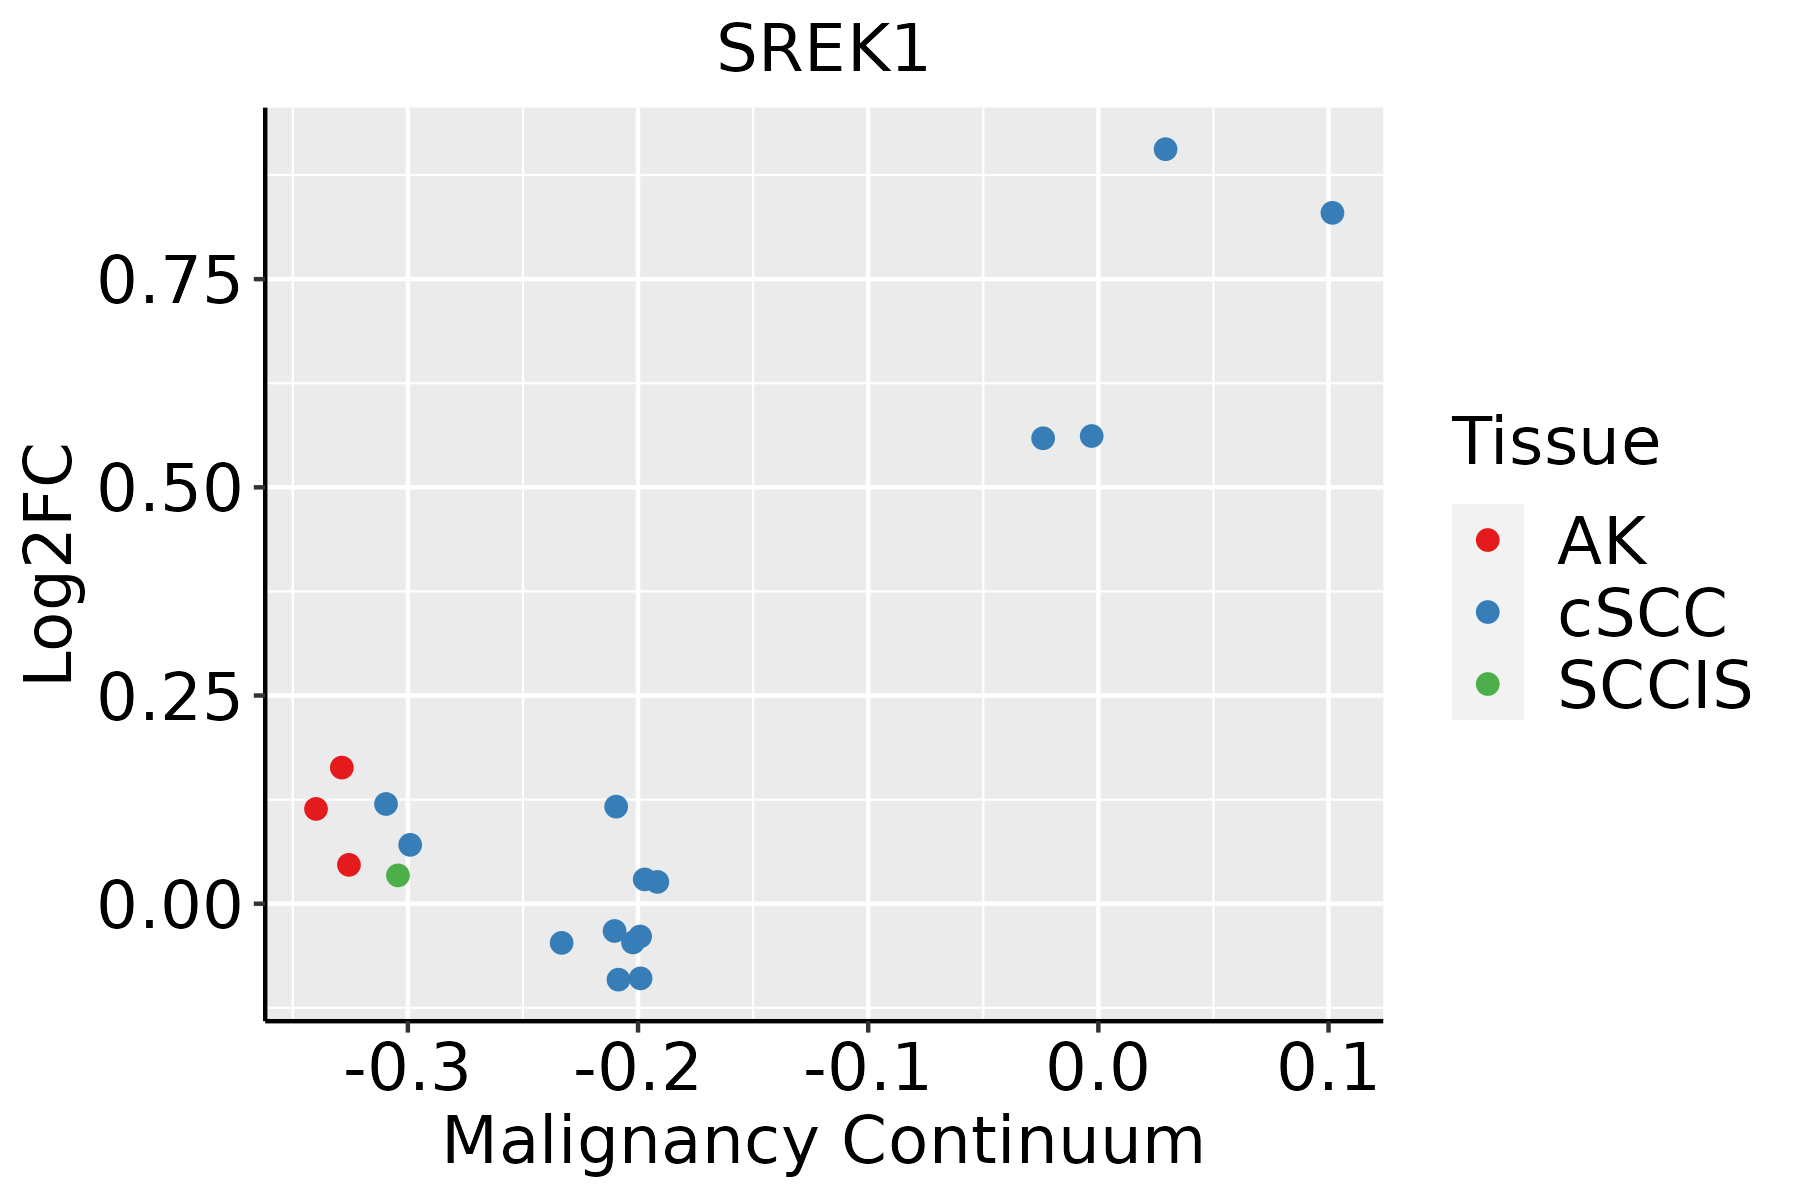 | AK: Actinic keratosis |
| cSCC: Cutaneous squamous cell carcinoma | ||
| SCCIS:squamous cell carcinoma in situ | ||
| Thyroid | 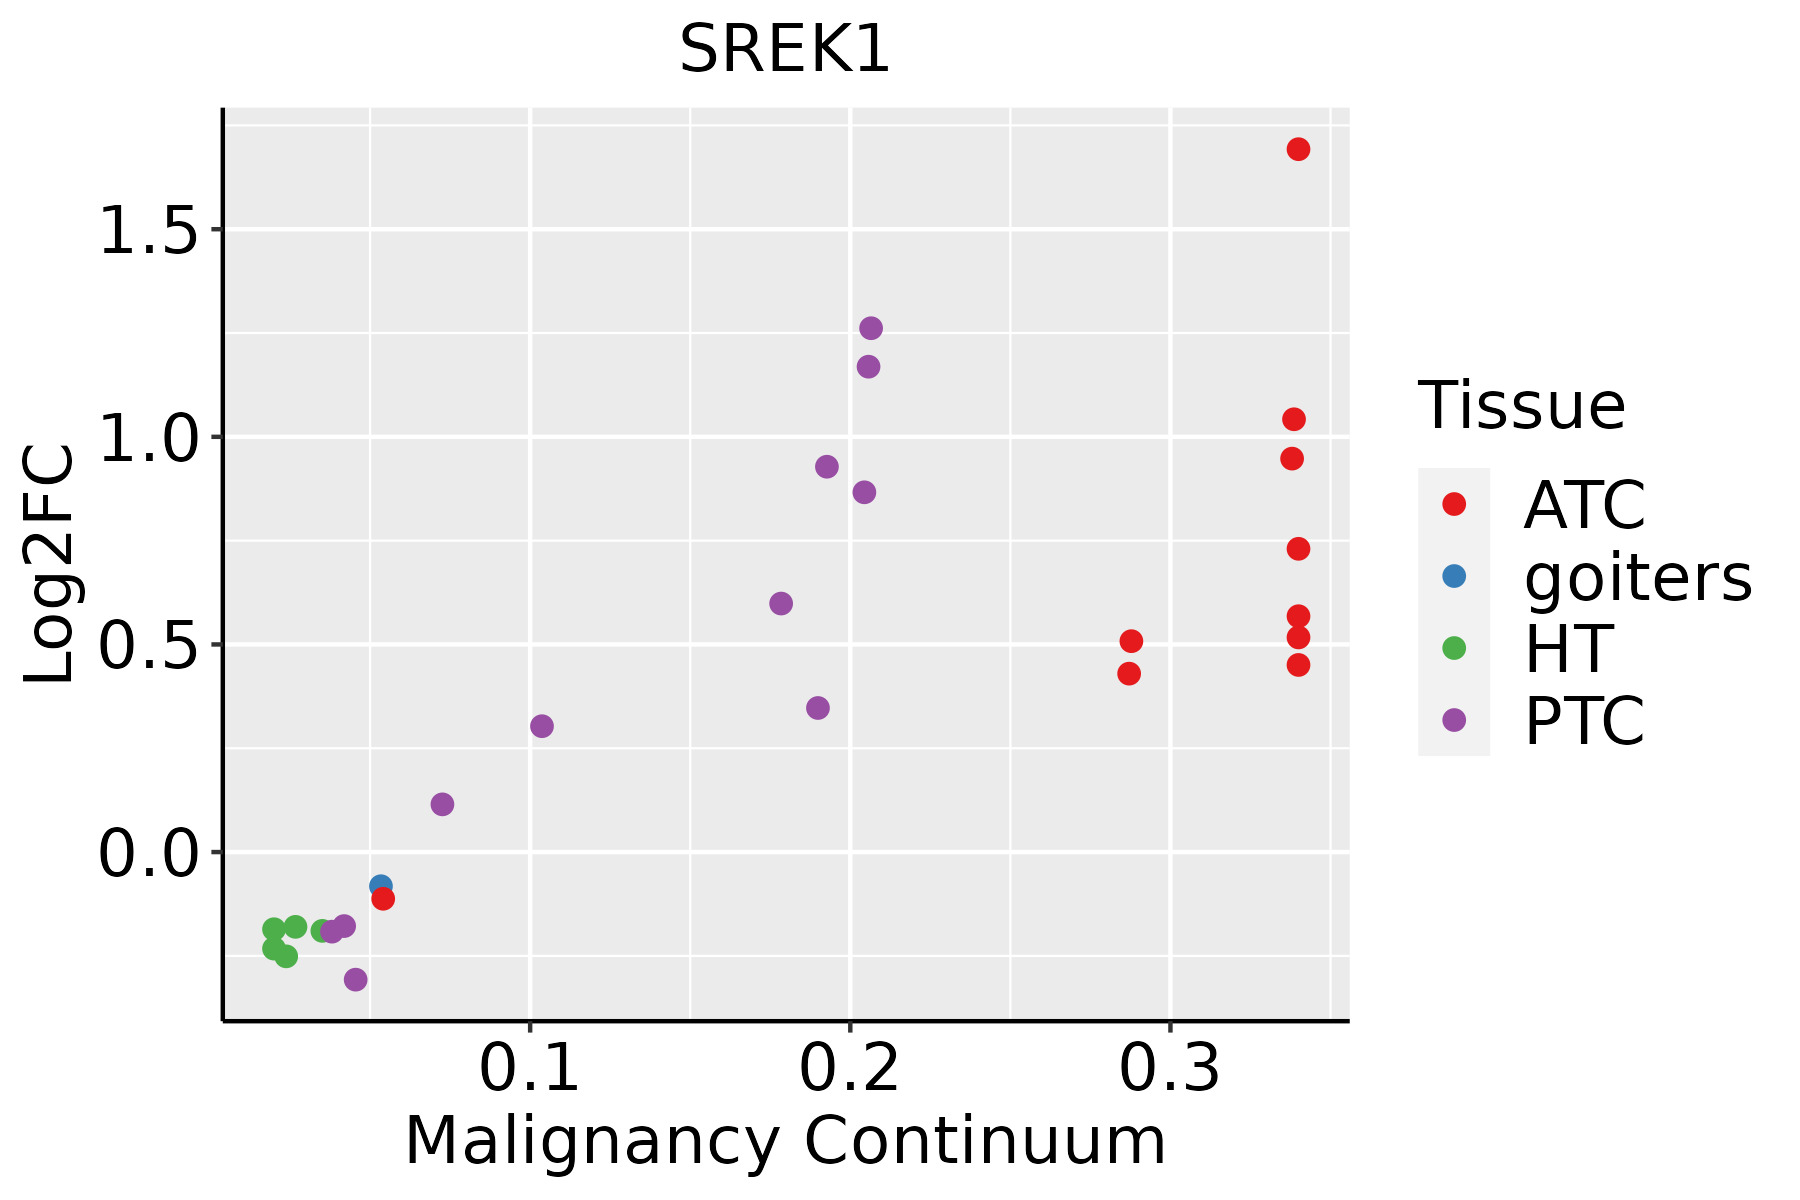 | ATC: Anaplastic thyroid cancer |
| HT: Hashimoto's thyroiditis | ||
| PTC: Papillary thyroid cancer |
| ∗log2FC in expression of this searched gene in stem-like cells from each diseased tissue sample relative to stem-like cells in normal samples in each tissue plotted against the malignancy continuum. Samples are colored based on if they are from different disease stage. |
Top |
Malignant transformation related pathway analysis |
| Find out the enriched GO biological processes and KEGG pathways involved in transition from healthy to precancer to cancer |
| Tissue | Disease Stage | Enriched GO biological Processes |
| Colorectum | AD |  |
| Colorectum | SER |  |
| Colorectum | MSS |  |
| Colorectum | MSI-H |  |
| Colorectum | FAP |  |
| ∗Top 15 enriched GO BP terms are showed in the bar plot of each disease state in each tissue. Each row represents a significant GO biological process which is colored according to the -log10(p.adjust). |
| Page: 1 2 3 4 5 6 7 8 9 |
| GO ID | Tissue | Disease Stage | Description | Gene Ratio | Bg Ratio | pvalue | p.adjust | Count |
| GO:0008380 | Colorectum | AD | RNA splicing | 169/3918 | 434/18723 | 3.59e-18 | 2.04e-15 | 169 |
| GO:00083801 | Colorectum | SER | RNA splicing | 123/2897 | 434/18723 | 3.84e-12 | 8.41e-10 | 123 |
| GO:00083802 | Colorectum | MSS | RNA splicing | 159/3467 | 434/18723 | 1.75e-19 | 1.22e-16 | 159 |
| GO:00083804 | Colorectum | FAP | RNA splicing | 108/2622 | 434/18723 | 7.90e-10 | 1.86e-07 | 108 |
| GO:00083805 | Colorectum | CRC | RNA splicing | 90/2078 | 434/18723 | 2.80e-09 | 7.97e-07 | 90 |
| GO:000838016 | Endometrium | AEH | RNA splicing | 111/2100 | 434/18723 | 2.42e-17 | 1.12e-14 | 111 |
| GO:000838017 | Endometrium | EEC | RNA splicing | 111/2168 | 434/18723 | 2.45e-16 | 1.13e-13 | 111 |
| GO:000838026 | Esophagus | HGIN | RNA splicing | 160/2587 | 434/18723 | 3.74e-34 | 1.12e-30 | 160 |
| GO:0008380111 | Esophagus | ESCC | RNA splicing | 336/8552 | 434/18723 | 1.74e-42 | 3.67e-39 | 336 |
| GO:00083807 | Liver | NAFLD | RNA splicing | 70/1882 | 434/18723 | 4.62e-05 | 1.10e-03 | 70 |
| GO:000838012 | Liver | Cirrhotic | RNA splicing | 229/4634 | 434/18723 | 9.13e-37 | 2.86e-33 | 229 |
| GO:000838022 | Liver | HCC | RNA splicing | 313/7958 | 434/18723 | 1.36e-36 | 1.73e-33 | 313 |
| GO:000838020 | Oral cavity | OSCC | RNA splicing | 308/7305 | 434/18723 | 2.43e-42 | 7.70e-39 | 308 |
| GO:0008380110 | Oral cavity | LP | RNA splicing | 237/4623 | 434/18723 | 1.82e-41 | 3.79e-38 | 237 |
| GO:000838025 | Oral cavity | EOLP | RNA splicing | 115/2218 | 434/18723 | 2.24e-17 | 3.04e-14 | 115 |
| GO:000838033 | Oral cavity | NEOLP | RNA splicing | 110/2005 | 434/18723 | 2.29e-18 | 2.72e-15 | 110 |
| GO:000838018 | Prostate | BPH | RNA splicing | 147/3107 | 434/18723 | 5.17e-19 | 2.29e-16 | 147 |
| GO:000838019 | Prostate | Tumor | RNA splicing | 153/3246 | 434/18723 | 9.15e-20 | 5.79e-17 | 153 |
| GO:000838027 | Skin | AK | RNA splicing | 111/1910 | 434/18723 | 1.85e-20 | 5.49e-17 | 111 |
| GO:0008380112 | Skin | cSCC | RNA splicing | 263/4864 | 434/18723 | 2.45e-53 | 5.13e-50 | 263 |
| Page: 1 2 |
| Pathway ID | Tissue | Disease Stage | Description | Gene Ratio | Bg Ratio | pvalue | p.adjust | qvalue | Count |
| Page: 1 |
Top |
Cell-cell communication analysis |
| Identification of potential cell-cell interactions between two cell types and their ligand-receptor pairs for different disease states |
| Ligand | Receptor | LRpair | Pathway | Tissue | Disease Stage |
| Page: 1 |
Top |
Single-cell gene regulatory network inference analysis |
| Find out the significant the regulons (TFs) and the target genes of each regulon across cell types for different disease states |
| TF | Cell Type | Tissue | Disease Stage | Target Gene | RSS | Regulon Activity |
| ∗The dot plots of a searched regulon are shown for all cell subpopulations in each disease state of each tissue based on the regulon specific score inferred using pySCENIC and by calculating the average expression. |
| Page: 1 |
Top |
Somatic mutation of malignant transformation related genes |
| Annotation of somatic variants for genes involved in malignant transformation |
| Hugo Symbol | Variant Class | Variant Classification | dbSNP RS | HGVSc | HGVSp | HGVSp Short | SWISSPROT | BIOTYPE | SIFT | PolyPhen | Tumor Sample Barcode | Tissue | Histology | Sex | Age | Stage | Therapy Types | Drugs | Outcome |
| SREK1 | SNV | Missense_Mutation | novel | c.1718N>T | p.Ser573Leu | p.S573L | Q8WXA9 | protein_coding | deleterious_low_confidence(0) | benign(0.009) | TCGA-5L-AAT1-01 | Breast | breast invasive carcinoma | Female | <65 | III/IV | Hormone Therapy | letrozol | SD |
| SREK1 | SNV | Missense_Mutation | novel | c.39C>G | p.Phe13Leu | p.F13L | Q8WXA9 | protein_coding | tolerated_low_confidence(0.1) | benign(0.012) | TCGA-A2-A0CP-01 | Breast | breast invasive carcinoma | Female | <65 | I/II | Chemotherapy | cytoxan | SD |
| SREK1 | SNV | Missense_Mutation | rs774604410 | c.920N>A | p.Arg307Gln | p.R307Q | Q8WXA9 | protein_coding | deleterious(0.03) | benign(0.007) | TCGA-AN-A046-01 | Breast | breast invasive carcinoma | Female | >=65 | I/II | Unknown | Unknown | SD |
| SREK1 | SNV | Missense_Mutation | c.869C>T | p.Ser290Leu | p.S290L | Q8WXA9 | protein_coding | deleterious(0) | possibly_damaging(0.778) | TCGA-C8-A275-01 | Breast | breast invasive carcinoma | Female | <65 | I/II | Unknown | Unknown | SD | |
| SREK1 | SNV | Missense_Mutation | c.1022C>T | p.Ser341Leu | p.S341L | Q8WXA9 | protein_coding | deleterious(0.02) | probably_damaging(0.985) | TCGA-DG-A2KK-01 | Cervix | cervical & endocervical cancer | Female | <65 | III/IV | Chemotherapy | cisplatin | SD | |
| SREK1 | SNV | Missense_Mutation | c.136G>C | p.Glu46Gln | p.E46Q | Q8WXA9 | protein_coding | deleterious(0.02) | probably_damaging(0.95) | TCGA-EK-A2R8-01 | Cervix | cervical & endocervical cancer | Female | <65 | I/II | Unknown | Unknown | SD | |
| SREK1 | SNV | Missense_Mutation | c.592N>A | p.Gln198Lys | p.Q198K | Q8WXA9 | protein_coding | deleterious(0.01) | probably_damaging(0.954) | TCGA-IR-A3LK-01 | Cervix | cervical & endocervical cancer | Female | >=65 | I/II | Chemotherapy | cisplatin | PD | |
| SREK1 | SNV | Missense_Mutation | rs767832773 | c.1298N>C | p.Arg433Thr | p.R433T | Q8WXA9 | protein_coding | tolerated(0.16) | benign(0.056) | TCGA-MA-AA42-01 | Cervix | cervical & endocervical cancer | Female | >=65 | I/II | Unknown | Unknown | SD |
| SREK1 | SNV | Missense_Mutation | c.1649G>A | p.Arg550His | p.R550H | Q8WXA9 | protein_coding | tolerated_low_confidence(0.13) | benign(0.003) | TCGA-AA-3864-01 | Colorectum | colon adenocarcinoma | Male | >=65 | I/II | Unknown | Unknown | SD | |
| SREK1 | SNV | Missense_Mutation | c.389C>T | p.Pro130Leu | p.P130L | Q8WXA9 | protein_coding | deleterious(0) | possibly_damaging(0.569) | TCGA-AZ-6598-01 | Colorectum | colon adenocarcinoma | Female | >=65 | I/II | Unknown | Unknown | SD |
| Page: 1 2 3 4 5 6 7 |
Top |
Related drugs of malignant transformation related genes |
| Identification of chemicals and drugs interact with genes involved in malignant transfromation |
| (DGIdb 4.0) |
| Entrez ID | Symbol | Category | Interaction Types | Drug Claim Name | Drug Name | PMIDs |
| Page: 1 |

Copyright 2023-Present -The University of Texas Health Science Center at Houston |