
|
|||||
|
 | |
| |
| |
| |
| |
| |
|
Gene: SREBF2 |
Gene summary for SREBF2 |
| Gene information | Species | Human | Gene symbol | SREBF2 | Gene ID | 6721 |
| Gene name | sterol regulatory element binding transcription factor 2 | |
| Gene Alias | SREBP-2 | |
| Cytomap | 22q13.2 | |
| Gene Type | protein-coding | GO ID | GO:0000122 | UniProtAcc | A0A024R1Q0 |
Top |
Malignant transformation analysis |
| Identification of the aberrant gene expression in precancerous and cancerous lesions by comparing the gene expression of stem-like cells in diseased tissues with normal stem cells |
| Entrez ID | Symbol | Replicates | Species | Organ | Tissue | Adj P-value | Log2FC | Malignancy |
| 6721 | SREBF2 | CCI_1 | Human | Cervix | CC | 4.86e-23 | 1.45e+00 | 0.528 |
| 6721 | SREBF2 | CCI_2 | Human | Cervix | CC | 8.35e-06 | 8.48e-01 | 0.5249 |
| 6721 | SREBF2 | CCI_3 | Human | Cervix | CC | 1.05e-34 | 1.67e+00 | 0.516 |
| 6721 | SREBF2 | HTA11_3410_2000001011 | Human | Colorectum | AD | 1.50e-10 | -4.53e-01 | 0.0155 |
| 6721 | SREBF2 | HTA11_2487_2000001011 | Human | Colorectum | SER | 2.26e-02 | 4.68e-01 | -0.1808 |
| 6721 | SREBF2 | HTA11_347_2000001011 | Human | Colorectum | AD | 7.12e-30 | 9.51e-01 | -0.1954 |
| 6721 | SREBF2 | HTA11_411_2000001011 | Human | Colorectum | SER | 4.58e-09 | 9.45e-01 | -0.2602 |
| 6721 | SREBF2 | HTA11_2112_2000001011 | Human | Colorectum | SER | 1.64e-13 | 6.99e-01 | -0.2196 |
| 6721 | SREBF2 | HTA11_83_2000001011 | Human | Colorectum | SER | 4.41e-09 | 6.81e-01 | -0.1526 |
| 6721 | SREBF2 | HTA11_696_2000001011 | Human | Colorectum | AD | 1.17e-09 | 7.15e-01 | -0.1464 |
| 6721 | SREBF2 | HTA11_546_2000001011 | Human | Colorectum | AD | 1.21e-02 | 5.42e-01 | -0.0842 |
| 6721 | SREBF2 | HTA11_866_3004761011 | Human | Colorectum | AD | 7.45e-05 | -4.78e-01 | 0.096 |
| 6721 | SREBF2 | HTA11_6818_2000001021 | Human | Colorectum | AD | 2.66e-03 | -4.07e-01 | 0.0588 |
| 6721 | SREBF2 | HTA11_99999965062_69753 | Human | Colorectum | MSI-H | 2.05e-10 | 1.09e+00 | 0.3487 |
| 6721 | SREBF2 | HTA11_99999974143_84620 | Human | Colorectum | MSS | 1.35e-22 | -6.55e-01 | 0.3005 |
| 6721 | SREBF2 | F007 | Human | Colorectum | FAP | 5.28e-03 | -4.54e-01 | 0.1176 |
| 6721 | SREBF2 | A002-C-010 | Human | Colorectum | FAP | 3.26e-10 | -4.35e-01 | 0.242 |
| 6721 | SREBF2 | A001-C-207 | Human | Colorectum | FAP | 8.00e-07 | -5.07e-01 | 0.1278 |
| 6721 | SREBF2 | A015-C-203 | Human | Colorectum | FAP | 4.60e-38 | -6.53e-01 | -0.1294 |
| 6721 | SREBF2 | A015-C-204 | Human | Colorectum | FAP | 4.89e-08 | -5.00e-01 | -0.0228 |
| Page: 1 2 3 4 5 6 7 8 9 10 |
| Tissue | Expression Dynamics | Abbreviation |
| Cervix | 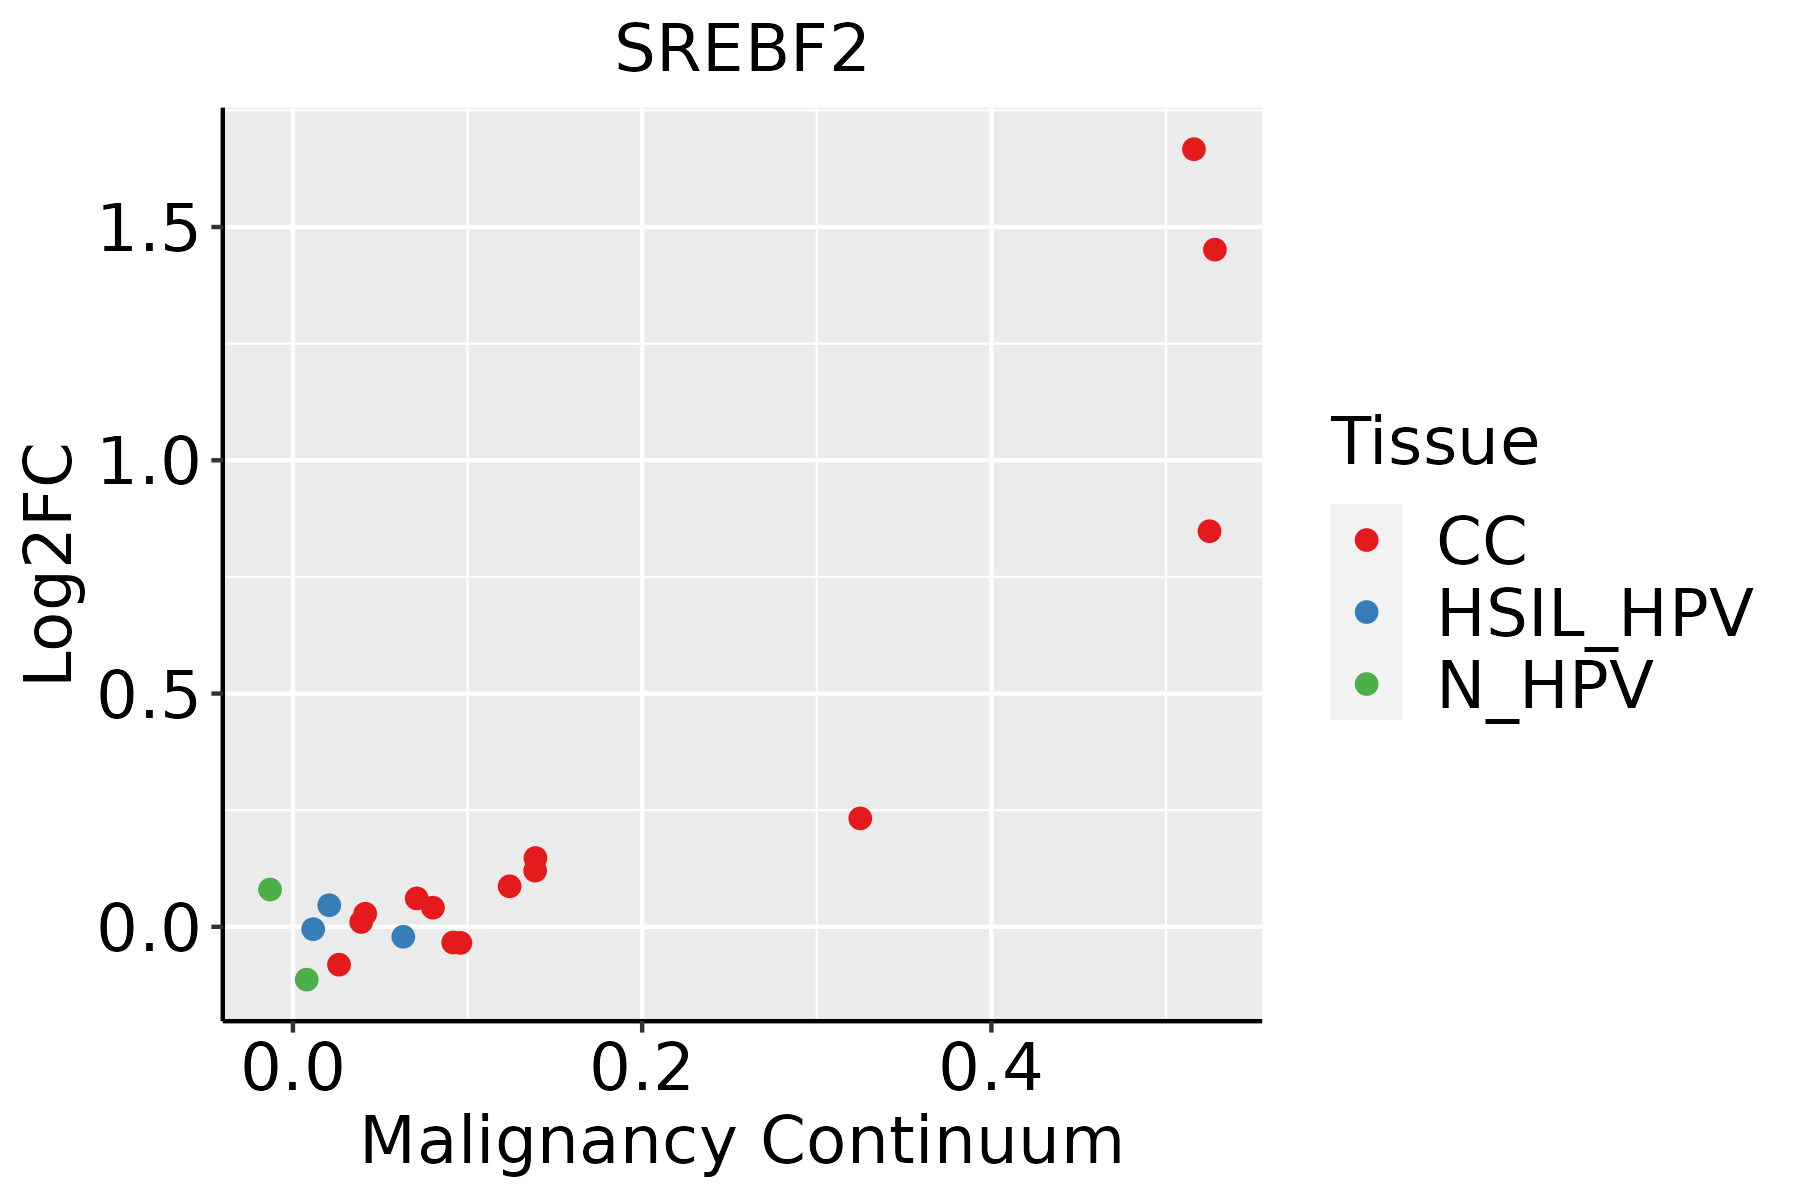 | CC: Cervix cancer |
| HSIL_HPV: HPV-infected high-grade squamous intraepithelial lesions | ||
| N_HPV: HPV-infected normal cervix | ||
| Colorectum (GSE201348) |  | FAP: Familial adenomatous polyposis |
| CRC: Colorectal cancer | ||
| Colorectum (HTA11) | 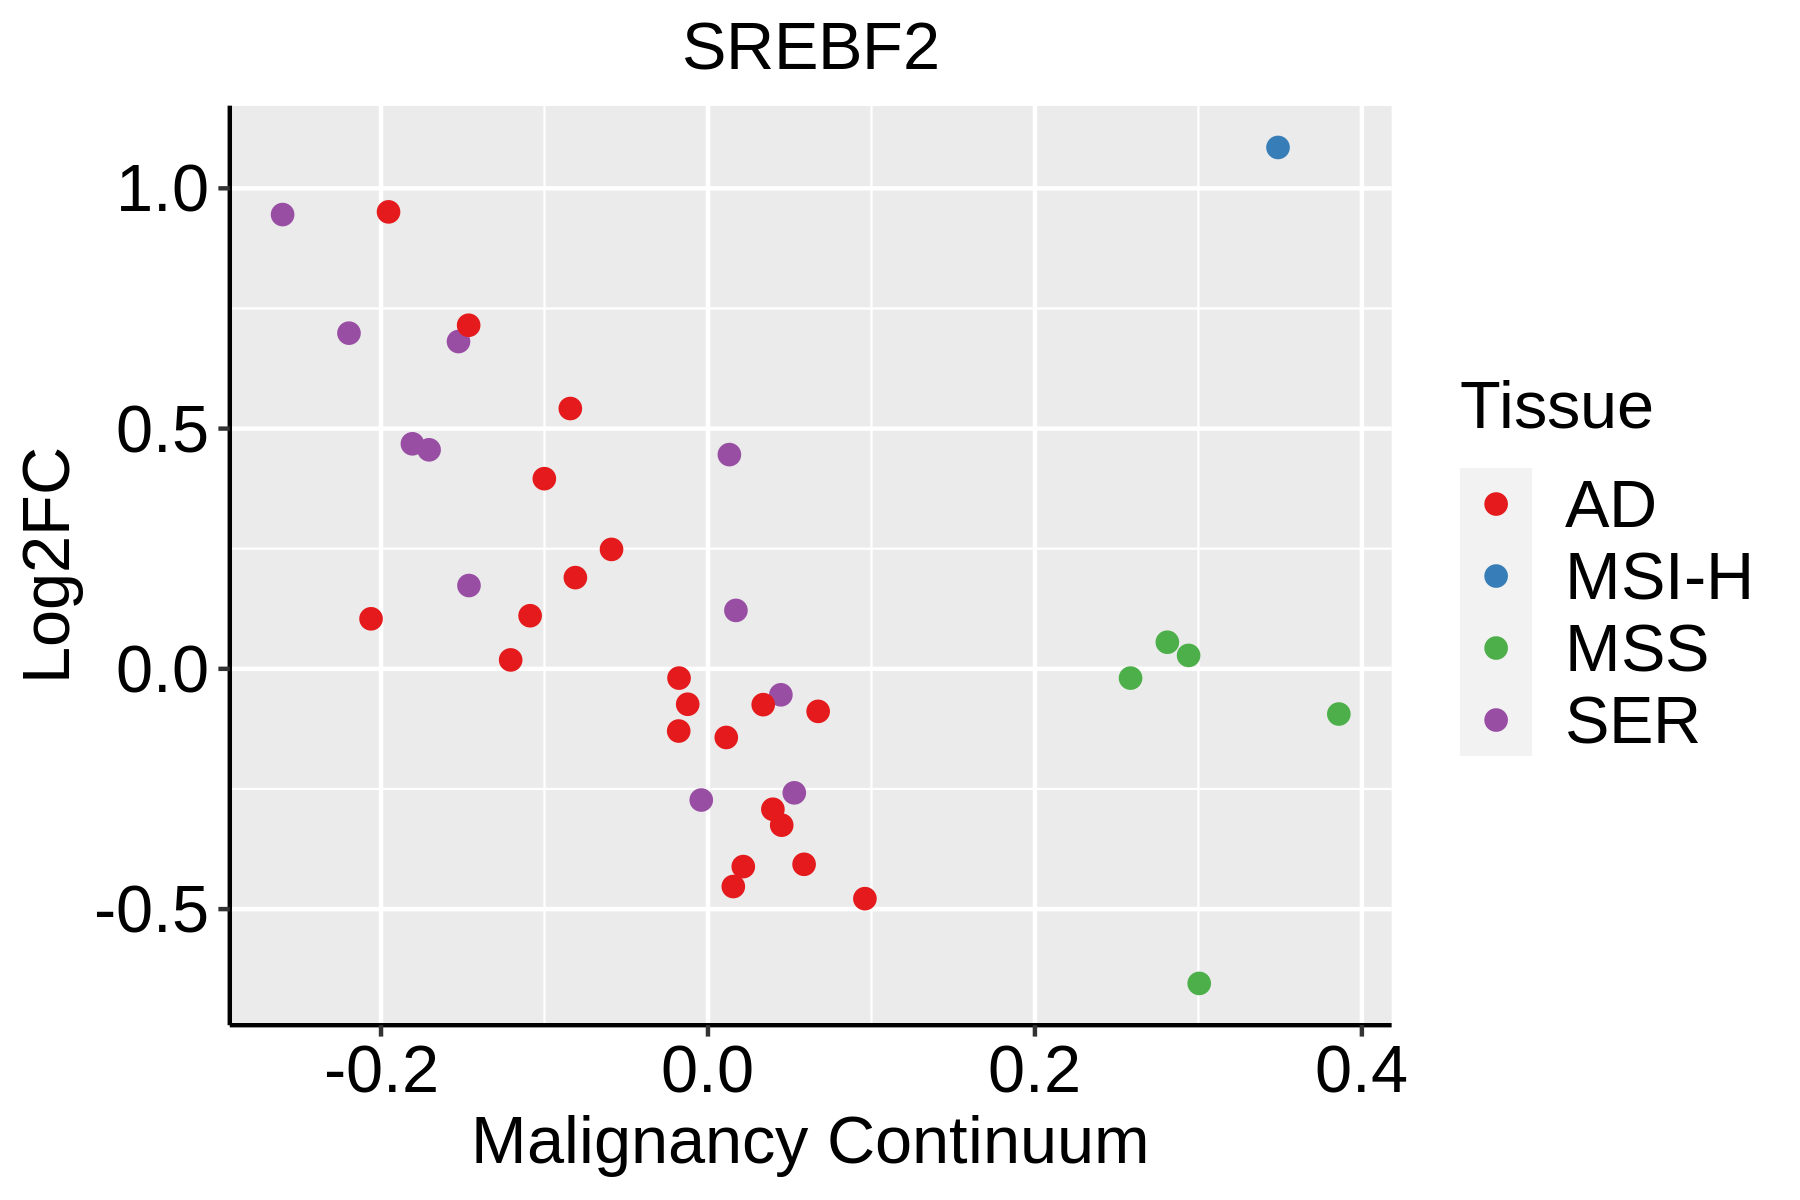 | AD: Adenomas |
| SER: Sessile serrated lesions | ||
| MSI-H: Microsatellite-high colorectal cancer | ||
| MSS: Microsatellite stable colorectal cancer | ||
| Endometrium |  | AEH: Atypical endometrial hyperplasia |
| EEC: Endometrioid Cancer | ||
| Esophagus | 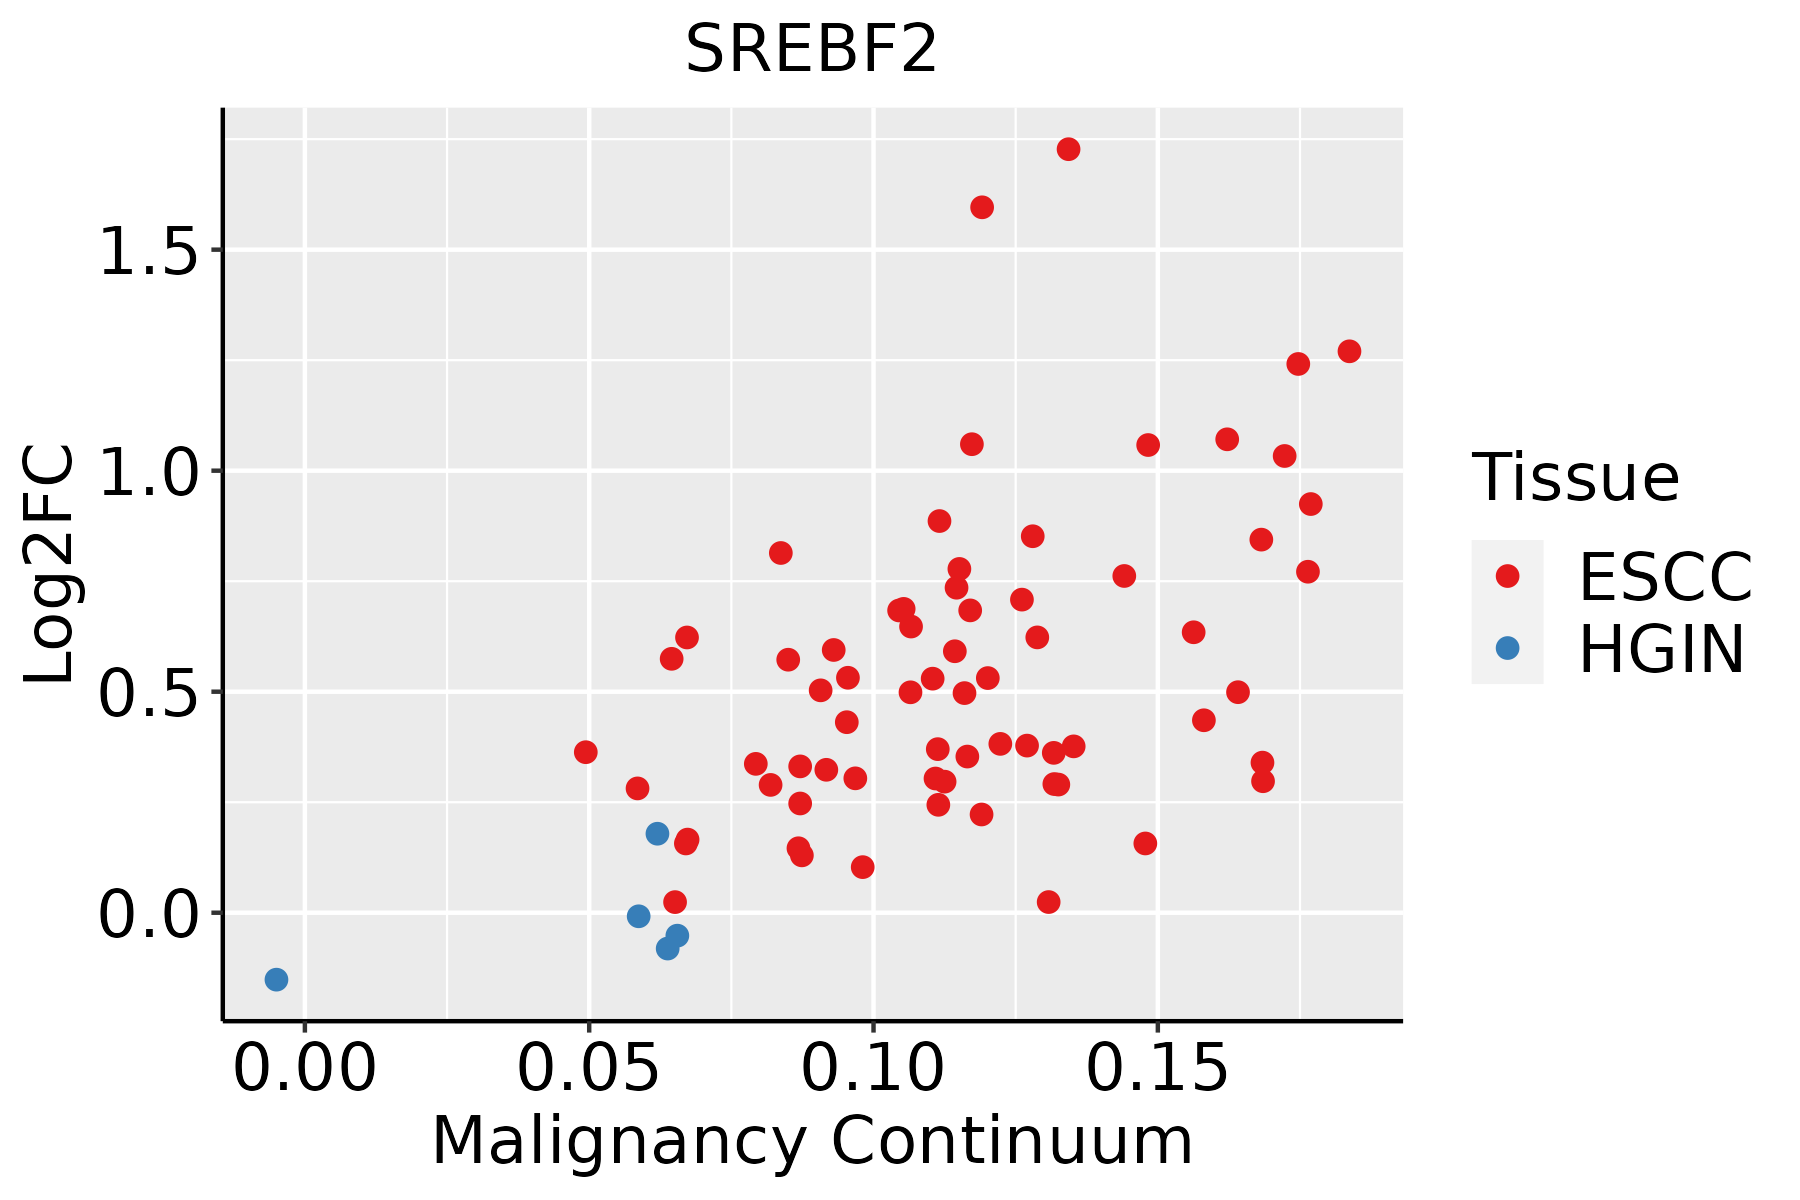 | ESCC: Esophageal squamous cell carcinoma |
| HGIN: High-grade intraepithelial neoplasias | ||
| LGIN: Low-grade intraepithelial neoplasias | ||
| Liver | 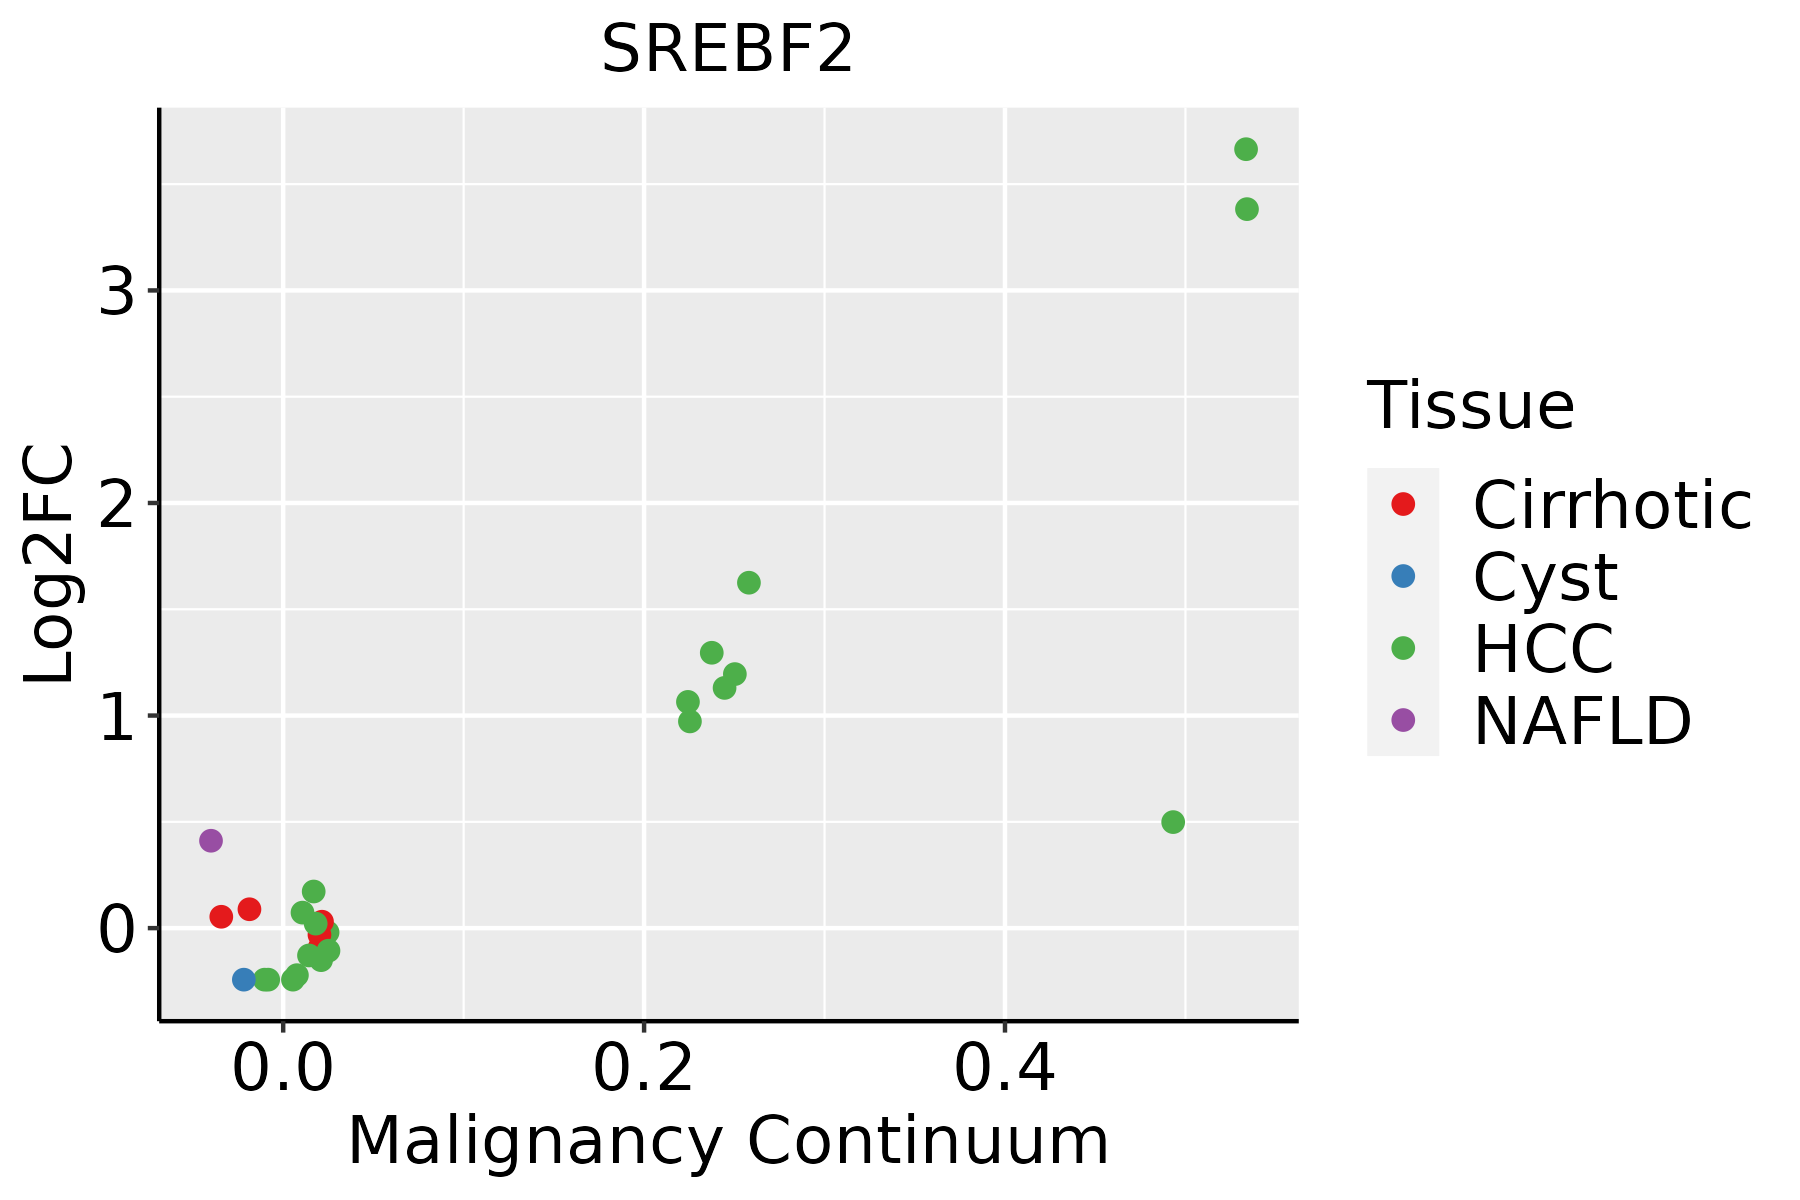 | HCC: Hepatocellular carcinoma |
| NAFLD: Non-alcoholic fatty liver disease | ||
| Oral Cavity | 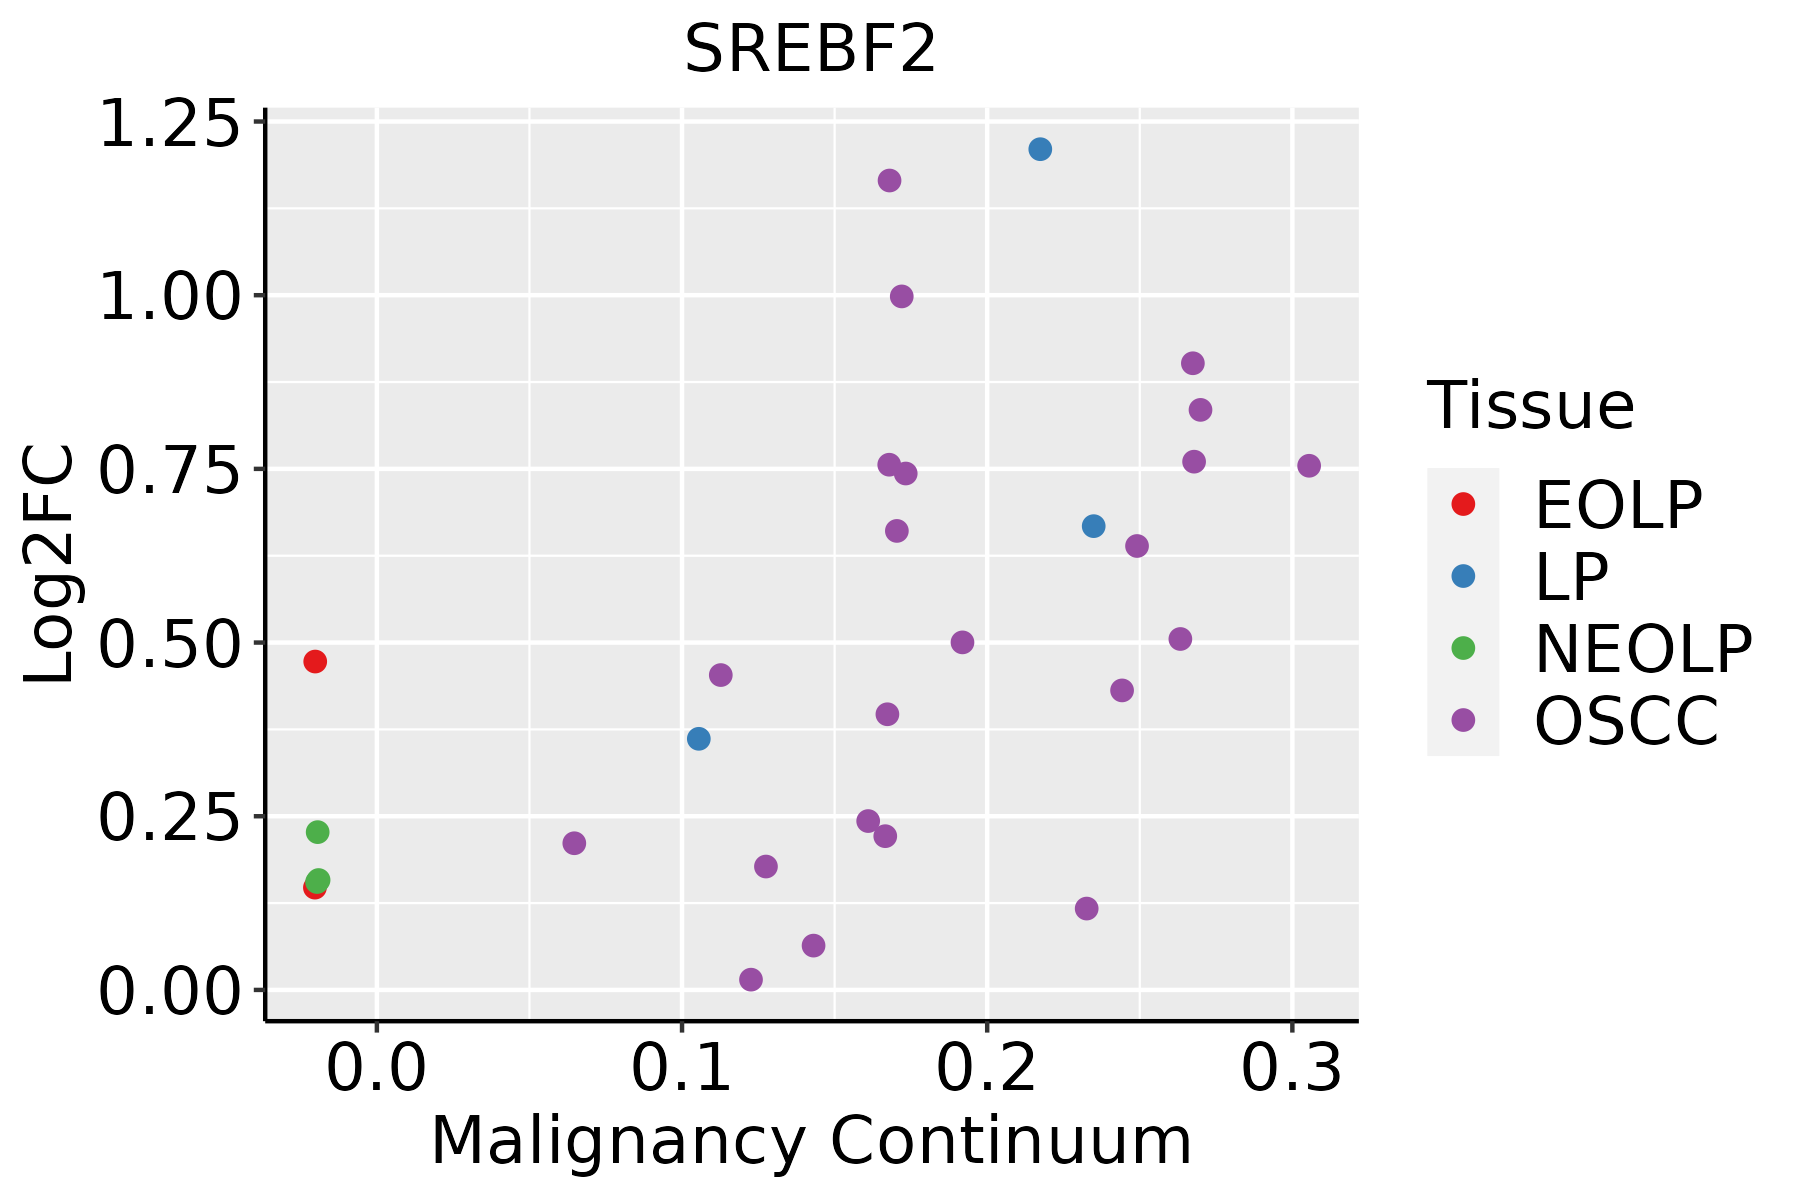 | EOLP: Erosive Oral lichen planus |
| LP: leukoplakia | ||
| NEOLP: Non-erosive oral lichen planus | ||
| OSCC: Oral squamous cell carcinoma | ||
| Prostate |  | BPH: Benign Prostatic Hyperplasia |
| Skin | 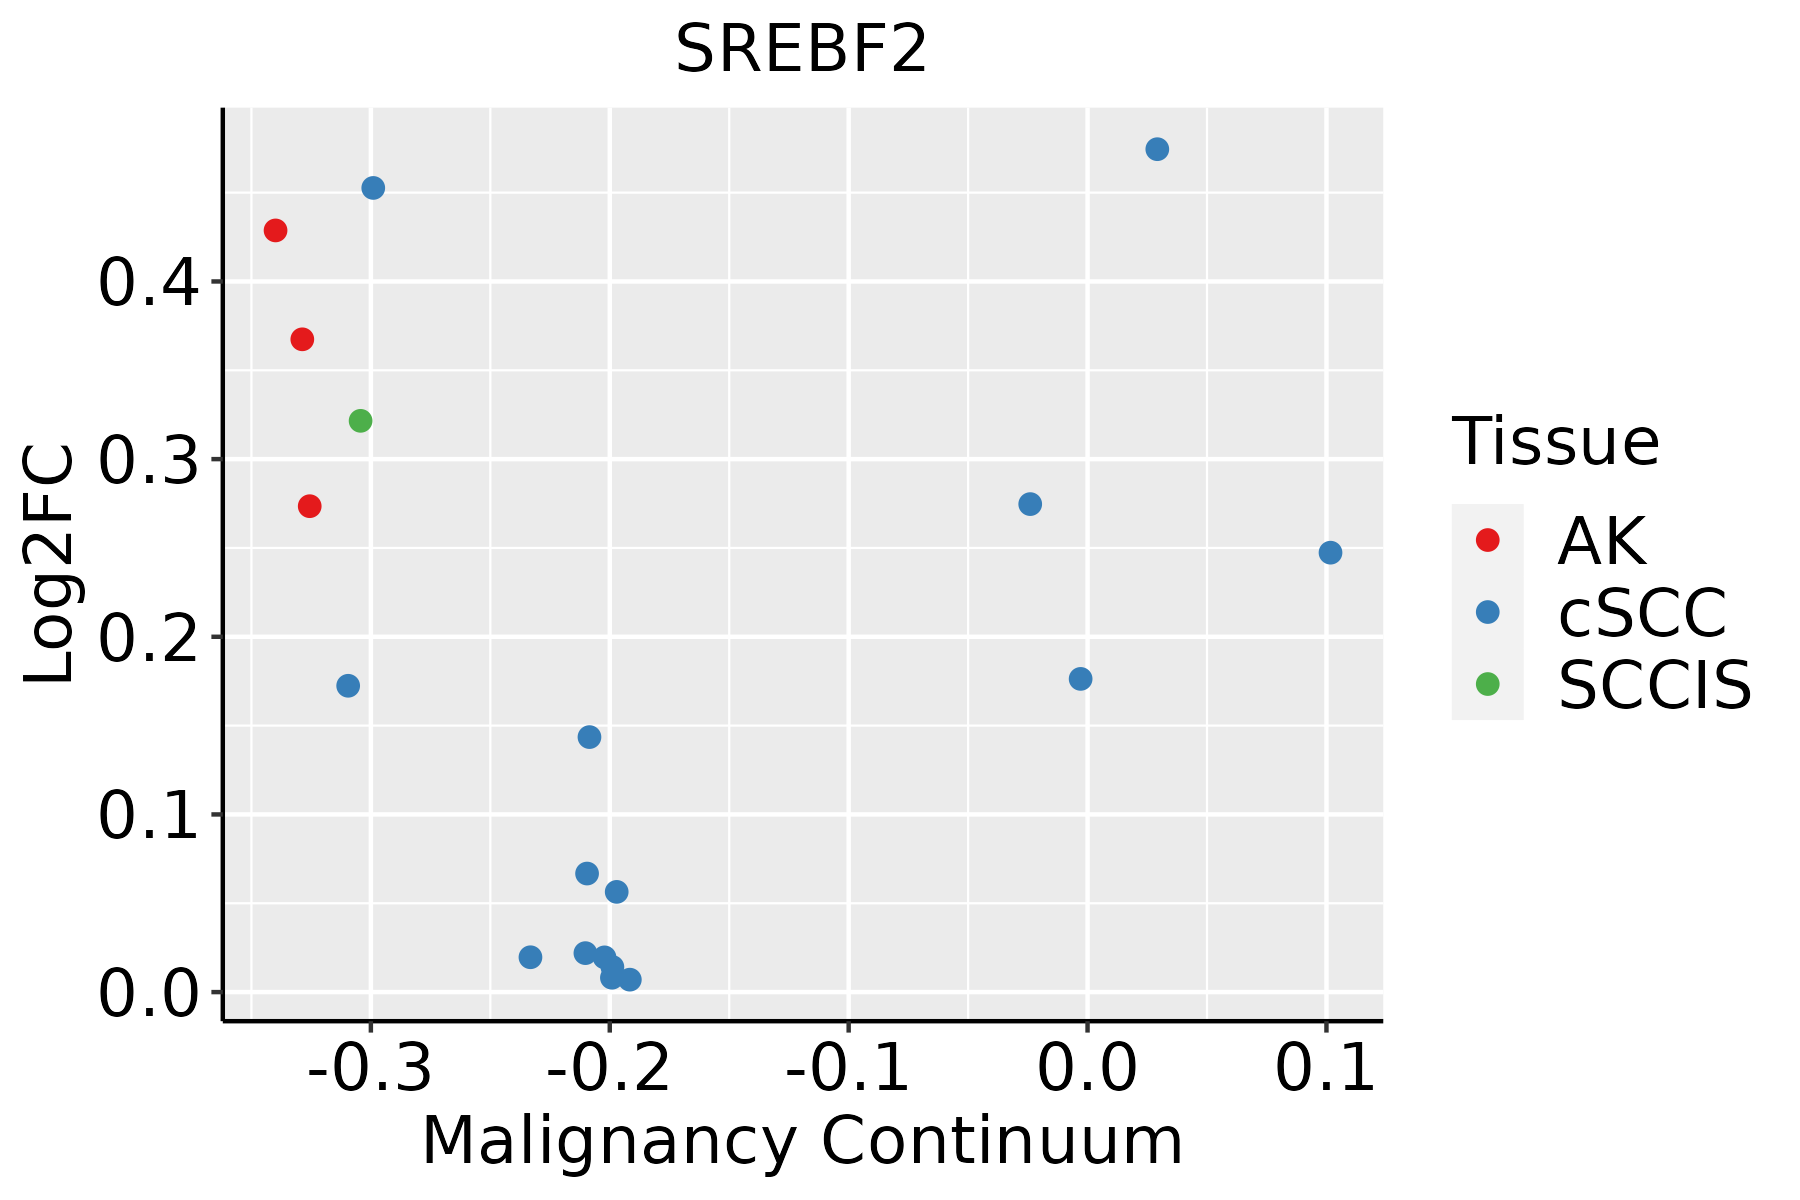 | AK: Actinic keratosis |
| cSCC: Cutaneous squamous cell carcinoma | ||
| SCCIS:squamous cell carcinoma in situ | ||
| Thyroid | 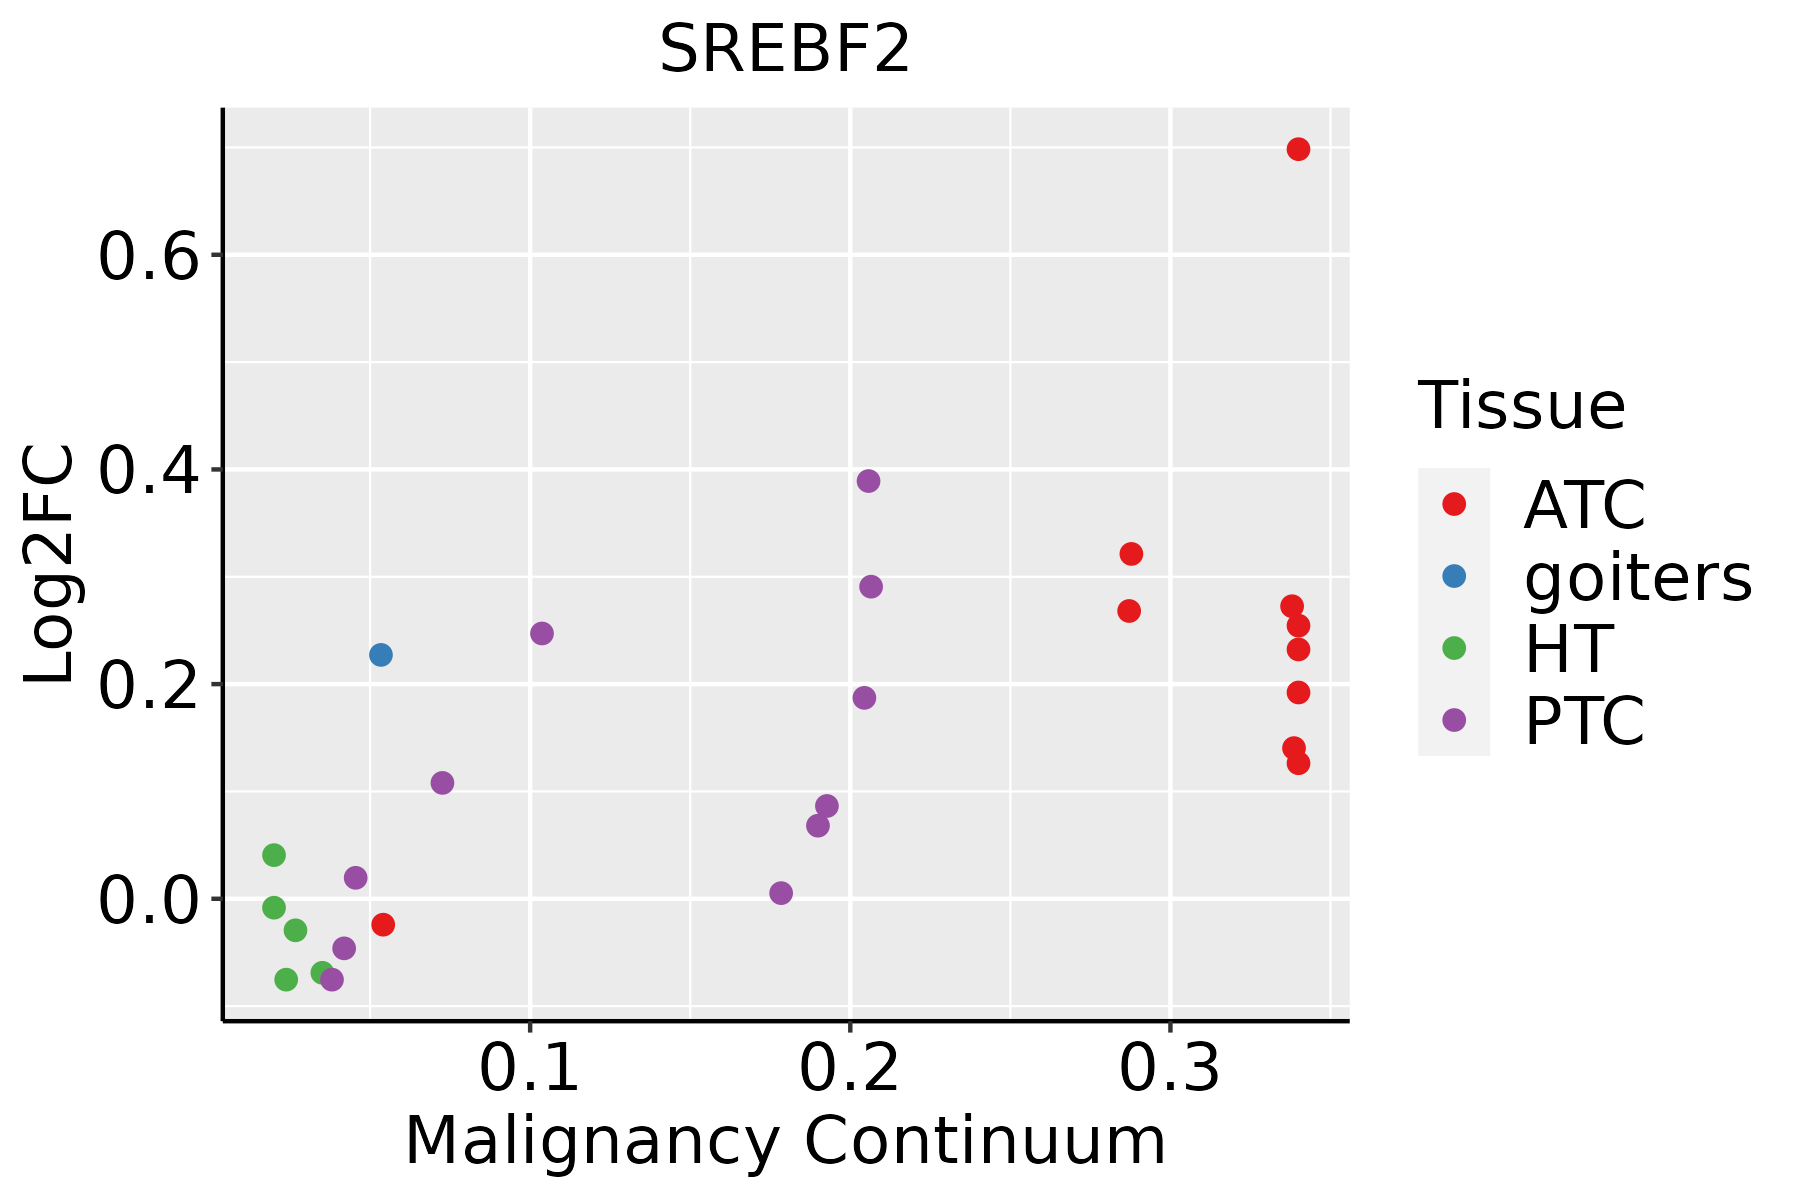 | ATC: Anaplastic thyroid cancer |
| HT: Hashimoto's thyroiditis | ||
| PTC: Papillary thyroid cancer |
| ∗log2FC in expression of this searched gene in stem-like cells from each diseased tissue sample relative to stem-like cells in normal samples in each tissue plotted against the malignancy continuum. Samples are colored based on if they are from different disease stage. |
Top |
Malignant transformation related pathway analysis |
| Find out the enriched GO biological processes and KEGG pathways involved in transition from healthy to precancer to cancer |
| Tissue | Disease Stage | Enriched GO biological Processes |
| Colorectum | AD |  |
| Colorectum | SER |  |
| Colorectum | MSS |  |
| Colorectum | MSI-H |  |
| Colorectum | FAP |  |
| ∗Top 15 enriched GO BP terms are showed in the bar plot of each disease state in each tissue. Each row represents a significant GO biological process which is colored according to the -log10(p.adjust). |
| Page: 1 2 3 4 5 6 7 8 9 |
| GO ID | Tissue | Disease Stage | Description | Gene Ratio | Bg Ratio | pvalue | p.adjust | Count |
| GO:00725949 | Cervix | CC | establishment of protein localization to organelle | 99/2311 | 422/18723 | 1.23e-10 | 2.11e-08 | 99 |
| GO:190382910 | Cervix | CC | positive regulation of cellular protein localization | 72/2311 | 276/18723 | 3.20e-10 | 4.46e-08 | 72 |
| GO:007149610 | Cervix | CC | cellular response to external stimulus | 78/2311 | 320/18723 | 1.82e-09 | 1.98e-07 | 78 |
| GO:00512359 | Cervix | CC | maintenance of location | 78/2311 | 327/18723 | 5.18e-09 | 4.92e-07 | 78 |
| GO:005122210 | Cervix | CC | positive regulation of protein transport | 72/2311 | 303/18723 | 2.36e-08 | 1.70e-06 | 72 |
| GO:190495110 | Cervix | CC | positive regulation of establishment of protein localization | 73/2311 | 319/18723 | 9.69e-08 | 5.25e-06 | 73 |
| GO:00316689 | Cervix | CC | cellular response to extracellular stimulus | 59/2311 | 246/18723 | 3.03e-07 | 1.24e-05 | 59 |
| GO:00068399 | Cervix | CC | mitochondrial transport | 60/2311 | 254/18723 | 4.21e-07 | 1.67e-05 | 60 |
| GO:000660510 | Cervix | CC | protein targeting | 68/2311 | 314/18723 | 2.17e-06 | 6.55e-05 | 68 |
| GO:00903167 | Cervix | CC | positive regulation of intracellular protein transport | 41/2311 | 160/18723 | 3.24e-06 | 8.80e-05 | 41 |
| GO:00323868 | Cervix | CC | regulation of intracellular transport | 71/2311 | 337/18723 | 3.70e-06 | 9.74e-05 | 71 |
| GO:00616148 | Cervix | CC | pri-miRNA transcription by RNA polymerase II | 20/2311 | 55/18723 | 4.22e-06 | 1.09e-04 | 20 |
| GO:003166710 | Cervix | CC | response to nutrient levels | 92/2311 | 474/18723 | 5.80e-06 | 1.42e-04 | 92 |
| GO:00331579 | Cervix | CC | regulation of intracellular protein transport | 52/2311 | 229/18723 | 8.16e-06 | 1.88e-04 | 52 |
| GO:00092678 | Cervix | CC | cellular response to starvation | 39/2311 | 156/18723 | 1.04e-05 | 2.32e-04 | 39 |
| GO:00425948 | Cervix | CC | response to starvation | 46/2311 | 197/18723 | 1.24e-05 | 2.59e-04 | 46 |
| GO:19028938 | Cervix | CC | regulation of pri-miRNA transcription by RNA polymerase II | 19/2311 | 54/18723 | 1.27e-05 | 2.60e-04 | 19 |
| GO:00316698 | Cervix | CC | cellular response to nutrient levels | 49/2311 | 215/18723 | 1.32e-05 | 2.68e-04 | 49 |
| GO:00705859 | Cervix | CC | protein localization to mitochondrion | 33/2311 | 125/18723 | 1.46e-05 | 2.90e-04 | 33 |
| GO:00323889 | Cervix | CC | positive regulation of intracellular transport | 46/2311 | 202/18723 | 2.45e-05 | 4.24e-04 | 46 |
| Page: 1 2 3 4 5 6 7 8 9 10 11 12 13 14 15 16 17 18 19 20 21 22 23 24 25 26 27 28 29 30 31 32 33 34 35 36 37 38 39 40 41 42 43 44 45 |
| Pathway ID | Tissue | Disease Stage | Description | Gene Ratio | Bg Ratio | pvalue | p.adjust | qvalue | Count |
| Page: 1 |
Top |
Cell-cell communication analysis |
| Identification of potential cell-cell interactions between two cell types and their ligand-receptor pairs for different disease states |
| Ligand | Receptor | LRpair | Pathway | Tissue | Disease Stage |
| Page: 1 |
Top |
Single-cell gene regulatory network inference analysis |
| Find out the significant the regulons (TFs) and the target genes of each regulon across cell types for different disease states |
| TF | Cell Type | Tissue | Disease Stage | Target Gene | RSS | Regulon Activity |
| SREBF2 | ABS | Colorectum | AD | ACSS2,FDPS,SIPA1L3, etc. | 2.79e-01 |  |
| SREBF2 | ABS | Colorectum | SER | ACSS2,FDPS,SIPA1L3, etc. | 2.71e-01 |  |
| SREBF2 | SMC | Pancreas | Healthy | HMGCS1,IDI1,CWC27, etc. | 6.36e-01 |  |
| SREBF2 | CAF | Pancreas | PDAC | HMGCS1,IDI1,CWC27, etc. | 1.02e-01 |  |
| ∗The dot plots of a searched regulon are shown for all cell subpopulations in each disease state of each tissue based on the regulon specific score inferred using pySCENIC and by calculating the average expression. |
| Page: 1 |
Top |
Somatic mutation of malignant transformation related genes |
| Annotation of somatic variants for genes involved in malignant transformation |
| Hugo Symbol | Variant Class | Variant Classification | dbSNP RS | HGVSc | HGVSp | HGVSp Short | SWISSPROT | BIOTYPE | SIFT | PolyPhen | Tumor Sample Barcode | Tissue | Histology | Sex | Age | Stage | Therapy Types | Drugs | Outcome |
| SREBF2 | SNV | Missense_Mutation | c.1412N>T | p.Pro471Leu | p.P471L | Q12772 | protein_coding | deleterious(0.02) | benign(0.154) | TCGA-BH-A0HF-01 | Breast | breast invasive carcinoma | Female | >=65 | I/II | Hormone Therapy | arimidex | SD | |
| SREBF2 | SNV | Missense_Mutation | rs147747695 | c.2562N>A | p.Met854Ile | p.M854I | Q12772 | protein_coding | deleterious(0.04) | benign(0) | TCGA-BH-A0HP-01 | Breast | breast invasive carcinoma | Female | >=65 | III/IV | Chemotherapy | doxorubicin | SD |
| SREBF2 | SNV | Missense_Mutation | c.1334N>G | p.Ser445Cys | p.S445C | Q12772 | protein_coding | deleterious(0) | probably_damaging(0.997) | TCGA-BH-A18U-01 | Breast | breast invasive carcinoma | Female | >=65 | III/IV | Unknown | Unknown | SD | |
| SREBF2 | insertion | Frame_Shift_Ins | novel | c.653_654insAAAAATTAGC | p.Thr219LysfsTer99 | p.T219Kfs*99 | Q12772 | protein_coding | TCGA-A8-A07J-01 | Breast | breast invasive carcinoma | Female | <65 | I/II | Chemotherapy | 5-fluorouracil | CR | ||
| SREBF2 | insertion | Nonsense_Mutation | novel | c.1267_1268insGATTAACCCAGGAAGAGTCTCAGACCTCATGAAGTACTGCC | p.Asp423GlyfsTer11 | p.D423Gfs*11 | Q12772 | protein_coding | TCGA-A8-A08H-01 | Breast | breast invasive carcinoma | Female | >=65 | I/II | Unknown | Unknown | SD | ||
| SREBF2 | deletion | Frame_Shift_Del | novel | c.1435delC | p.Arg479AlafsTer19 | p.R479Afs*19 | Q12772 | protein_coding | TCGA-D8-A27V-01 | Breast | breast invasive carcinoma | Female | <65 | I/II | Hormone Therapy | tamoxiphen | SD | ||
| SREBF2 | deletion | Frame_Shift_Del | novel | c.3047delG | p.Gly1016AlafsTer26 | p.G1016Afs*26 | Q12772 | protein_coding | TCGA-EW-A2FV-01 | Breast | breast invasive carcinoma | Female | <65 | III/IV | Chemotherapy | docetaxel | SD | ||
| SREBF2 | SNV | Missense_Mutation | rs200228342 | c.1418N>T | p.Ala473Val | p.A473V | Q12772 | protein_coding | deleterious(0.02) | benign(0.266) | TCGA-2W-A8YY-01 | Cervix | cervical & endocervical cancer | Female | <65 | I/II | Chemotherapy | cisplatin | CR |
| SREBF2 | SNV | Missense_Mutation | c.2674G>A | p.Asp892Asn | p.D892N | Q12772 | protein_coding | deleterious(0) | probably_damaging(0.997) | TCGA-LP-A4AV-01 | Cervix | cervical & endocervical cancer | Female | <65 | I/II | Unknown | Unknown | SD | |
| SREBF2 | SNV | Missense_Mutation | c.2661N>T | p.Trp887Cys | p.W887C | Q12772 | protein_coding | deleterious(0) | probably_damaging(0.998) | TCGA-ZJ-AAXD-01 | Cervix | cervical & endocervical cancer | Female | <65 | III/IV | Unknown | Unknown | SD |
| Page: 1 2 3 4 5 6 7 8 9 |
Top |
Related drugs of malignant transformation related genes |
| Identification of chemicals and drugs interact with genes involved in malignant transfromation |
| (DGIdb 4.0) |
| Entrez ID | Symbol | Category | Interaction Types | Drug Claim Name | Drug Name | PMIDs |
| Page: 1 |

Copyright 2023-Present -The University of Texas Health Science Center at Houston |