
|
|||||
|
 | |
| |
| |
| |
| |
| |
|
Gene: SRD5A3 |
Gene summary for SRD5A3 |
| Gene information | Species | Human | Gene symbol | SRD5A3 | Gene ID | 79644 |
| Gene name | steroid 5 alpha-reductase 3 | |
| Gene Alias | CDG1P | |
| Cytomap | 4q12 | |
| Gene Type | protein-coding | GO ID | GO:0006066 | UniProtAcc | Q9H8P0 |
Top |
Malignant transformation analysis |
| Identification of the aberrant gene expression in precancerous and cancerous lesions by comparing the gene expression of stem-like cells in diseased tissues with normal stem cells |
| Entrez ID | Symbol | Replicates | Species | Organ | Tissue | Adj P-value | Log2FC | Malignancy |
| 79644 | SRD5A3 | LZE4T | Human | Esophagus | ESCC | 5.36e-03 | 1.77e-01 | 0.0811 |
| 79644 | SRD5A3 | LZE5T | Human | Esophagus | ESCC | 5.89e-11 | 8.75e-01 | 0.0514 |
| 79644 | SRD5A3 | LZE7T | Human | Esophagus | ESCC | 4.55e-05 | 3.31e-01 | 0.0667 |
| 79644 | SRD5A3 | LZE20T | Human | Esophagus | ESCC | 2.84e-12 | 5.49e-01 | 0.0662 |
| 79644 | SRD5A3 | LZE22D1 | Human | Esophagus | HGIN | 3.86e-02 | 1.83e-01 | 0.0595 |
| 79644 | SRD5A3 | LZE22T | Human | Esophagus | ESCC | 4.51e-04 | 5.72e-01 | 0.068 |
| 79644 | SRD5A3 | LZE24T | Human | Esophagus | ESCC | 1.57e-15 | 4.93e-01 | 0.0596 |
| 79644 | SRD5A3 | P1T-E | Human | Esophagus | ESCC | 3.62e-12 | 1.22e+00 | 0.0875 |
| 79644 | SRD5A3 | P2T-E | Human | Esophagus | ESCC | 5.20e-21 | 3.71e-01 | 0.1177 |
| 79644 | SRD5A3 | P4T-E | Human | Esophagus | ESCC | 3.49e-25 | 5.79e-01 | 0.1323 |
| 79644 | SRD5A3 | P5T-E | Human | Esophagus | ESCC | 7.34e-17 | 4.05e-01 | 0.1327 |
| 79644 | SRD5A3 | P8T-E | Human | Esophagus | ESCC | 1.80e-27 | 7.17e-01 | 0.0889 |
| 79644 | SRD5A3 | P9T-E | Human | Esophagus | ESCC | 2.48e-12 | 1.98e-01 | 0.1131 |
| 79644 | SRD5A3 | P10T-E | Human | Esophagus | ESCC | 6.74e-22 | 3.45e-01 | 0.116 |
| 79644 | SRD5A3 | P11T-E | Human | Esophagus | ESCC | 2.39e-06 | 2.44e-01 | 0.1426 |
| 79644 | SRD5A3 | P12T-E | Human | Esophagus | ESCC | 2.62e-03 | 1.01e-01 | 0.1122 |
| 79644 | SRD5A3 | P15T-E | Human | Esophagus | ESCC | 3.40e-32 | 7.20e-01 | 0.1149 |
| 79644 | SRD5A3 | P16T-E | Human | Esophagus | ESCC | 8.10e-31 | 5.25e-01 | 0.1153 |
| 79644 | SRD5A3 | P19T-E | Human | Esophagus | ESCC | 3.21e-05 | 3.09e-01 | 0.1662 |
| 79644 | SRD5A3 | P20T-E | Human | Esophagus | ESCC | 1.70e-16 | 3.16e-01 | 0.1124 |
| Page: 1 2 3 4 5 6 |
| Tissue | Expression Dynamics | Abbreviation |
| Esophagus |  | ESCC: Esophageal squamous cell carcinoma |
| HGIN: High-grade intraepithelial neoplasias | ||
| LGIN: Low-grade intraepithelial neoplasias | ||
| Liver | 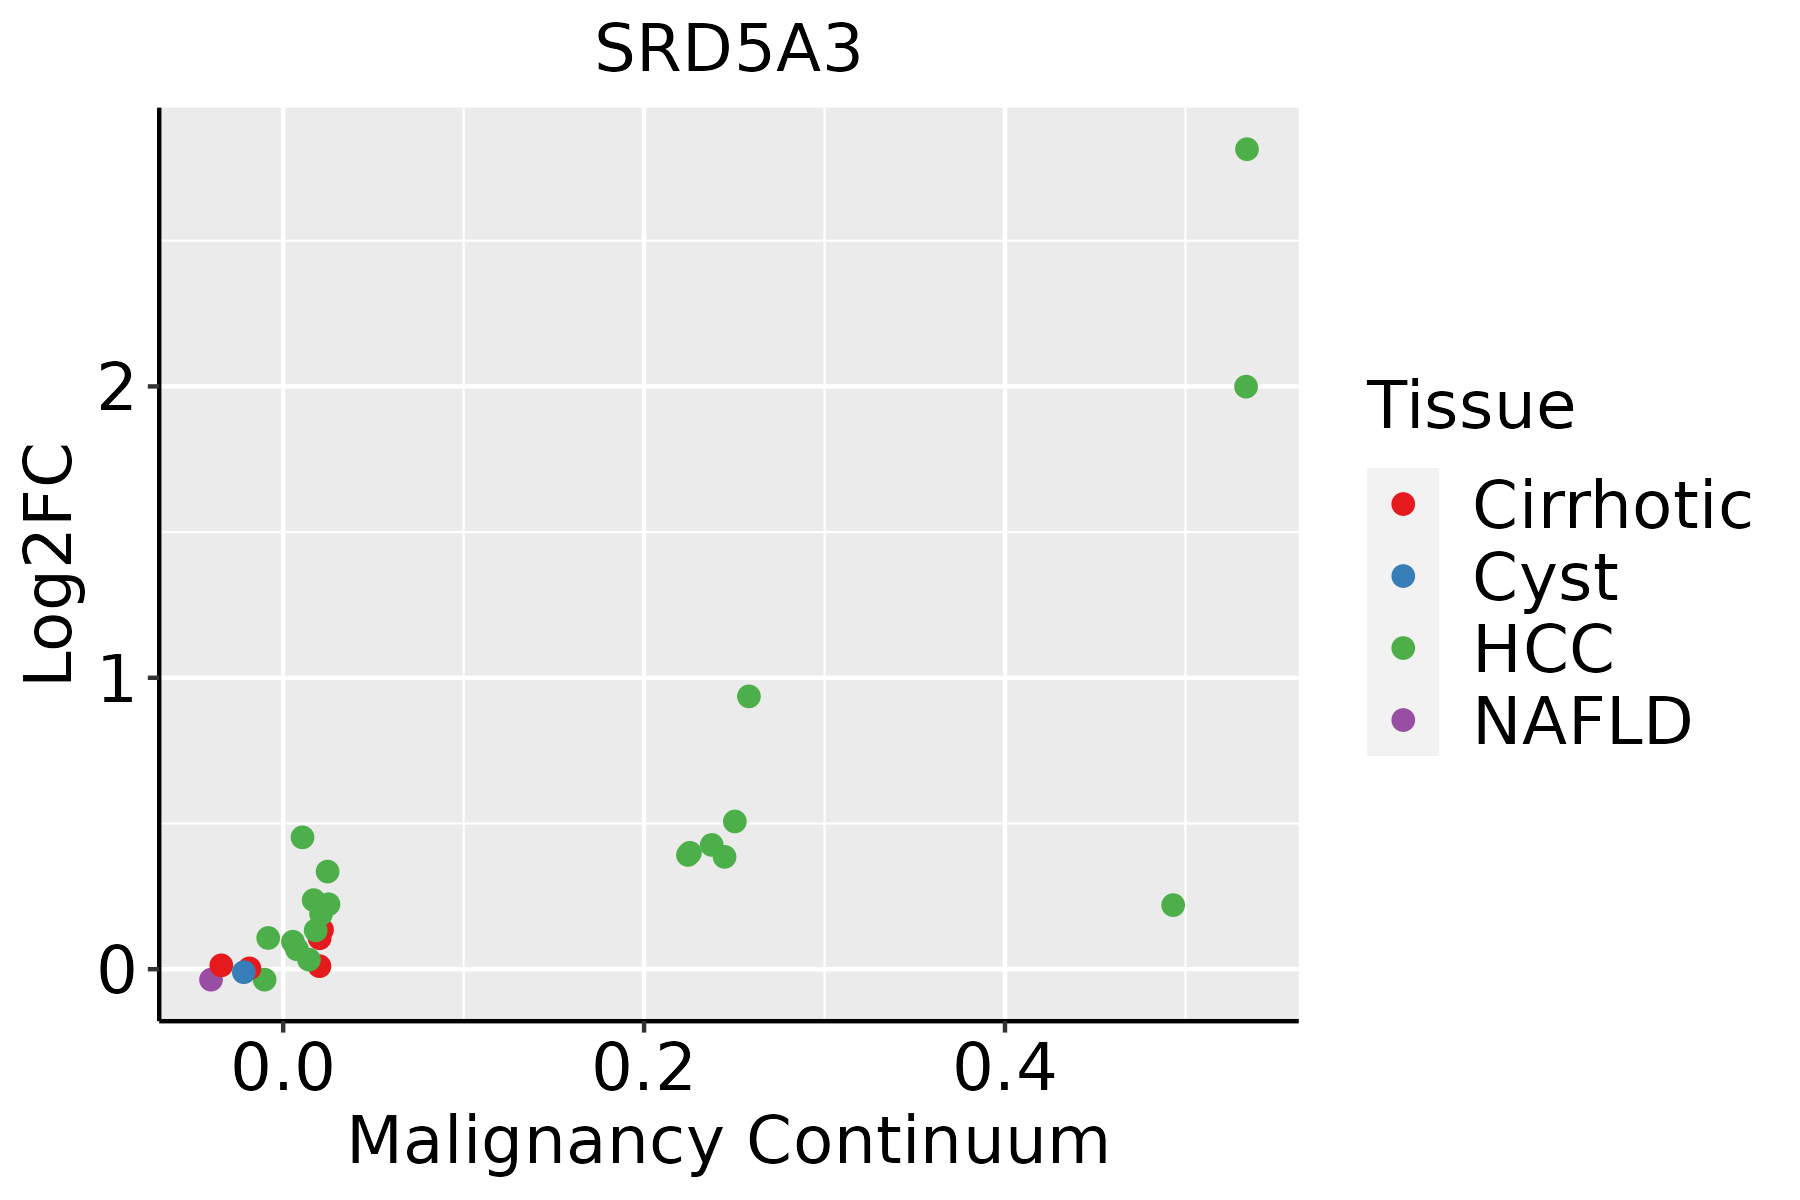 | HCC: Hepatocellular carcinoma |
| NAFLD: Non-alcoholic fatty liver disease | ||
| Oral Cavity | 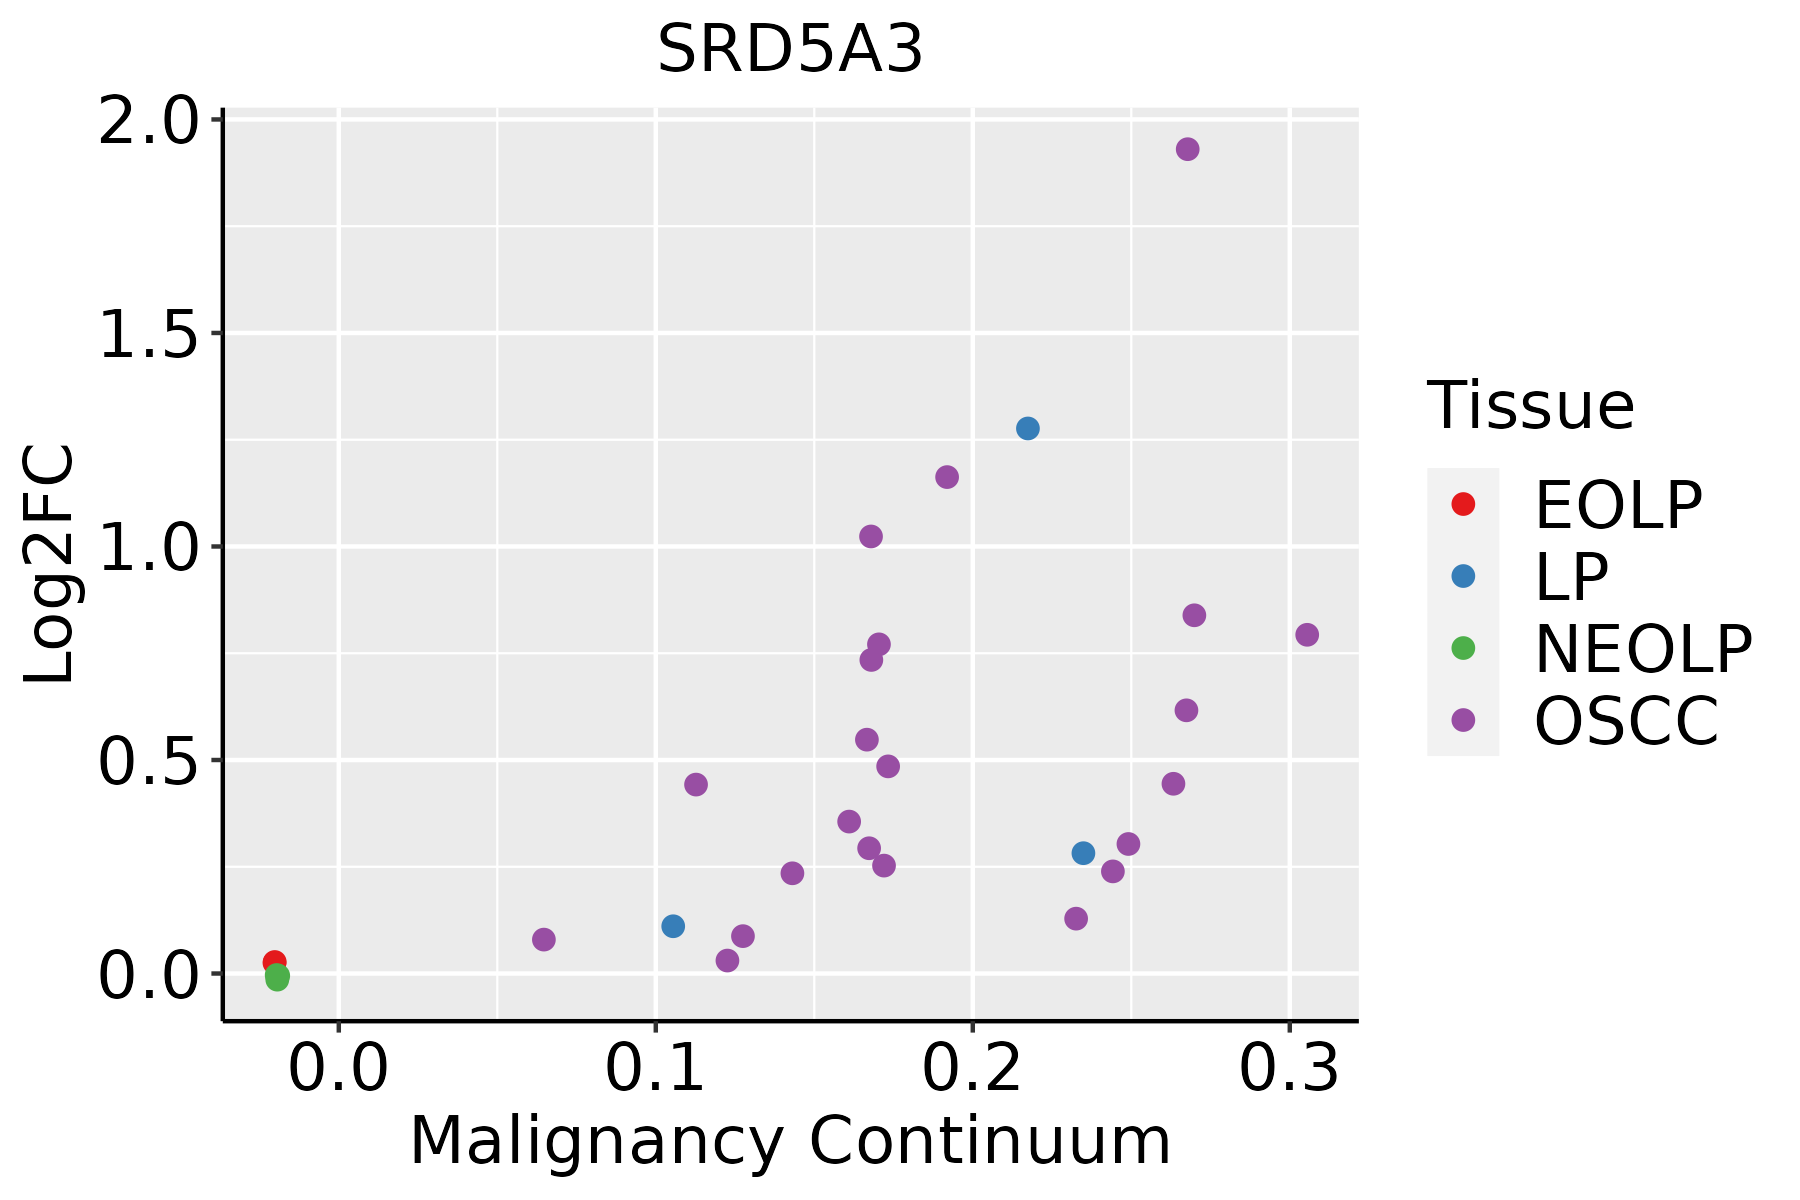 | EOLP: Erosive Oral lichen planus |
| LP: leukoplakia | ||
| NEOLP: Non-erosive oral lichen planus | ||
| OSCC: Oral squamous cell carcinoma | ||
| Skin | 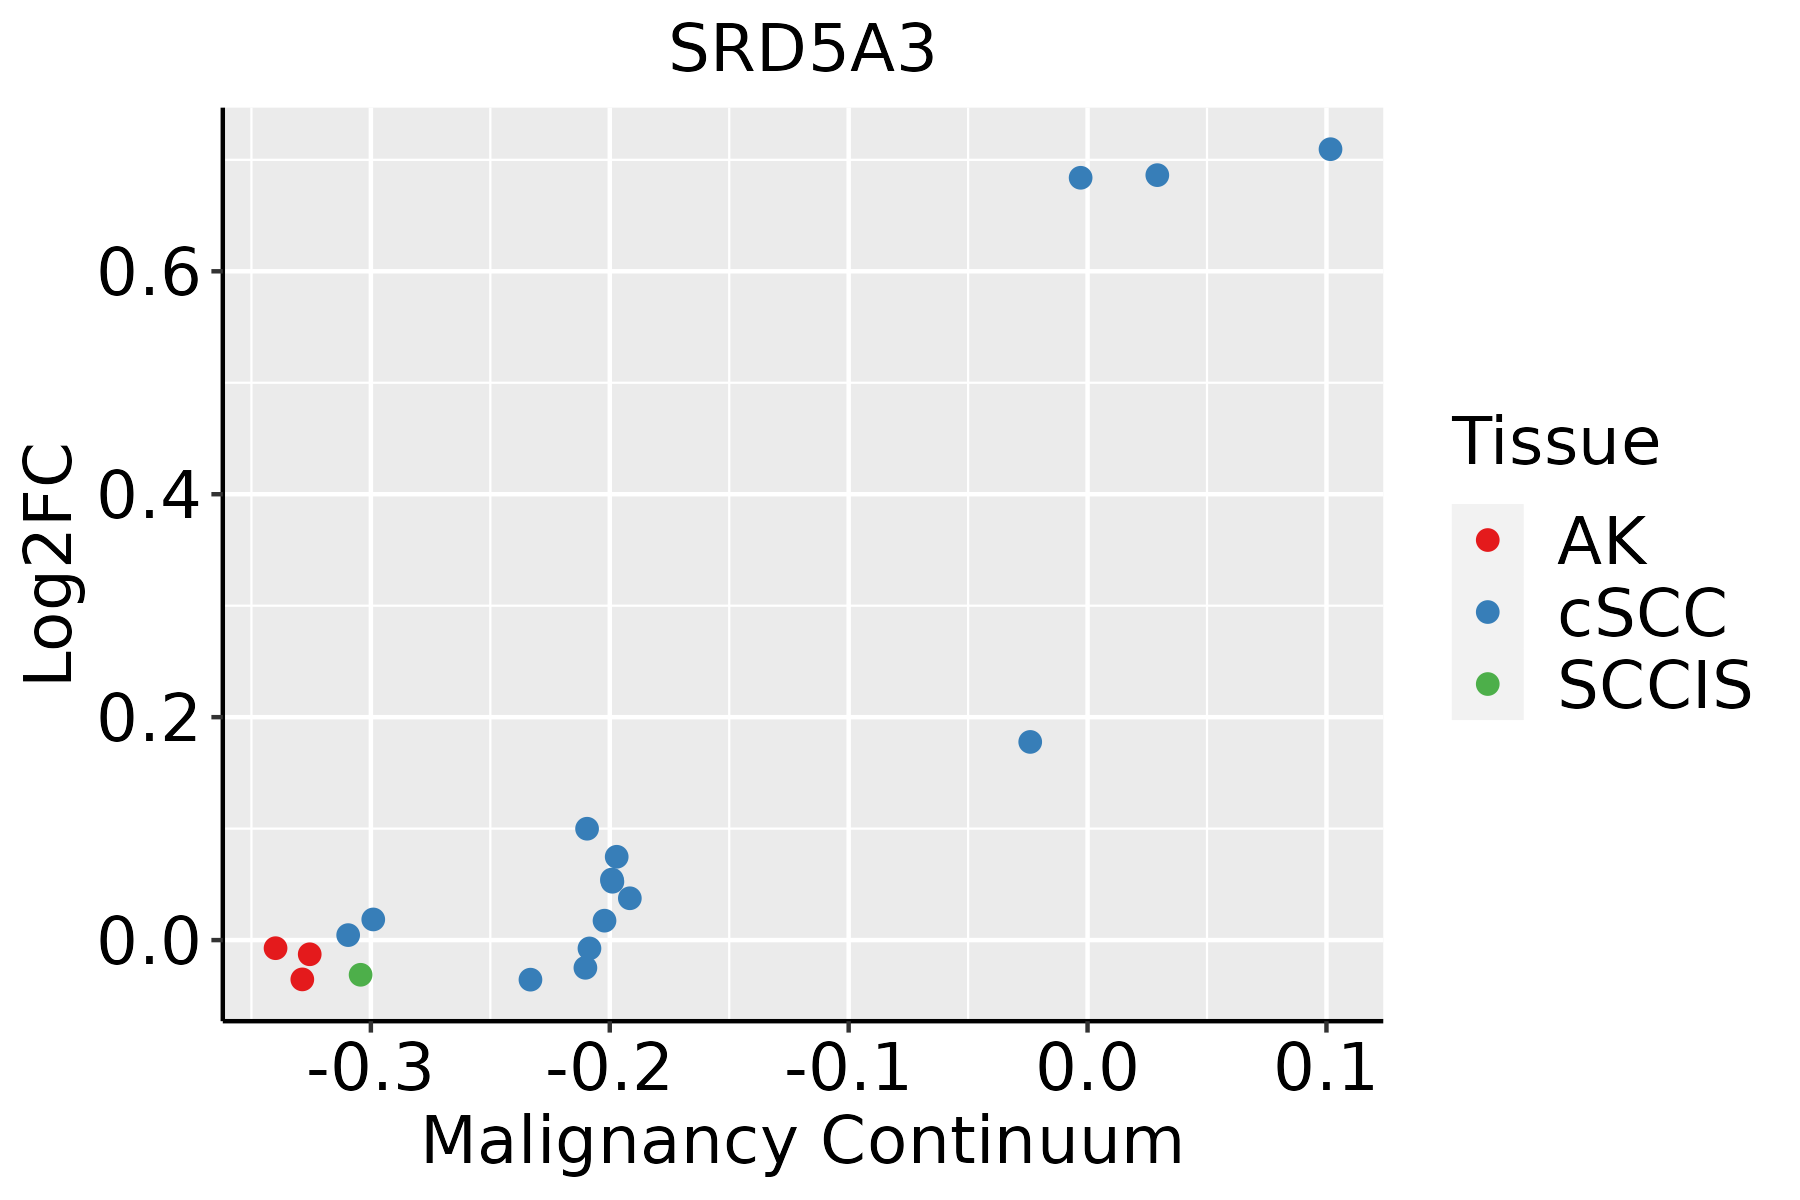 | AK: Actinic keratosis |
| cSCC: Cutaneous squamous cell carcinoma | ||
| SCCIS:squamous cell carcinoma in situ | ||
| Thyroid |  | ATC: Anaplastic thyroid cancer |
| HT: Hashimoto's thyroiditis | ||
| PTC: Papillary thyroid cancer |
| ∗log2FC in expression of this searched gene in stem-like cells from each diseased tissue sample relative to stem-like cells in normal samples in each tissue plotted against the malignancy continuum. Samples are colored based on if they are from different disease stage. |
Top |
Malignant transformation related pathway analysis |
| Find out the enriched GO biological processes and KEGG pathways involved in transition from healthy to precancer to cancer |
| Tissue | Disease Stage | Enriched GO biological Processes |
| Colorectum | AD |  |
| Colorectum | SER |  |
| Colorectum | MSS |  |
| Colorectum | MSI-H |  |
| Colorectum | FAP |  |
| ∗Top 15 enriched GO BP terms are showed in the bar plot of each disease state in each tissue. Each row represents a significant GO biological process which is colored according to the -log10(p.adjust). |
| Page: 1 2 3 4 5 6 7 8 9 |
| GO ID | Tissue | Disease Stage | Description | Gene Ratio | Bg Ratio | pvalue | p.adjust | Count |
| GO:00064876 | Esophagus | HGIN | protein N-linked glycosylation | 17/2587 | 65/18723 | 6.04e-03 | 4.87e-02 | 17 |
| GO:00086544 | Esophagus | ESCC | phospholipid biosynthetic process | 162/8552 | 253/18723 | 2.59e-09 | 5.73e-08 | 162 |
| GO:000648714 | Esophagus | ESCC | protein N-linked glycosylation | 51/8552 | 65/18723 | 6.41e-08 | 1.13e-06 | 51 |
| GO:00091002 | Esophagus | ESCC | glycoprotein metabolic process | 226/8552 | 387/18723 | 2.64e-07 | 3.94e-06 | 226 |
| GO:00700854 | Esophagus | ESCC | glycosylation | 144/8552 | 240/18723 | 5.12e-06 | 5.38e-05 | 144 |
| GO:00066446 | Esophagus | ESCC | phospholipid metabolic process | 218/8552 | 383/18723 | 5.37e-06 | 5.59e-05 | 218 |
| GO:00060668 | Esophagus | ESCC | alcohol metabolic process | 202/8552 | 353/18723 | 7.32e-06 | 7.26e-05 | 202 |
| GO:00064865 | Esophagus | ESCC | protein glycosylation | 135/8552 | 226/18723 | 1.36e-05 | 1.24e-04 | 135 |
| GO:00434135 | Esophagus | ESCC | macromolecule glycosylation | 135/8552 | 226/18723 | 1.36e-05 | 1.24e-04 | 135 |
| GO:00091012 | Esophagus | ESCC | glycoprotein biosynthetic process | 181/8552 | 317/18723 | 2.54e-05 | 2.15e-04 | 181 |
| GO:00461653 | Esophagus | ESCC | alcohol biosynthetic process | 83/8552 | 140/18723 | 8.04e-04 | 4.16e-03 | 83 |
| GO:00442427 | Esophagus | ESCC | cellular lipid catabolic process | 121/8552 | 214/18723 | 8.63e-04 | 4.43e-03 | 121 |
| GO:00442827 | Esophagus | ESCC | small molecule catabolic process | 201/8552 | 376/18723 | 1.35e-03 | 6.41e-03 | 201 |
| GO:00082991 | Esophagus | ESCC | isoprenoid biosynthetic process | 21/8552 | 28/18723 | 1.57e-03 | 7.33e-03 | 21 |
| GO:00066946 | Esophagus | ESCC | steroid biosynthetic process | 98/8552 | 173/18723 | 2.34e-03 | 1.03e-02 | 98 |
| GO:00064882 | Esophagus | ESCC | dolichol-linked oligosaccharide biosynthetic process | 14/8552 | 18/18723 | 5.77e-03 | 2.14e-02 | 14 |
| GO:19016174 | Esophagus | ESCC | organic hydroxy compound biosynthetic process | 128/8552 | 237/18723 | 5.86e-03 | 2.16e-02 | 128 |
| GO:00160427 | Esophagus | ESCC | lipid catabolic process | 168/8552 | 320/18723 | 7.97e-03 | 2.84e-02 | 168 |
| GO:00064902 | Esophagus | ESCC | oligosaccharide-lipid intermediate biosynthetic process | 14/8552 | 19/18723 | 1.27e-02 | 4.21e-02 | 14 |
| GO:004428221 | Liver | HCC | small molecule catabolic process | 225/7958 | 376/18723 | 6.50e-12 | 2.80e-10 | 225 |
| Page: 1 2 3 4 |
| Pathway ID | Tissue | Disease Stage | Description | Gene Ratio | Bg Ratio | pvalue | p.adjust | qvalue | Count |
| hsa0051023 | Esophagus | ESCC | N-Glycan biosynthesis | 39/4205 | 53/8465 | 3.26e-04 | 1.15e-03 | 5.89e-04 | 39 |
| hsa0051033 | Esophagus | ESCC | N-Glycan biosynthesis | 39/4205 | 53/8465 | 3.26e-04 | 1.15e-03 | 5.89e-04 | 39 |
| hsa0051021 | Liver | HCC | N-Glycan biosynthesis | 40/4020 | 53/8465 | 2.95e-05 | 1.87e-04 | 1.04e-04 | 40 |
| hsa0051031 | Liver | HCC | N-Glycan biosynthesis | 40/4020 | 53/8465 | 2.95e-05 | 1.87e-04 | 1.04e-04 | 40 |
| hsa005105 | Oral cavity | OSCC | N-Glycan biosynthesis | 39/3704 | 53/8465 | 9.77e-06 | 4.36e-05 | 2.22e-05 | 39 |
| hsa0051012 | Oral cavity | OSCC | N-Glycan biosynthesis | 39/3704 | 53/8465 | 9.77e-06 | 4.36e-05 | 2.22e-05 | 39 |
| hsa0051022 | Oral cavity | LP | N-Glycan biosynthesis | 31/2418 | 53/8465 | 4.86e-06 | 4.14e-05 | 2.67e-05 | 31 |
| hsa0051032 | Oral cavity | LP | N-Glycan biosynthesis | 31/2418 | 53/8465 | 4.86e-06 | 4.14e-05 | 2.67e-05 | 31 |
| Page: 1 |
Top |
Cell-cell communication analysis |
| Identification of potential cell-cell interactions between two cell types and their ligand-receptor pairs for different disease states |
| Ligand | Receptor | LRpair | Pathway | Tissue | Disease Stage |
| Page: 1 |
Top |
Single-cell gene regulatory network inference analysis |
| Find out the significant the regulons (TFs) and the target genes of each regulon across cell types for different disease states |
| TF | Cell Type | Tissue | Disease Stage | Target Gene | RSS | Regulon Activity |
| ∗The dot plots of a searched regulon are shown for all cell subpopulations in each disease state of each tissue based on the regulon specific score inferred using pySCENIC and by calculating the average expression. |
| Page: 1 |
Top |
Somatic mutation of malignant transformation related genes |
| Annotation of somatic variants for genes involved in malignant transformation |
| Hugo Symbol | Variant Class | Variant Classification | dbSNP RS | HGVSc | HGVSp | HGVSp Short | SWISSPROT | BIOTYPE | SIFT | PolyPhen | Tumor Sample Barcode | Tissue | Histology | Sex | Age | Stage | Therapy Types | Drugs | Outcome |
| SRD5A3 | SNV | Missense_Mutation | c.135C>G | p.Ile45Met | p.I45M | Q9H8P0 | protein_coding | deleterious(0.01) | benign(0.054) | TCGA-C5-A1M6-01 | Cervix | cervical & endocervical cancer | Female | <65 | I/II | Chemotherapy | cisplatin | PD | |
| SRD5A3 | SNV | Missense_Mutation | c.613N>A | p.Leu205Ile | p.L205I | Q9H8P0 | protein_coding | tolerated(0.22) | benign(0.268) | TCGA-FU-A3HZ-01 | Cervix | cervical & endocervical cancer | Female | <65 | I/II | Chemotherapy | cisplatin | CR | |
| SRD5A3 | SNV | Missense_Mutation | novel | c.794C>A | p.Ser265Tyr | p.S265Y | Q9H8P0 | protein_coding | deleterious(0) | probably_damaging(0.999) | TCGA-VS-A9UC-01 | Cervix | cervical & endocervical cancer | Female | <65 | I/II | Chemotherapy | cisplatin | SD |
| SRD5A3 | SNV | Missense_Mutation | novel | c.106N>T | p.Pro36Ser | p.P36S | Q9H8P0 | protein_coding | tolerated(0.32) | probably_damaging(0.994) | TCGA-ZX-AA5X-01 | Cervix | cervical & endocervical cancer | Female | <65 | III/IV | Unknown | Unknown | SD |
| SRD5A3 | SNV | Missense_Mutation | novel | c.46N>T | p.Arg16Cys | p.R16C | Q9H8P0 | protein_coding | deleterious(0.03) | benign(0.333) | TCGA-CM-4743-01 | Colorectum | colon adenocarcinoma | Male | >=65 | I/II | Chemotherapy | capecitabine | SD |
| SRD5A3 | SNV | Missense_Mutation | novel | c.896A>G | p.Tyr299Cys | p.Y299C | Q9H8P0 | protein_coding | deleterious(0.03) | possibly_damaging(0.79) | TCGA-A5-A0G1-01 | Endometrium | uterine corpus endometrioid carcinoma | Female | >=65 | I/II | Unknown | Unknown | SD |
| SRD5A3 | SNV | Missense_Mutation | novel | c.229N>C | p.Ser77Pro | p.S77P | Q9H8P0 | protein_coding | tolerated(0.2) | benign(0.322) | TCGA-A5-A2K7-01 | Endometrium | uterine corpus endometrioid carcinoma | Female | <65 | I/II | Chemotherapy | taxol | SD |
| SRD5A3 | SNV | Missense_Mutation | novel | c.583N>A | p.Leu195Ile | p.L195I | Q9H8P0 | protein_coding | deleterious(0.04) | possibly_damaging(0.861) | TCGA-AJ-A5DW-01 | Endometrium | uterine corpus endometrioid carcinoma | Female | <65 | I/II | Unknown | Unknown | SD |
| SRD5A3 | SNV | Missense_Mutation | rs748408459 | c.673N>A | p.Gly225Ser | p.G225S | Q9H8P0 | protein_coding | tolerated(0.21) | benign(0.006) | TCGA-AP-A059-01 | Endometrium | uterine corpus endometrioid carcinoma | Female | >=65 | I/II | Unknown | Unknown | SD |
| SRD5A3 | SNV | Missense_Mutation | novel | c.532N>A | p.Leu178Met | p.L178M | Q9H8P0 | protein_coding | tolerated(0.07) | probably_damaging(0.942) | TCGA-AX-A0J1-01 | Endometrium | uterine corpus endometrioid carcinoma | Female | >=65 | I/II | Unknown | Unknown | SD |
| Page: 1 2 3 |
Top |
Related drugs of malignant transformation related genes |
| Identification of chemicals and drugs interact with genes involved in malignant transfromation |
| (DGIdb 4.0) |
| Entrez ID | Symbol | Category | Interaction Types | Drug Claim Name | Drug Name | PMIDs |
| 79644 | SRD5A3 | ENZYME, DRUGGABLE GENOME | inhibitor | CHEMBL1200969 | DUTASTERIDE |
| Page: 1 |

Copyright 2023-Present -The University of Texas Health Science Center at Houston |