
|
|||||
|
 | |
| |
| |
| |
| |
| |
|
Gene: SRCAP |
Gene summary for SRCAP |
| Gene information | Species | Human | Gene symbol | SRCAP | Gene ID | 10847 |
| Gene name | Snf2 related CREBBP activator protein | |
| Gene Alias | DOMO1 | |
| Cytomap | 16p11.2 | |
| Gene Type | protein-coding | GO ID | GO:0006139 | UniProtAcc | Q6ZRS2 |
Top |
Malignant transformation analysis |
| Identification of the aberrant gene expression in precancerous and cancerous lesions by comparing the gene expression of stem-like cells in diseased tissues with normal stem cells |
| Entrez ID | Symbol | Replicates | Species | Organ | Tissue | Adj P-value | Log2FC | Malignancy |
| 10847 | SRCAP | LZE4T | Human | Esophagus | ESCC | 4.42e-05 | 1.80e-01 | 0.0811 |
| 10847 | SRCAP | LZE7T | Human | Esophagus | ESCC | 3.55e-14 | 5.51e-01 | 0.0667 |
| 10847 | SRCAP | LZE8T | Human | Esophagus | ESCC | 1.89e-10 | 4.02e-01 | 0.067 |
| 10847 | SRCAP | LZE20T | Human | Esophagus | ESCC | 3.83e-07 | 2.89e-01 | 0.0662 |
| 10847 | SRCAP | LZE21D1 | Human | Esophagus | HGIN | 2.01e-03 | 2.50e-01 | 0.0632 |
| 10847 | SRCAP | LZE22T | Human | Esophagus | ESCC | 3.09e-03 | 2.95e-01 | 0.068 |
| 10847 | SRCAP | LZE24T | Human | Esophagus | ESCC | 1.43e-31 | 7.61e-01 | 0.0596 |
| 10847 | SRCAP | LZE21T | Human | Esophagus | ESCC | 3.32e-05 | 3.31e-01 | 0.0655 |
| 10847 | SRCAP | LZE6T | Human | Esophagus | ESCC | 3.42e-05 | 2.98e-01 | 0.0845 |
| 10847 | SRCAP | P1T-E | Human | Esophagus | ESCC | 6.40e-06 | 3.00e-01 | 0.0875 |
| 10847 | SRCAP | P2T-E | Human | Esophagus | ESCC | 1.35e-23 | 3.51e-01 | 0.1177 |
| 10847 | SRCAP | P5T-E | Human | Esophagus | ESCC | 2.68e-08 | 1.14e-01 | 0.1327 |
| 10847 | SRCAP | P8T-E | Human | Esophagus | ESCC | 2.26e-06 | 1.47e-01 | 0.0889 |
| 10847 | SRCAP | P9T-E | Human | Esophagus | ESCC | 3.31e-03 | 7.41e-02 | 0.1131 |
| 10847 | SRCAP | P11T-E | Human | Esophagus | ESCC | 6.36e-08 | 3.50e-01 | 0.1426 |
| 10847 | SRCAP | P12T-E | Human | Esophagus | ESCC | 3.05e-04 | 1.56e-01 | 0.1122 |
| 10847 | SRCAP | P15T-E | Human | Esophagus | ESCC | 2.96e-04 | 7.42e-02 | 0.1149 |
| 10847 | SRCAP | P16T-E | Human | Esophagus | ESCC | 2.00e-04 | 9.47e-02 | 0.1153 |
| 10847 | SRCAP | P20T-E | Human | Esophagus | ESCC | 3.58e-14 | 2.66e-01 | 0.1124 |
| 10847 | SRCAP | P21T-E | Human | Esophagus | ESCC | 1.10e-05 | 1.41e-01 | 0.1617 |
| Page: 1 2 3 |
| Tissue | Expression Dynamics | Abbreviation |
| Esophagus |  | ESCC: Esophageal squamous cell carcinoma |
| HGIN: High-grade intraepithelial neoplasias | ||
| LGIN: Low-grade intraepithelial neoplasias | ||
| Liver | 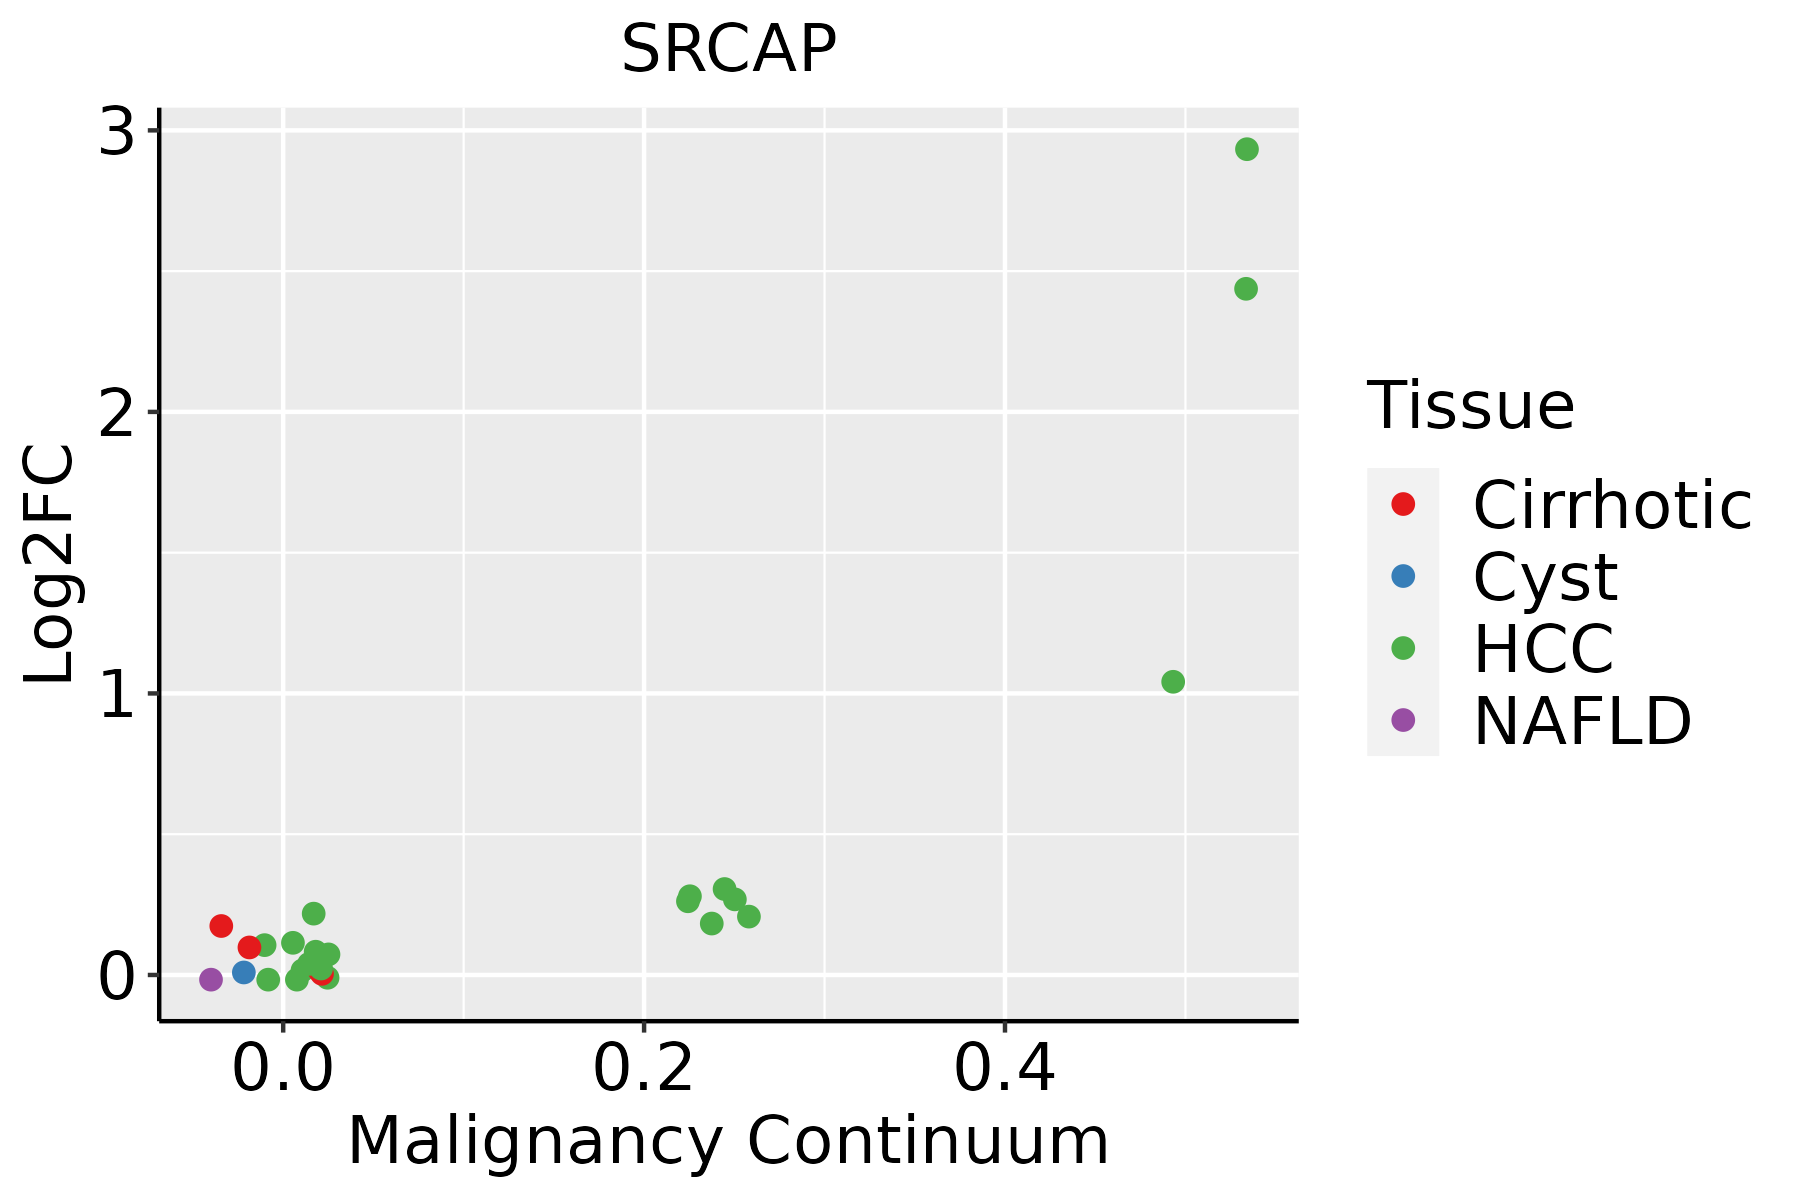 | HCC: Hepatocellular carcinoma |
| NAFLD: Non-alcoholic fatty liver disease | ||
| Skin | 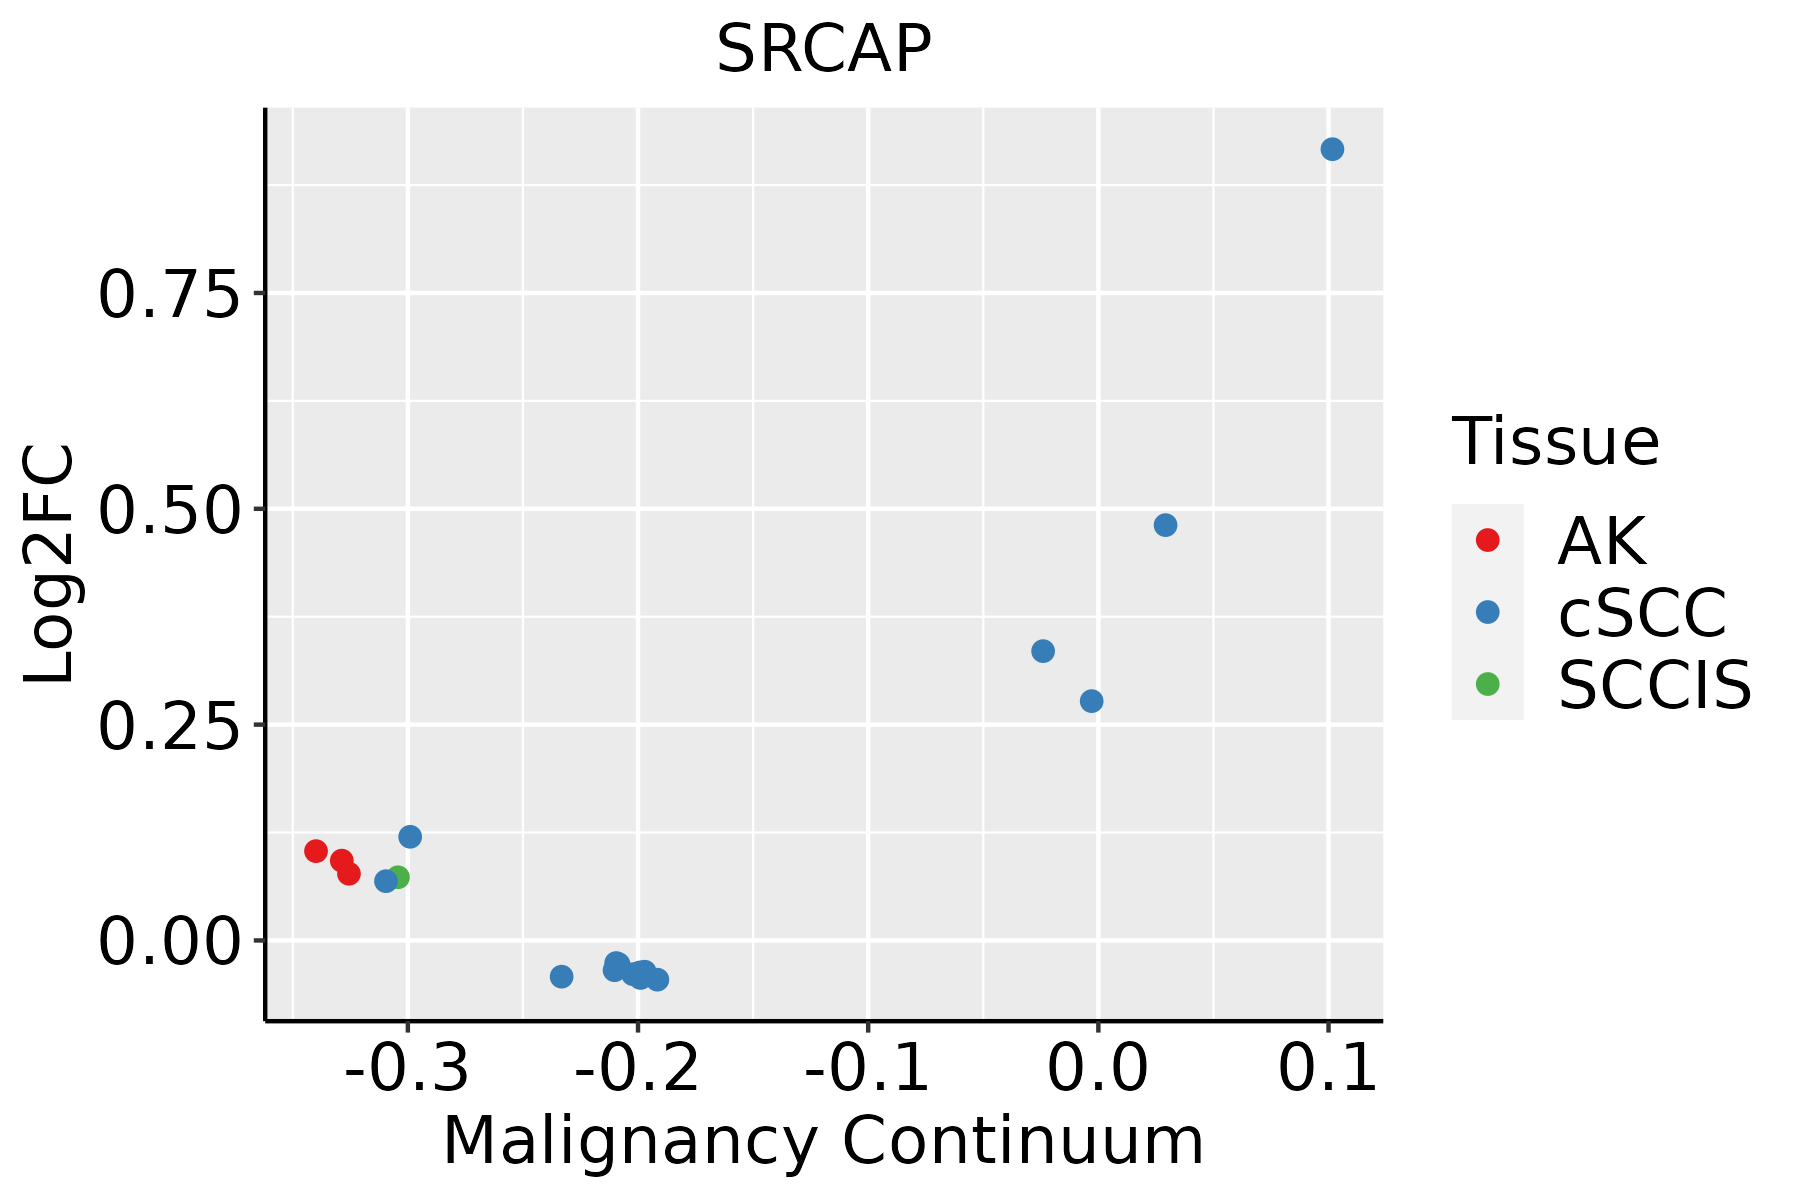 | AK: Actinic keratosis |
| cSCC: Cutaneous squamous cell carcinoma | ||
| SCCIS:squamous cell carcinoma in situ |
| ∗log2FC in expression of this searched gene in stem-like cells from each diseased tissue sample relative to stem-like cells in normal samples in each tissue plotted against the malignancy continuum. Samples are colored based on if they are from different disease stage. |
Top |
Malignant transformation related pathway analysis |
| Find out the enriched GO biological processes and KEGG pathways involved in transition from healthy to precancer to cancer |
| Tissue | Disease Stage | Enriched GO biological Processes |
| Colorectum | AD |  |
| Colorectum | SER |  |
| Colorectum | MSS |  |
| Colorectum | MSI-H |  |
| Colorectum | FAP |  |
| ∗Top 15 enriched GO BP terms are showed in the bar plot of each disease state in each tissue. Each row represents a significant GO biological process which is colored according to the -log10(p.adjust). |
| Page: 1 2 3 4 5 6 7 8 9 |
| GO ID | Tissue | Disease Stage | Description | Gene Ratio | Bg Ratio | pvalue | p.adjust | Count |
| GO:00182057 | Esophagus | HGIN | peptidyl-lysine modification | 88/2587 | 376/18723 | 2.99e-07 | 1.39e-05 | 88 |
| GO:000632516 | Esophagus | HGIN | chromatin organization | 92/2587 | 409/18723 | 1.05e-06 | 4.16e-05 | 92 |
| GO:00165708 | Esophagus | HGIN | histone modification | 92/2587 | 463/18723 | 1.70e-04 | 3.30e-03 | 92 |
| GO:00064735 | Esophagus | HGIN | protein acetylation | 45/2587 | 201/18723 | 6.17e-04 | 8.58e-03 | 45 |
| GO:00183945 | Esophagus | HGIN | peptidyl-lysine acetylation | 39/2587 | 169/18723 | 7.46e-04 | 9.90e-03 | 39 |
| GO:00435435 | Esophagus | HGIN | protein acylation | 51/2587 | 243/18723 | 1.33e-03 | 1.57e-02 | 51 |
| GO:00064755 | Esophagus | HGIN | internal protein amino acid acetylation | 36/2587 | 160/18723 | 1.87e-03 | 2.01e-02 | 36 |
| GO:00183935 | Esophagus | HGIN | internal peptidyl-lysine acetylation | 35/2587 | 158/18723 | 2.82e-03 | 2.75e-02 | 35 |
| GO:001657015 | Esophagus | ESCC | histone modification | 323/8552 | 463/18723 | 2.61e-26 | 7.88e-24 | 323 |
| GO:001820514 | Esophagus | ESCC | peptidyl-lysine modification | 259/8552 | 376/18723 | 3.90e-20 | 5.26e-18 | 259 |
| GO:001839413 | Esophagus | ESCC | peptidyl-lysine acetylation | 123/8552 | 169/18723 | 6.58e-13 | 2.94e-11 | 123 |
| GO:004354313 | Esophagus | ESCC | protein acylation | 165/8552 | 243/18723 | 1.69e-12 | 7.14e-11 | 165 |
| GO:000647313 | Esophagus | ESCC | protein acetylation | 140/8552 | 201/18723 | 4.37e-12 | 1.69e-10 | 140 |
| GO:001839313 | Esophagus | ESCC | internal peptidyl-lysine acetylation | 114/8552 | 158/18723 | 1.16e-11 | 4.24e-10 | 114 |
| GO:000647513 | Esophagus | ESCC | internal protein amino acid acetylation | 115/8552 | 160/18723 | 1.43e-11 | 5.08e-10 | 115 |
| GO:00165735 | Esophagus | ESCC | histone acetylation | 110/8552 | 152/18723 | 1.95e-11 | 6.81e-10 | 110 |
| GO:000632517 | Esophagus | ESCC | chromatin organization | 240/8552 | 409/18723 | 6.52e-08 | 1.14e-06 | 240 |
| GO:0043486 | Esophagus | ESCC | histone exchange | 16/8552 | 22/18723 | 9.46e-03 | 3.28e-02 | 16 |
| GO:001657021 | Liver | HCC | histone modification | 283/7958 | 463/18723 | 2.68e-16 | 2.33e-14 | 283 |
| GO:00182052 | Liver | HCC | peptidyl-lysine modification | 230/7958 | 376/18723 | 1.51e-13 | 8.32e-12 | 230 |
| Page: 1 2 |
| Pathway ID | Tissue | Disease Stage | Description | Gene Ratio | Bg Ratio | pvalue | p.adjust | qvalue | Count |
| Page: 1 |
Top |
Cell-cell communication analysis |
| Identification of potential cell-cell interactions between two cell types and their ligand-receptor pairs for different disease states |
| Ligand | Receptor | LRpair | Pathway | Tissue | Disease Stage |
| Page: 1 |
Top |
Single-cell gene regulatory network inference analysis |
| Find out the significant the regulons (TFs) and the target genes of each regulon across cell types for different disease states |
| TF | Cell Type | Tissue | Disease Stage | Target Gene | RSS | Regulon Activity |
| ∗The dot plots of a searched regulon are shown for all cell subpopulations in each disease state of each tissue based on the regulon specific score inferred using pySCENIC and by calculating the average expression. |
| Page: 1 |
Top |
Somatic mutation of malignant transformation related genes |
| Annotation of somatic variants for genes involved in malignant transformation |
| Hugo Symbol | Variant Class | Variant Classification | dbSNP RS | HGVSc | HGVSp | HGVSp Short | SWISSPROT | BIOTYPE | SIFT | PolyPhen | Tumor Sample Barcode | Tissue | Histology | Sex | Age | Stage | Therapy Types | Drugs | Outcome |
| SRCAP | SNV | Missense_Mutation | c.1183C>T | p.His395Tyr | p.H395Y | Q6ZRS2 | protein_coding | deleterious_low_confidence(0.04) | benign(0.188) | TCGA-A2-A0CU-01 | Breast | breast invasive carcinoma | Female | >=65 | I/II | Hormone Therapy | tamoxiphen | SD | |
| SRCAP | SNV | Missense_Mutation | novel | c.3529G>T | p.Ala1177Ser | p.A1177S | Q6ZRS2 | protein_coding | deleterious(0.01) | probably_damaging(0.994) | TCGA-A8-A095-01 | Breast | breast invasive carcinoma | Female | <65 | I/II | Chemotherapy | 5-fluorouracil | CR |
| SRCAP | SNV | Missense_Mutation | c.6787G>A | p.Glu2263Lys | p.E2263K | Q6ZRS2 | protein_coding | deleterious(0) | probably_damaging(0.994) | TCGA-A8-A09G-01 | Breast | breast invasive carcinoma | Female | >=65 | III/IV | Unknown | Unknown | SD | |
| SRCAP | SNV | Missense_Mutation | c.8149N>A | p.Ala2717Thr | p.A2717T | Q6ZRS2 | protein_coding | tolerated_low_confidence(0.12) | benign(0.005) | TCGA-A8-A09Z-01 | Breast | breast invasive carcinoma | Female | >=65 | I/II | Unknown | Unknown | SD | |
| SRCAP | SNV | Missense_Mutation | c.5224N>G | p.Pro1742Ala | p.P1742A | Q6ZRS2 | protein_coding | deleterious_low_confidence(0.03) | benign(0.081) | TCGA-AC-A23H-01 | Breast | breast invasive carcinoma | Female | >=65 | I/II | Unknown | Unknown | PD | |
| SRCAP | SNV | Missense_Mutation | c.5731N>T | p.His1911Tyr | p.H1911Y | Q6ZRS2 | protein_coding | deleterious(0.01) | benign(0.328) | TCGA-AC-A23H-01 | Breast | breast invasive carcinoma | Female | >=65 | I/II | Unknown | Unknown | PD | |
| SRCAP | SNV | Missense_Mutation | novel | c.3529N>T | p.Ala1177Ser | p.A1177S | Q6ZRS2 | protein_coding | deleterious(0.01) | probably_damaging(0.994) | TCGA-AN-A0FV-01 | Breast | breast invasive carcinoma | Female | <65 | I/II | Unknown | Unknown | SD |
| SRCAP | SNV | Missense_Mutation | c.565G>A | p.Ala189Thr | p.A189T | Q6ZRS2 | protein_coding | deleterious(0.05) | possibly_damaging(0.698) | TCGA-AN-A0XR-01 | Breast | breast invasive carcinoma | Female | <65 | III/IV | Unknown | Unknown | SD | |
| SRCAP | SNV | Missense_Mutation | c.1349A>T | p.Gln450Leu | p.Q450L | Q6ZRS2 | protein_coding | tolerated(0.14) | benign(0) | TCGA-AO-A03T-01 | Breast | breast invasive carcinoma | Female | <65 | I/II | Chemotherapy | cyclophosphamide | SD | |
| SRCAP | SNV | Missense_Mutation | rs773086154 | c.7249N>A | p.Ala2417Thr | p.A2417T | Q6ZRS2 | protein_coding | tolerated_low_confidence(1) | benign(0) | TCGA-AO-A128-01 | Breast | breast invasive carcinoma | Female | <65 | I/II | Chemotherapy | doxorubicin | SD |
| Page: 1 2 3 4 5 6 7 8 9 10 11 12 13 14 15 16 17 18 19 20 21 22 23 24 25 26 27 28 29 30 31 32 33 34 35 36 37 38 |
Top |
Related drugs of malignant transformation related genes |
| Identification of chemicals and drugs interact with genes involved in malignant transfromation |
| (DGIdb 4.0) |
| Entrez ID | Symbol | Category | Interaction Types | Drug Claim Name | Drug Name | PMIDs |
| Page: 1 |

Copyright 2023-Present -The University of Texas Health Science Center at Houston |