
|
|||||
|
 | |
| |
| |
| |
| |
| |
|
Gene: SRARP |
Gene summary for SRARP |
| Gene information | Species | Human | Gene symbol | SRARP | Gene ID | 149563 |
| Gene name | steroid receptor associated and regulated protein | |
| Gene Alias | C1orf64 | |
| Cytomap | 1p36.13 | |
| Gene Type | protein-coding | GO ID | GO:0007154 | UniProtAcc | Q8NEQ6 |
Top |
Malignant transformation analysis |
| Identification of the aberrant gene expression in precancerous and cancerous lesions by comparing the gene expression of stem-like cells in diseased tissues with normal stem cells |
| Entrez ID | Symbol | Replicates | Species | Organ | Tissue | Adj P-value | Log2FC | Malignancy |
| 149563 | SRARP | GSM4909293 | Human | Breast | IDC | 1.24e-10 | 2.05e-01 | 0.1581 |
| 149563 | SRARP | GSM4909294 | Human | Breast | IDC | 1.56e-05 | 2.22e-01 | 0.2022 |
| 149563 | SRARP | GSM4909297 | Human | Breast | IDC | 3.22e-07 | 3.83e-01 | 0.1517 |
| 149563 | SRARP | GSM4909298 | Human | Breast | IDC | 7.41e-66 | 9.32e-01 | 0.1551 |
| 149563 | SRARP | GSM4909303 | Human | Breast | IDC | 5.47e-05 | 2.76e-01 | 0.0438 |
| 149563 | SRARP | GSM4909305 | Human | Breast | IDC | 3.94e-06 | 2.46e-01 | 0.0436 |
| 149563 | SRARP | GSM4909306 | Human | Breast | IDC | 7.59e-57 | 8.50e-01 | 0.1564 |
| 149563 | SRARP | GSM4909312 | Human | Breast | IDC | 1.33e-05 | 3.14e-01 | 0.1552 |
| 149563 | SRARP | GSM4909317 | Human | Breast | IDC | 6.27e-13 | 3.31e-01 | 0.1355 |
| 149563 | SRARP | GSM4909318 | Human | Breast | IDC | 4.84e-08 | 6.55e-01 | 0.2031 |
| 149563 | SRARP | M5 | Human | Breast | IDC | 2.87e-05 | 5.32e-01 | 0.1598 |
| 149563 | SRARP | NCCBC11 | Human | Breast | DCIS | 1.93e-02 | 3.48e-01 | 0.1232 |
| 149563 | SRARP | NCCBC14 | Human | Breast | DCIS | 2.98e-03 | 2.72e-01 | 0.2021 |
| 149563 | SRARP | S014 | Human | Liver | HCC | 2.70e-55 | 1.54e+00 | 0.2254 |
| 149563 | SRARP | S015 | Human | Liver | HCC | 7.07e-56 | 2.38e+00 | 0.2375 |
| 149563 | SRARP | S016 | Human | Liver | HCC | 2.45e-59 | 1.71e+00 | 0.2243 |
| Page: 1 |
| Tissue | Expression Dynamics | Abbreviation |
| Breast |  | IDC: Invasive ductal carcinoma |
| DCIS: Ductal carcinoma in situ | ||
| Precancer(BRCA1-mut): Precancerous lesion from BRCA1 mutation carriers | ||
| Liver | 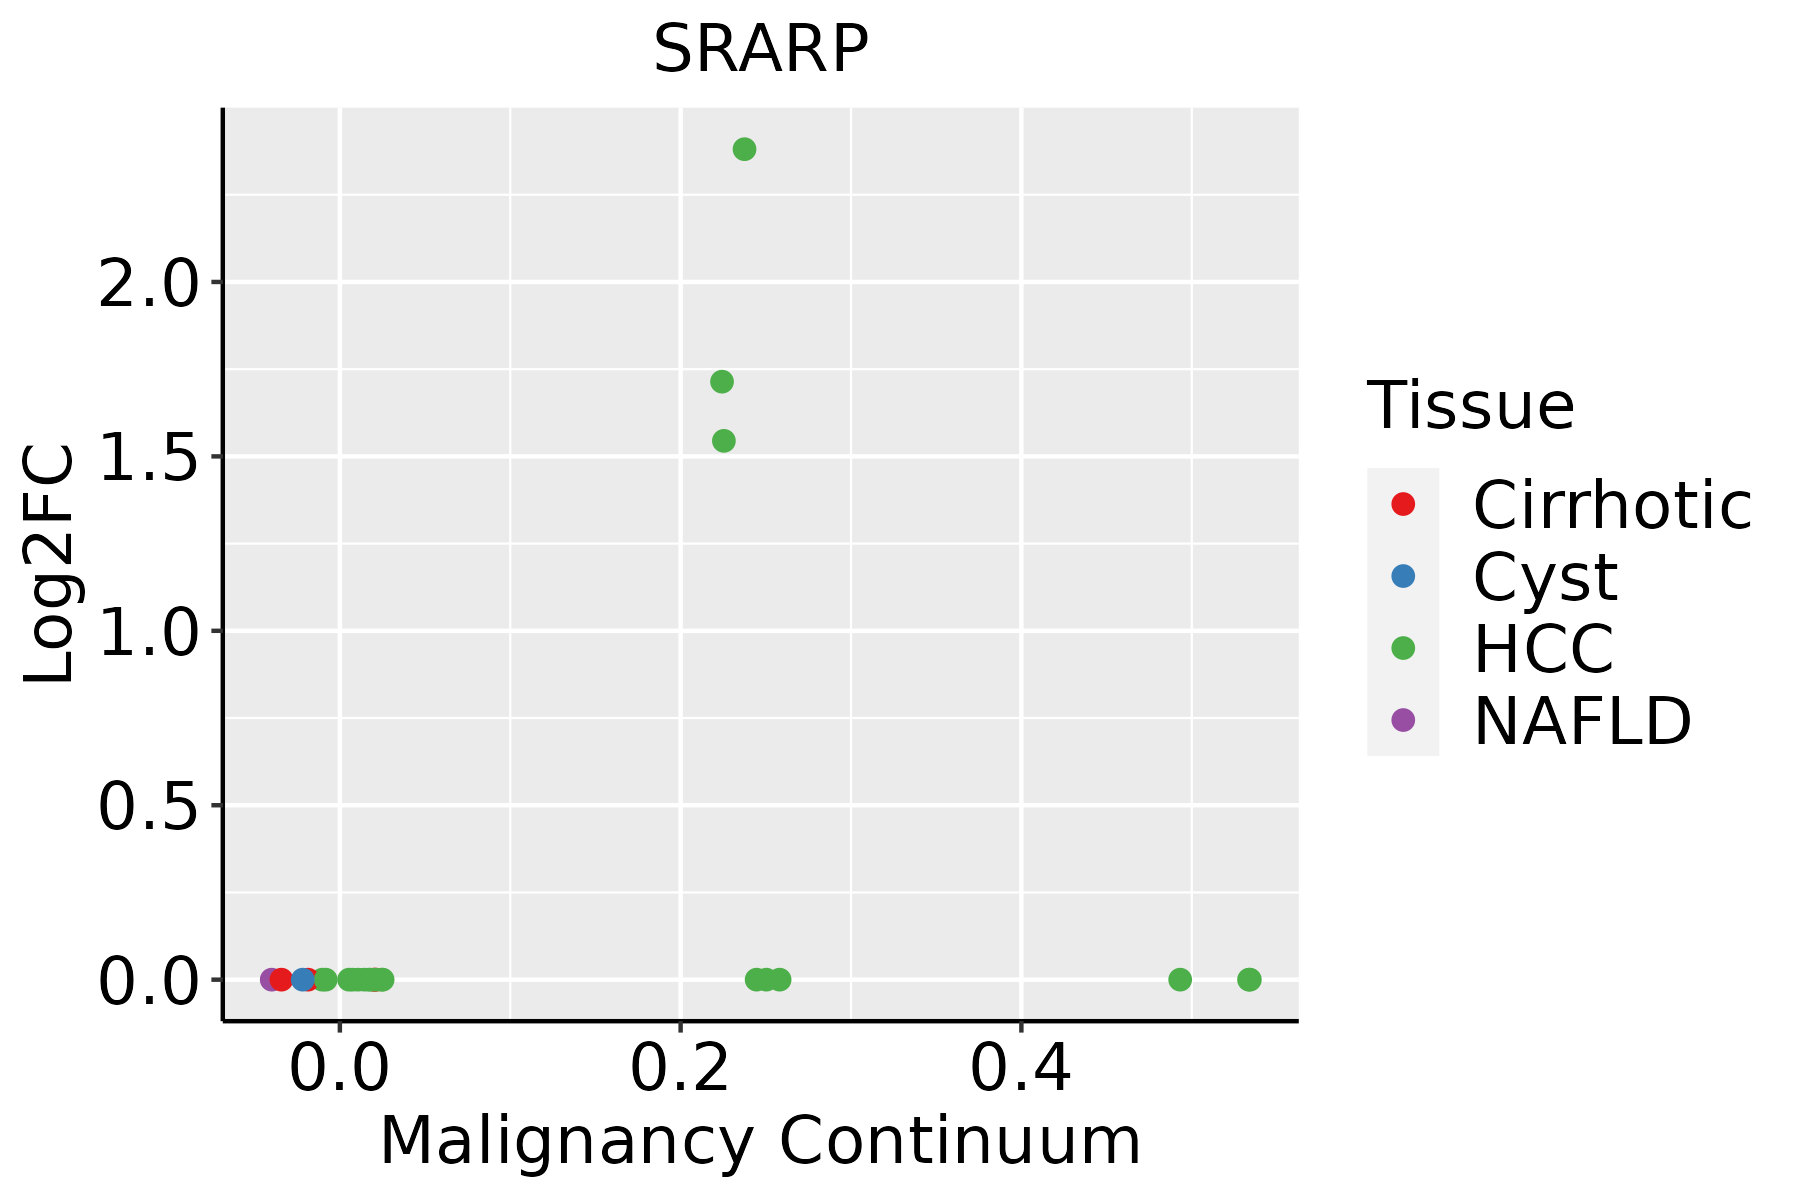 | HCC: Hepatocellular carcinoma |
| NAFLD: Non-alcoholic fatty liver disease |
| ∗log2FC in expression of this searched gene in stem-like cells from each diseased tissue sample relative to stem-like cells in normal samples in each tissue plotted against the malignancy continuum. Samples are colored based on if they are from different disease stage. |
Top |
Malignant transformation related pathway analysis |
| Find out the enriched GO biological processes and KEGG pathways involved in transition from healthy to precancer to cancer |
| Tissue | Disease Stage | Enriched GO biological Processes |
| Colorectum | AD |  |
| Colorectum | SER |  |
| Colorectum | MSS |  |
| Colorectum | MSI-H |  |
| Colorectum | FAP |  |
| ∗Top 15 enriched GO BP terms are showed in the bar plot of each disease state in each tissue. Each row represents a significant GO biological process which is colored according to the -log10(p.adjust). |
| Page: 1 2 3 4 5 6 7 8 9 |
| GO ID | Tissue | Disease Stage | Description | Gene Ratio | Bg Ratio | pvalue | p.adjust | Count |
| GO:004854514 | Breast | IDC | response to steroid hormone | 70/1434 | 339/18723 | 1.34e-14 | 4.23e-12 | 70 |
| GO:007138314 | Breast | IDC | cellular response to steroid hormone stimulus | 35/1434 | 204/18723 | 5.29e-06 | 1.75e-04 | 35 |
| GO:003051813 | Breast | IDC | intracellular steroid hormone receptor signaling pathway | 22/1434 | 116/18723 | 6.16e-05 | 1.28e-03 | 22 |
| GO:00331482 | Breast | IDC | positive regulation of intracellular estrogen receptor signaling pathway | 6/1434 | 11/18723 | 6.59e-05 | 1.35e-03 | 6 |
| GO:00331452 | Breast | IDC | positive regulation of intracellular steroid hormone receptor signaling pathway | 6/1434 | 13/18723 | 2.14e-04 | 3.45e-03 | 6 |
| GO:003052214 | Breast | IDC | intracellular receptor signaling pathway | 37/1434 | 265/18723 | 2.77e-04 | 4.26e-03 | 37 |
| GO:004340113 | Breast | IDC | steroid hormone mediated signaling pathway | 22/1434 | 136/18723 | 6.51e-04 | 8.04e-03 | 22 |
| GO:004854524 | Breast | DCIS | response to steroid hormone | 67/1390 | 339/18723 | 1.02e-13 | 2.76e-11 | 67 |
| GO:007138324 | Breast | DCIS | cellular response to steroid hormone stimulus | 34/1390 | 204/18723 | 7.04e-06 | 1.95e-04 | 34 |
| GO:003051823 | Breast | DCIS | intracellular steroid hormone receptor signaling pathway | 21/1390 | 116/18723 | 1.16e-04 | 2.03e-03 | 21 |
| GO:003052224 | Breast | DCIS | intracellular receptor signaling pathway | 35/1390 | 265/18723 | 6.38e-04 | 7.92e-03 | 35 |
| GO:00331481 | Breast | DCIS | positive regulation of intracellular estrogen receptor signaling pathway | 5/1390 | 11/18723 | 7.08e-04 | 8.51e-03 | 5 |
| GO:004340122 | Breast | DCIS | steroid hormone mediated signaling pathway | 21/1390 | 136/18723 | 1.06e-03 | 1.16e-02 | 21 |
| GO:00331451 | Breast | DCIS | positive regulation of intracellular steroid hormone receptor signaling pathway | 5/1390 | 13/18723 | 1.74e-03 | 1.70e-02 | 5 |
| GO:003052222 | Liver | HCC | intracellular receptor signaling pathway | 171/7958 | 265/18723 | 3.00e-13 | 1.61e-11 | 171 |
| GO:004854522 | Liver | HCC | response to steroid hormone | 206/7958 | 339/18723 | 6.81e-12 | 2.92e-10 | 206 |
| GO:007138322 | Liver | HCC | cellular response to steroid hormone stimulus | 128/7958 | 204/18723 | 3.92e-09 | 1.04e-07 | 128 |
| GO:004340121 | Liver | HCC | steroid hormone mediated signaling pathway | 84/7958 | 136/18723 | 4.42e-06 | 5.62e-05 | 84 |
| GO:003051821 | Liver | HCC | intracellular steroid hormone receptor signaling pathway | 73/7958 | 116/18723 | 7.04e-06 | 8.41e-05 | 73 |
| GO:003314321 | Liver | HCC | regulation of intracellular steroid hormone receptor signaling pathway | 49/7958 | 74/18723 | 3.21e-05 | 3.26e-04 | 49 |
| Page: 1 2 |
| Pathway ID | Tissue | Disease Stage | Description | Gene Ratio | Bg Ratio | pvalue | p.adjust | qvalue | Count |
| Page: 1 |
Top |
Cell-cell communication analysis |
| Identification of potential cell-cell interactions between two cell types and their ligand-receptor pairs for different disease states |
| Ligand | Receptor | LRpair | Pathway | Tissue | Disease Stage |
| Page: 1 |
Top |
Single-cell gene regulatory network inference analysis |
| Find out the significant the regulons (TFs) and the target genes of each regulon across cell types for different disease states |
| TF | Cell Type | Tissue | Disease Stage | Target Gene | RSS | Regulon Activity |
| ∗The dot plots of a searched regulon are shown for all cell subpopulations in each disease state of each tissue based on the regulon specific score inferred using pySCENIC and by calculating the average expression. |
| Page: 1 |
Top |
Somatic mutation of malignant transformation related genes |
| Annotation of somatic variants for genes involved in malignant transformation |
| Hugo Symbol | Variant Class | Variant Classification | dbSNP RS | HGVSc | HGVSp | HGVSp Short | SWISSPROT | BIOTYPE | SIFT | PolyPhen | Tumor Sample Barcode | Tissue | Histology | Sex | Age | Stage | Therapy Types | Drugs | Outcome |
| Page: 1 |
Top |
Related drugs of malignant transformation related genes |
| Identification of chemicals and drugs interact with genes involved in malignant transfromation |
| (DGIdb 4.0) |
| Entrez ID | Symbol | Category | Interaction Types | Drug Claim Name | Drug Name | PMIDs |
| Page: 1 |

Copyright 2023-Present -The University of Texas Health Science Center at Houston |