
|
|||||
|
 | |
| |
| |
| |
| |
| |
|
Gene: SRA1 |
Gene summary for SRA1 |
| Gene information | Species | Human | Gene symbol | SRA1 | Gene ID | 10011 |
| Gene name | steroid receptor RNA activator 1 | |
| Gene Alias | SRA | |
| Cytomap | 5q31.3 | |
| Gene Type | protein-coding | GO ID | GO:0000278 | UniProtAcc | Q9HD15 |
Top |
Malignant transformation analysis |
| Identification of the aberrant gene expression in precancerous and cancerous lesions by comparing the gene expression of stem-like cells in diseased tissues with normal stem cells |
| Entrez ID | Symbol | Replicates | Species | Organ | Tissue | Adj P-value | Log2FC | Malignancy |
| 10011 | SRA1 | LZE2T | Human | Esophagus | ESCC | 1.81e-02 | 4.30e-01 | 0.082 |
| 10011 | SRA1 | LZE4T | Human | Esophagus | ESCC | 9.78e-11 | 3.29e-01 | 0.0811 |
| 10011 | SRA1 | LZE5T | Human | Esophagus | ESCC | 7.17e-03 | 1.85e-01 | 0.0514 |
| 10011 | SRA1 | LZE7T | Human | Esophagus | ESCC | 6.66e-12 | 6.57e-01 | 0.0667 |
| 10011 | SRA1 | LZE8T | Human | Esophagus | ESCC | 4.38e-09 | 4.57e-01 | 0.067 |
| 10011 | SRA1 | LZE20T | Human | Esophagus | ESCC | 8.99e-15 | 4.72e-01 | 0.0662 |
| 10011 | SRA1 | LZE22D1 | Human | Esophagus | HGIN | 1.00e-03 | 9.64e-02 | 0.0595 |
| 10011 | SRA1 | LZE22T | Human | Esophagus | ESCC | 2.81e-03 | 2.38e-01 | 0.068 |
| 10011 | SRA1 | LZE24T | Human | Esophagus | ESCC | 5.75e-20 | 6.56e-01 | 0.0596 |
| 10011 | SRA1 | LZE6T | Human | Esophagus | ESCC | 1.93e-14 | 6.99e-01 | 0.0845 |
| 10011 | SRA1 | P1T-E | Human | Esophagus | ESCC | 6.10e-10 | 5.33e-01 | 0.0875 |
| 10011 | SRA1 | P2T-E | Human | Esophagus | ESCC | 9.56e-31 | 5.65e-01 | 0.1177 |
| 10011 | SRA1 | P4T-E | Human | Esophagus | ESCC | 1.15e-39 | 9.49e-01 | 0.1323 |
| 10011 | SRA1 | P5T-E | Human | Esophagus | ESCC | 1.62e-47 | 1.05e+00 | 0.1327 |
| 10011 | SRA1 | P8T-E | Human | Esophagus | ESCC | 1.38e-16 | 2.44e-01 | 0.0889 |
| 10011 | SRA1 | P9T-E | Human | Esophagus | ESCC | 6.37e-34 | 7.38e-01 | 0.1131 |
| 10011 | SRA1 | P10T-E | Human | Esophagus | ESCC | 1.42e-24 | 4.77e-01 | 0.116 |
| 10011 | SRA1 | P11T-E | Human | Esophagus | ESCC | 4.19e-24 | 1.13e+00 | 0.1426 |
| 10011 | SRA1 | P12T-E | Human | Esophagus | ESCC | 2.22e-45 | 9.56e-01 | 0.1122 |
| 10011 | SRA1 | P15T-E | Human | Esophagus | ESCC | 1.10e-21 | 5.98e-01 | 0.1149 |
| Page: 1 2 3 4 5 6 7 |
| Tissue | Expression Dynamics | Abbreviation |
| Esophagus | 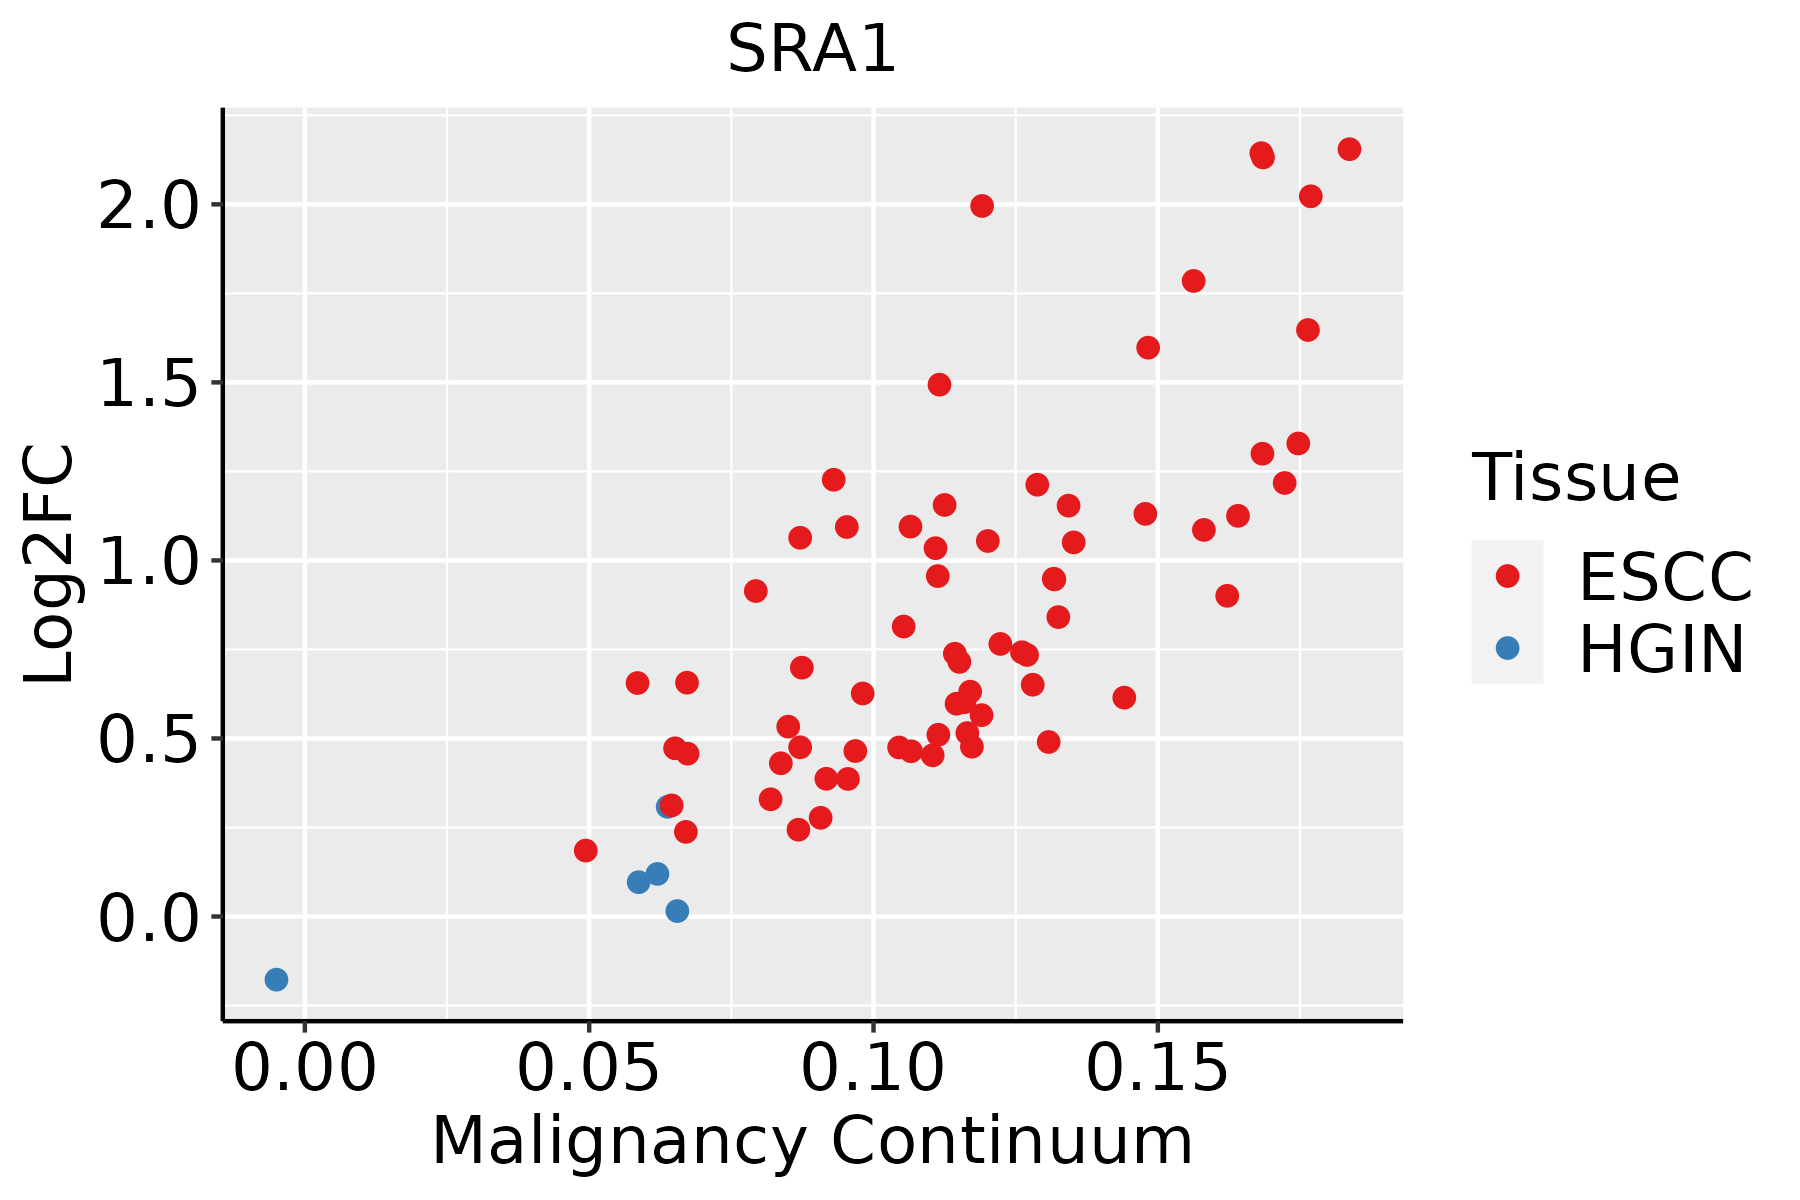 | ESCC: Esophageal squamous cell carcinoma |
| HGIN: High-grade intraepithelial neoplasias | ||
| LGIN: Low-grade intraepithelial neoplasias | ||
| Liver | 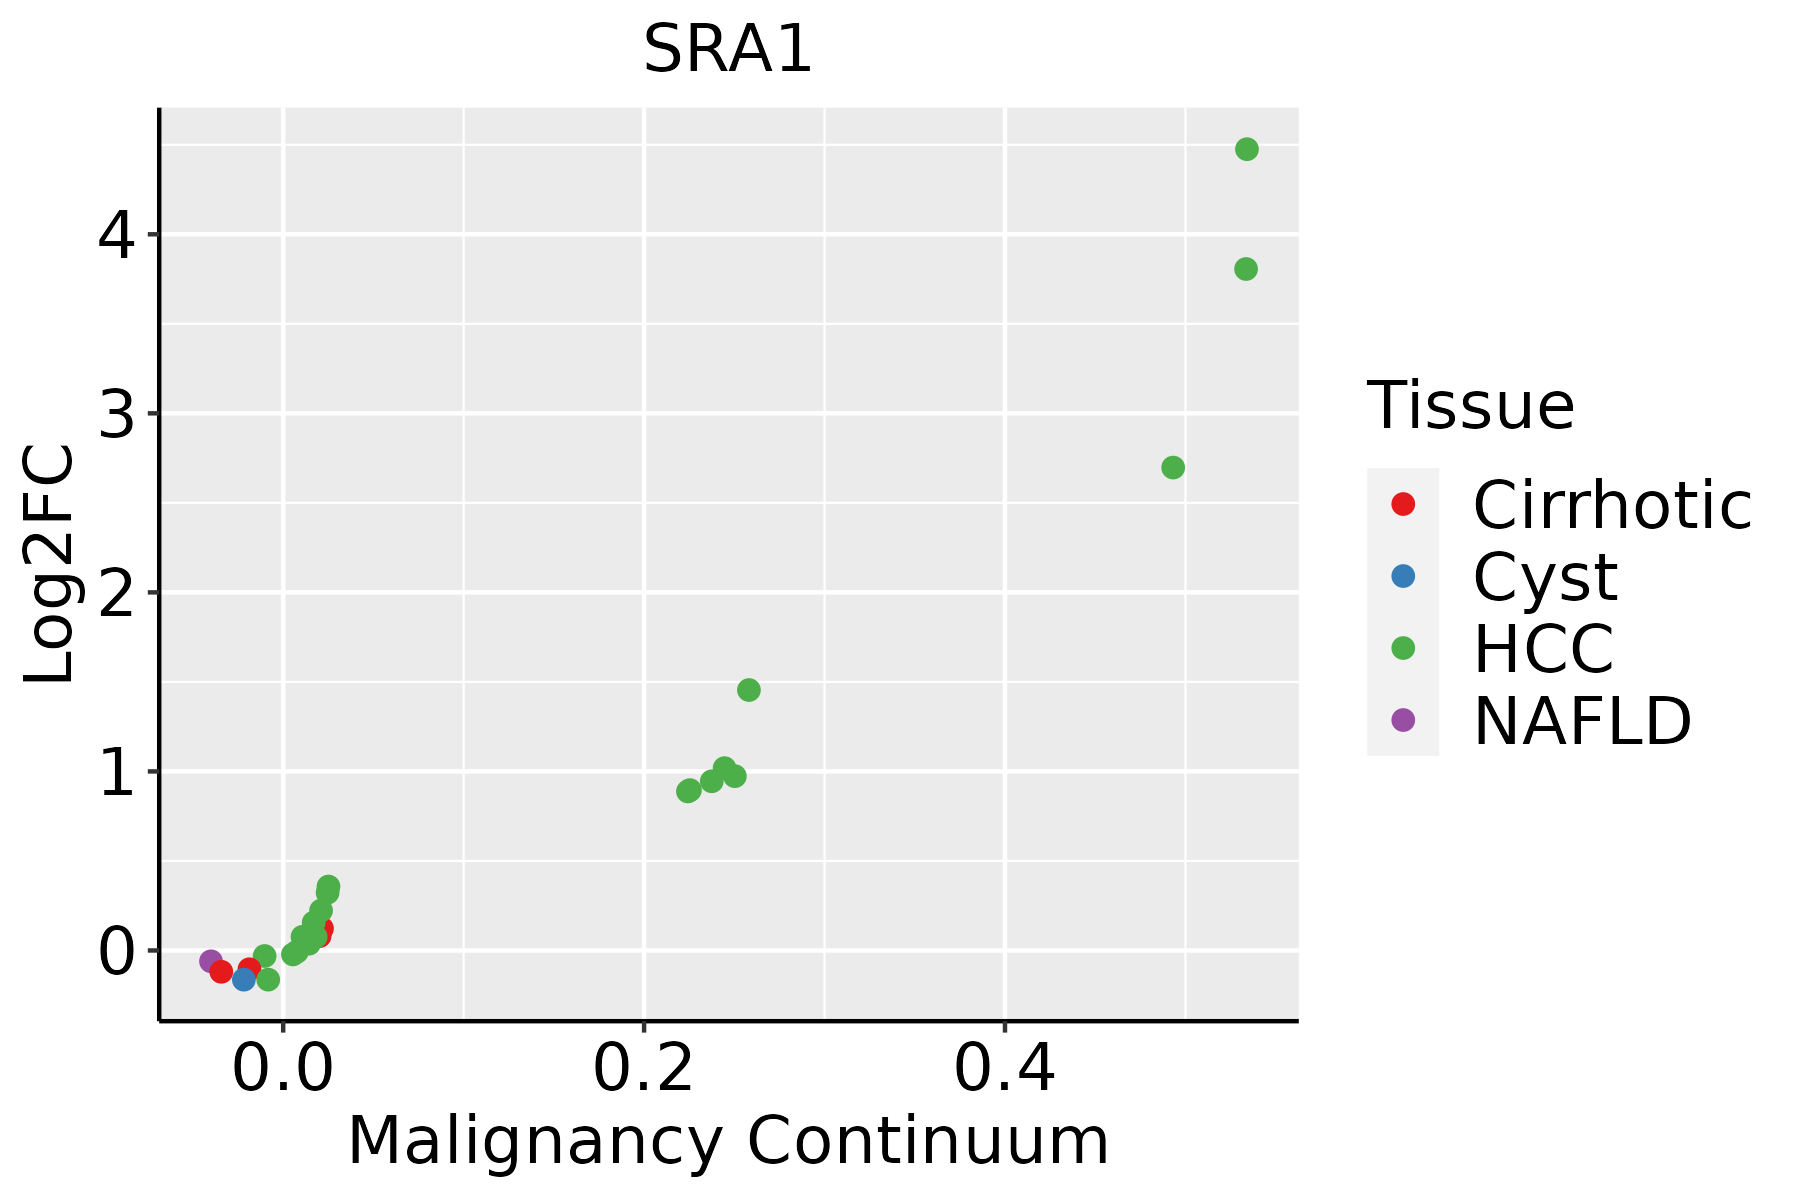 | HCC: Hepatocellular carcinoma |
| NAFLD: Non-alcoholic fatty liver disease | ||
| Oral Cavity | 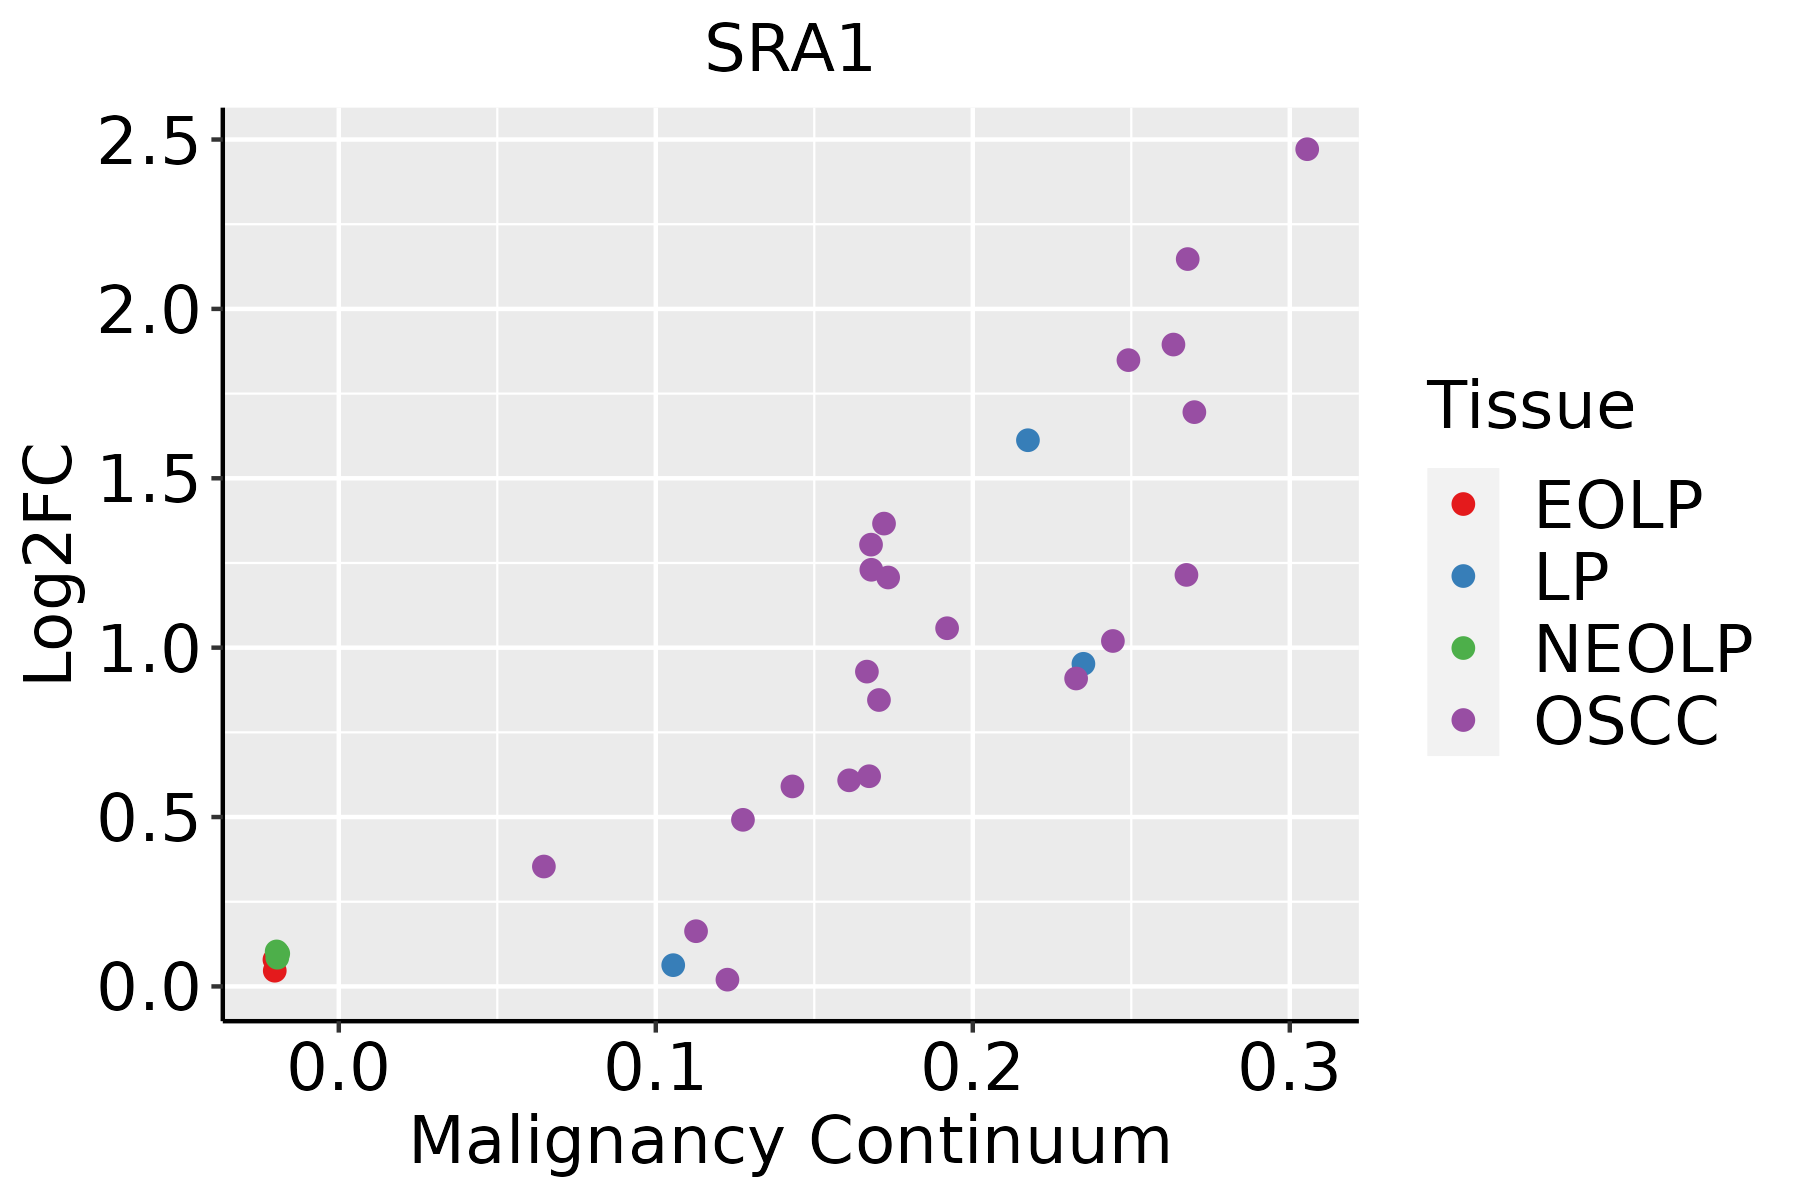 | EOLP: Erosive Oral lichen planus |
| LP: leukoplakia | ||
| NEOLP: Non-erosive oral lichen planus | ||
| OSCC: Oral squamous cell carcinoma | ||
| Skin |  | AK: Actinic keratosis |
| cSCC: Cutaneous squamous cell carcinoma | ||
| SCCIS:squamous cell carcinoma in situ | ||
| Thyroid | 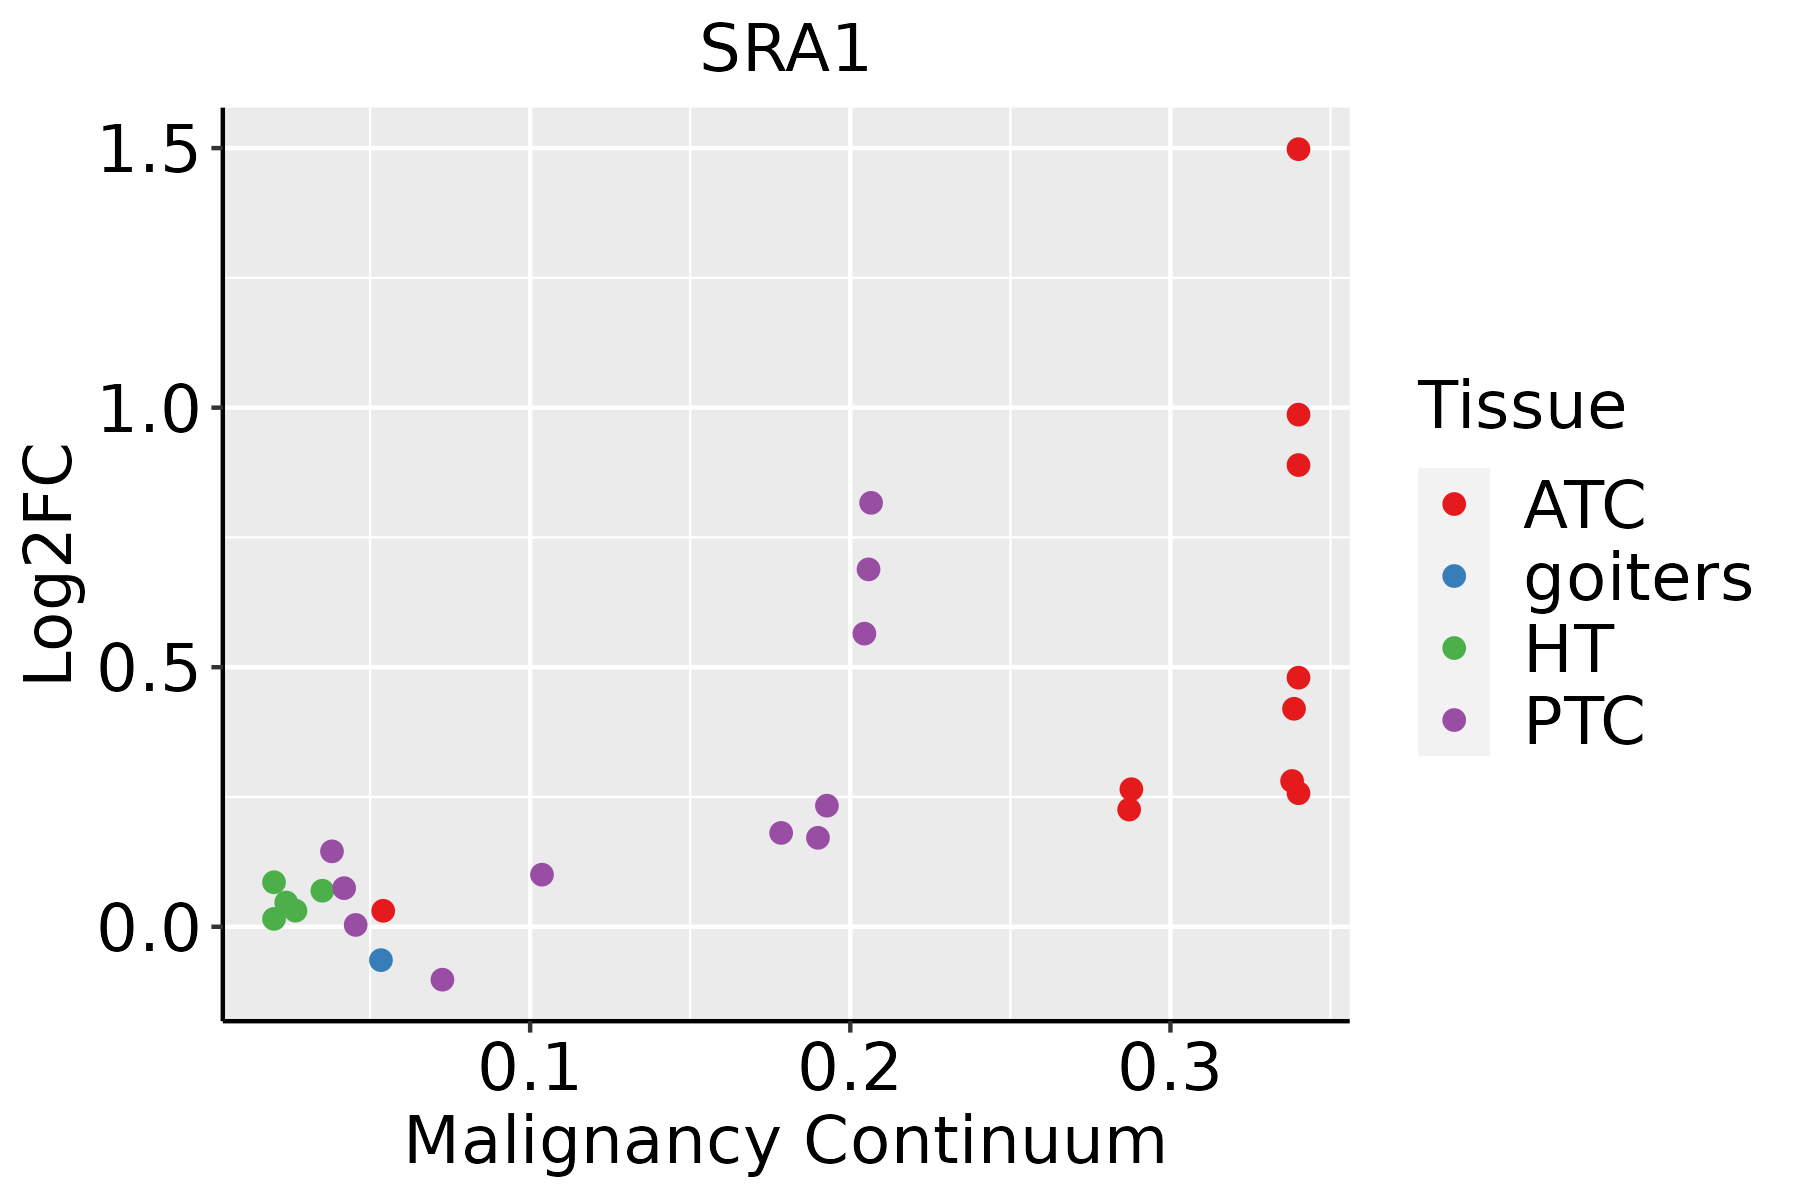 | ATC: Anaplastic thyroid cancer |
| HT: Hashimoto's thyroiditis | ||
| PTC: Papillary thyroid cancer |
| ∗log2FC in expression of this searched gene in stem-like cells from each diseased tissue sample relative to stem-like cells in normal samples in each tissue plotted against the malignancy continuum. Samples are colored based on if they are from different disease stage. |
Top |
Malignant transformation related pathway analysis |
| Find out the enriched GO biological processes and KEGG pathways involved in transition from healthy to precancer to cancer |
| Tissue | Disease Stage | Enriched GO biological Processes |
| Colorectum | AD |  |
| Colorectum | SER |  |
| Colorectum | MSS |  |
| Colorectum | MSI-H |  |
| Colorectum | FAP |  |
| ∗Top 15 enriched GO BP terms are showed in the bar plot of each disease state in each tissue. Each row represents a significant GO biological process which is colored according to the -log10(p.adjust). |
| Page: 1 2 3 4 5 6 7 8 9 |
| GO ID | Tissue | Disease Stage | Description | Gene Ratio | Bg Ratio | pvalue | p.adjust | Count |
| GO:000734610 | Esophagus | HGIN | regulation of mitotic cell cycle | 98/2587 | 457/18723 | 4.39e-06 | 1.42e-04 | 98 |
| GO:000734615 | Esophagus | ESCC | regulation of mitotic cell cycle | 293/8552 | 457/18723 | 8.00e-16 | 5.64e-14 | 293 |
| GO:00454454 | Esophagus | ESCC | myoblast differentiation | 52/8552 | 84/18723 | 1.98e-03 | 8.90e-03 | 52 |
| GO:00436275 | Esophagus | ESCC | response to estrogen | 45/8552 | 75/18723 | 8.75e-03 | 3.08e-02 | 45 |
| GO:00073463 | Liver | Cirrhotic | regulation of mitotic cell cycle | 154/4634 | 457/18723 | 8.73e-06 | 1.29e-04 | 154 |
| GO:0043627 | Liver | Cirrhotic | response to estrogen | 30/4634 | 75/18723 | 2.52e-03 | 1.51e-02 | 30 |
| GO:000734611 | Liver | HCC | regulation of mitotic cell cycle | 255/7958 | 457/18723 | 4.96e-09 | 1.30e-07 | 255 |
| GO:00436271 | Liver | HCC | response to estrogen | 44/7958 | 75/18723 | 3.44e-03 | 1.55e-02 | 44 |
| GO:00073469 | Oral cavity | OSCC | regulation of mitotic cell cycle | 266/7305 | 457/18723 | 3.87e-17 | 3.41e-15 | 266 |
| GO:00454453 | Oral cavity | OSCC | myoblast differentiation | 46/7305 | 84/18723 | 2.43e-03 | 1.07e-02 | 46 |
| GO:000734614 | Oral cavity | LP | regulation of mitotic cell cycle | 163/4623 | 457/18723 | 7.64e-08 | 2.56e-06 | 163 |
| GO:004544512 | Oral cavity | LP | myoblast differentiation | 35/4623 | 84/18723 | 4.56e-04 | 4.33e-03 | 35 |
| GO:0045661 | Oral cavity | LP | regulation of myoblast differentiation | 22/4623 | 51/18723 | 2.96e-03 | 2.03e-02 | 22 |
| GO:000734617 | Skin | cSCC | regulation of mitotic cell cycle | 192/4864 | 457/18723 | 3.47e-14 | 2.31e-12 | 192 |
| GO:004544513 | Skin | cSCC | myoblast differentiation | 35/4864 | 84/18723 | 1.23e-03 | 7.97e-03 | 35 |
| GO:000734619 | Thyroid | PTC | regulation of mitotic cell cycle | 212/5968 | 457/18723 | 4.03e-11 | 1.44e-09 | 212 |
| GO:000734622 | Thyroid | ATC | regulation of mitotic cell cycle | 236/6293 | 457/18723 | 7.58e-16 | 5.92e-14 | 236 |
| Page: 1 |
| Pathway ID | Tissue | Disease Stage | Description | Gene Ratio | Bg Ratio | pvalue | p.adjust | qvalue | Count |
| Page: 1 |
Top |
Cell-cell communication analysis |
| Identification of potential cell-cell interactions between two cell types and their ligand-receptor pairs for different disease states |
| Ligand | Receptor | LRpair | Pathway | Tissue | Disease Stage |
| Page: 1 |
Top |
Single-cell gene regulatory network inference analysis |
| Find out the significant the regulons (TFs) and the target genes of each regulon across cell types for different disease states |
| TF | Cell Type | Tissue | Disease Stage | Target Gene | RSS | Regulon Activity |
| ∗The dot plots of a searched regulon are shown for all cell subpopulations in each disease state of each tissue based on the regulon specific score inferred using pySCENIC and by calculating the average expression. |
| Page: 1 |
Top |
Somatic mutation of malignant transformation related genes |
| Annotation of somatic variants for genes involved in malignant transformation |
| Hugo Symbol | Variant Class | Variant Classification | dbSNP RS | HGVSc | HGVSp | HGVSp Short | SWISSPROT | BIOTYPE | SIFT | PolyPhen | Tumor Sample Barcode | Tissue | Histology | Sex | Age | Stage | Therapy Types | Drugs | Outcome |
| SRA1 | SNV | Missense_Mutation | rs746406835 | c.568N>A | p.Glu190Lys | p.E190K | Q9HD15 | protein_coding | deleterious(0) | probably_damaging(0.999) | TCGA-AC-A5XS-01 | Breast | breast invasive carcinoma | Female | >=65 | I/II | Hormone Therapy | femara | SD |
| SRA1 | SNV | Missense_Mutation | novel | c.322N>A | p.Glu108Lys | p.E108K | Q9HD15 | protein_coding | deleterious(0) | probably_damaging(0.991) | TCGA-HM-A4S6-01 | Cervix | cervical & endocervical cancer | Female | <65 | III/IV | Chemotherapy | cisplatin | CR |
| SRA1 | SNV | Missense_Mutation | c.8G>A | p.Arg3His | p.R3H | Q9HD15 | protein_coding | tolerated_low_confidence(0.25) | benign(0) | TCGA-IR-A3LA-01 | Cervix | cervical & endocervical cancer | Female | <65 | I/II | Chemotherapy | cisplatin | CR | |
| SRA1 | SNV | Missense_Mutation | novel | c.474N>T | p.Lys158Asn | p.K158N | Q9HD15 | protein_coding | deleterious(0.04) | probably_damaging(0.953) | TCGA-AZ-4315-01 | Colorectum | colon adenocarcinoma | Male | <65 | I/II | Unknown | Unknown | SD |
| SRA1 | SNV | Missense_Mutation | novel | c.651N>T | p.Glu217Asp | p.E217D | Q9HD15 | protein_coding | deleterious(0.04) | benign(0.138) | TCGA-CA-6717-01 | Colorectum | colon adenocarcinoma | Male | <65 | I/II | Chemotherapy | oxaliplatin | CR |
| SRA1 | SNV | Missense_Mutation | rs148927164 | c.617N>T | p.Arg206Met | p.R206M | Q9HD15 | protein_coding | deleterious(0) | probably_damaging(0.923) | TCGA-A5-A0G2-01 | Endometrium | uterine corpus endometrioid carcinoma | Female | <65 | III/IV | Unknown | Unknown | SD |
| SRA1 | SNV | Missense_Mutation | novel | c.377N>A | p.Arg126His | p.R126H | Q9HD15 | protein_coding | tolerated(0.06) | benign(0.009) | TCGA-AX-A1CE-01 | Endometrium | uterine corpus endometrioid carcinoma | Female | <65 | I/II | Unspecific | Paclitaxel | SD |
| SRA1 | SNV | Missense_Mutation | rs146775907 | c.193N>A | p.Ala65Thr | p.A65T | Q9HD15 | protein_coding | tolerated(0.78) | benign(0) | TCGA-B5-A0JY-01 | Endometrium | uterine corpus endometrioid carcinoma | Female | <65 | III/IV | Chemotherapy | doxorubicin | SD |
| SRA1 | SNV | Missense_Mutation | c.385A>G | p.Thr129Ala | p.T129A | Q9HD15 | protein_coding | deleterious(0.02) | benign(0.034) | TCGA-BS-A0UJ-01 | Endometrium | uterine corpus endometrioid carcinoma | Female | >=65 | I/II | Unknown | Unknown | SD | |
| SRA1 | SNV | Missense_Mutation | rs534756299 | c.376N>A | p.Arg126Ser | p.R126S | Q9HD15 | protein_coding | deleterious(0.02) | benign(0.065) | TCGA-BS-A0VI-01 | Endometrium | uterine corpus endometrioid carcinoma | Female | <65 | I/II | Unknown | Unknown | SD |
| Page: 1 2 |
Top |
Related drugs of malignant transformation related genes |
| Identification of chemicals and drugs interact with genes involved in malignant transfromation |
| (DGIdb 4.0) |
| Entrez ID | Symbol | Category | Interaction Types | Drug Claim Name | Drug Name | PMIDs |
| Page: 1 |

Copyright 2023-Present -The University of Texas Health Science Center at Houston |