
|
|||||
|
 | |
| |
| |
| |
| |
| |
|
Gene: SQRDL |
Gene summary for SQRDL |
| Gene information | Species | Human | Gene symbol | SQRDL | Gene ID | 58472 |
| Gene name | sulfide quinone oxidoreductase | |
| Gene Alias | CGI-44 | |
| Cytomap | 15q21.1 | |
| Gene Type | protein-coding | GO ID | GO:0006790 | UniProtAcc | A0A024R5X2 |
Top |
Malignant transformation analysis |
| Identification of the aberrant gene expression in precancerous and cancerous lesions by comparing the gene expression of stem-like cells in diseased tissues with normal stem cells |
| Entrez ID | Symbol | Replicates | Species | Organ | Tissue | Adj P-value | Log2FC | Malignancy |
| 58472 | SQRDL | GSM4909281 | Human | Breast | IDC | 7.78e-22 | -3.58e-01 | 0.21 |
| 58472 | SQRDL | GSM4909282 | Human | Breast | IDC | 2.31e-20 | -3.58e-01 | -0.0288 |
| 58472 | SQRDL | GSM4909285 | Human | Breast | IDC | 4.25e-21 | -3.58e-01 | 0.21 |
| 58472 | SQRDL | GSM4909286 | Human | Breast | IDC | 2.31e-20 | -3.58e-01 | 0.1081 |
| 58472 | SQRDL | GSM4909287 | Human | Breast | IDC | 8.98e-18 | -3.58e-01 | 0.2057 |
| 58472 | SQRDL | GSM4909288 | Human | Breast | IDC | 1.06e-03 | -3.58e-01 | 0.0988 |
| 58472 | SQRDL | GSM4909289 | Human | Breast | IDC | 2.25e-02 | -3.58e-01 | 0.1064 |
| 58472 | SQRDL | GSM4909290 | Human | Breast | IDC | 1.45e-12 | -3.58e-01 | 0.2096 |
| 58472 | SQRDL | GSM4909291 | Human | Breast | IDC | 4.52e-10 | -3.58e-01 | 0.1753 |
| 58472 | SQRDL | GSM4909293 | Human | Breast | IDC | 9.92e-21 | -3.58e-01 | 0.1581 |
| 58472 | SQRDL | GSM4909294 | Human | Breast | IDC | 2.31e-20 | -3.58e-01 | 0.2022 |
| 58472 | SQRDL | GSM4909295 | Human | Breast | IDC | 8.74e-08 | -3.58e-01 | 0.0898 |
| 58472 | SQRDL | GSM4909296 | Human | Breast | IDC | 4.25e-21 | -3.58e-01 | 0.1524 |
| 58472 | SQRDL | GSM4909297 | Human | Breast | IDC | 3.31e-22 | -3.58e-01 | 0.1517 |
| 58472 | SQRDL | GSM4909298 | Human | Breast | IDC | 3.31e-22 | -3.58e-01 | 0.1551 |
| 58472 | SQRDL | GSM4909299 | Human | Breast | IDC | 4.25e-21 | -3.58e-01 | 0.035 |
| 58472 | SQRDL | GSM4909300 | Human | Breast | IDC | 8.44e-07 | -3.58e-01 | 0.0334 |
| 58472 | SQRDL | GSM4909301 | Human | Breast | IDC | 4.25e-21 | -3.58e-01 | 0.1577 |
| 58472 | SQRDL | GSM4909302 | Human | Breast | IDC | 1.65e-17 | -3.58e-01 | 0.1545 |
| 58472 | SQRDL | GSM4909303 | Human | Breast | IDC | 2.67e-04 | -3.58e-01 | 0.0438 |
| Page: 1 2 3 4 5 6 7 8 9 |
| Tissue | Expression Dynamics | Abbreviation |
| Breast | 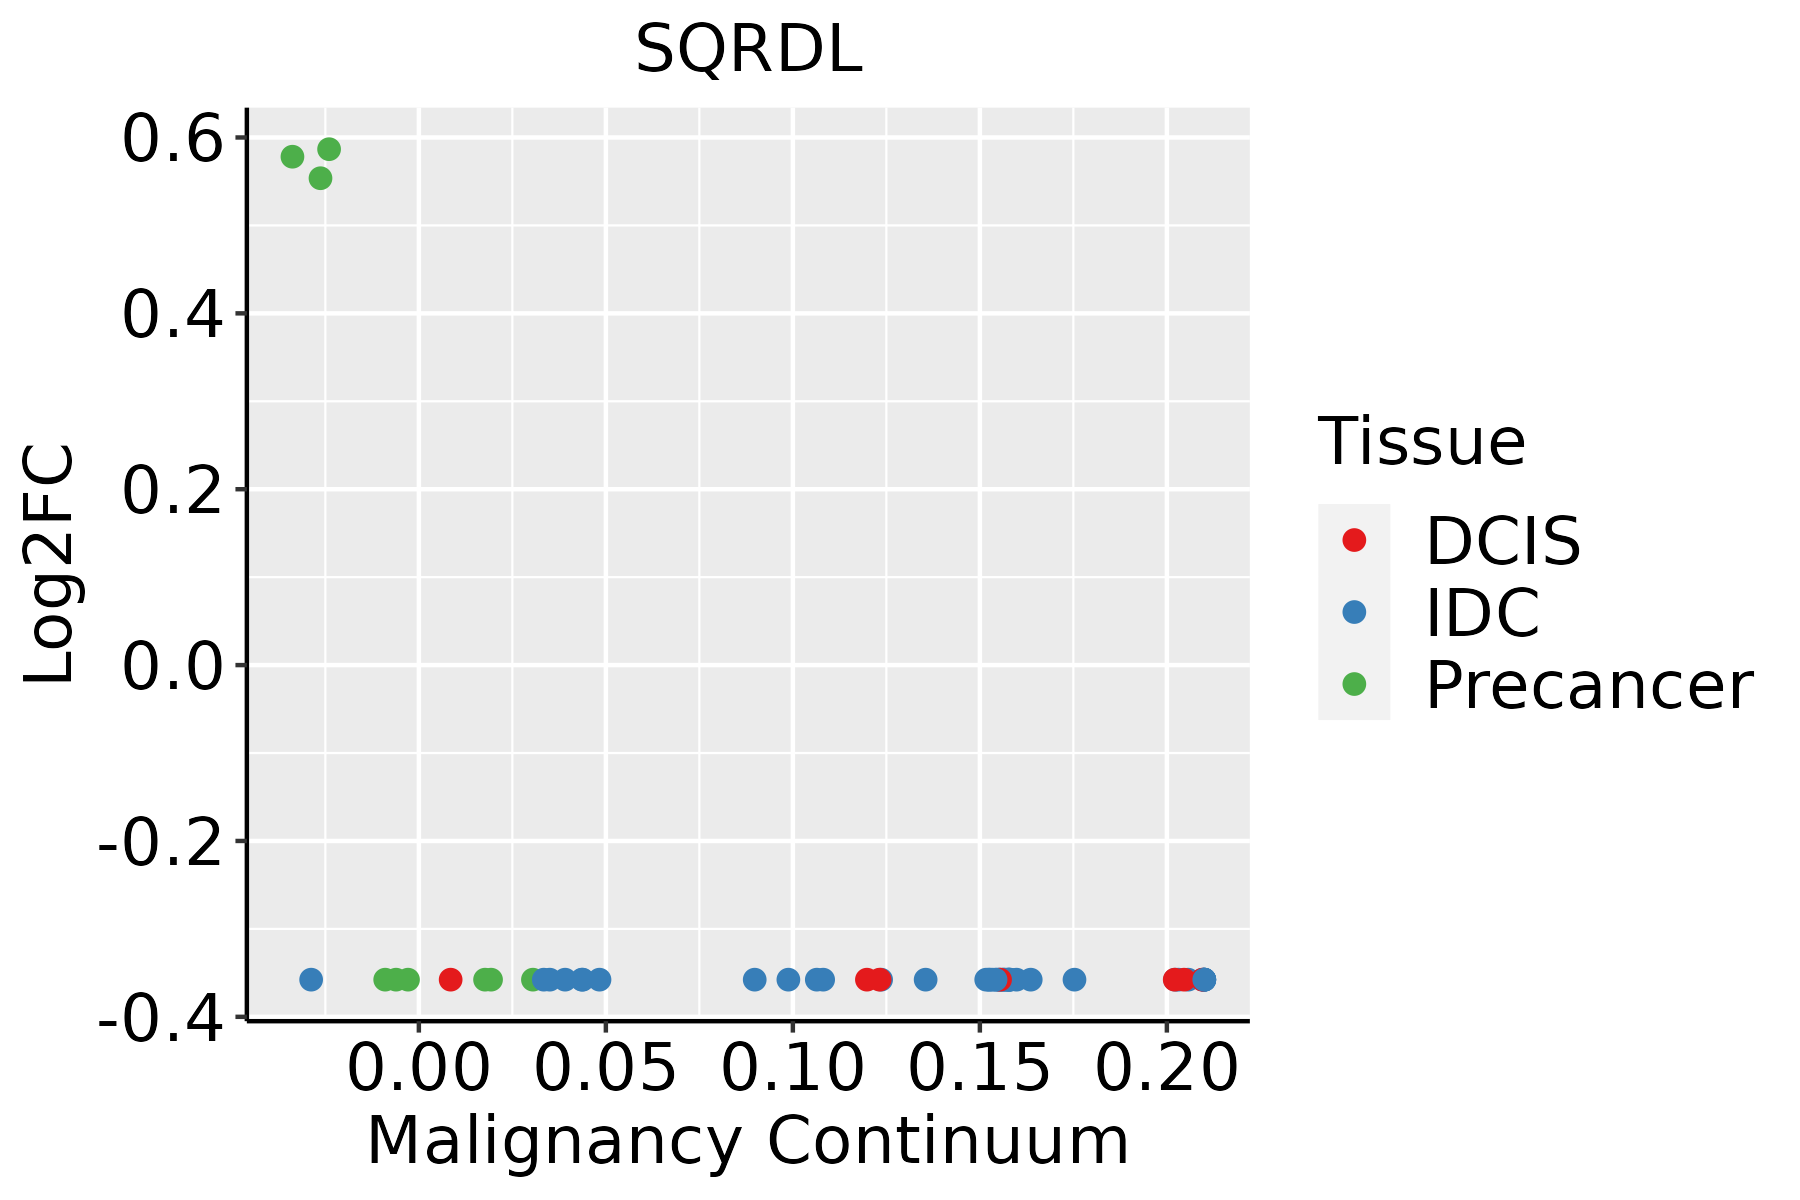 | IDC: Invasive ductal carcinoma |
| DCIS: Ductal carcinoma in situ | ||
| Precancer(BRCA1-mut): Precancerous lesion from BRCA1 mutation carriers | ||
| Colorectum (GSE201348) |  | FAP: Familial adenomatous polyposis |
| CRC: Colorectal cancer | ||
| Colorectum (HTA11) |  | AD: Adenomas |
| SER: Sessile serrated lesions | ||
| MSI-H: Microsatellite-high colorectal cancer | ||
| MSS: Microsatellite stable colorectal cancer | ||
| Esophagus | 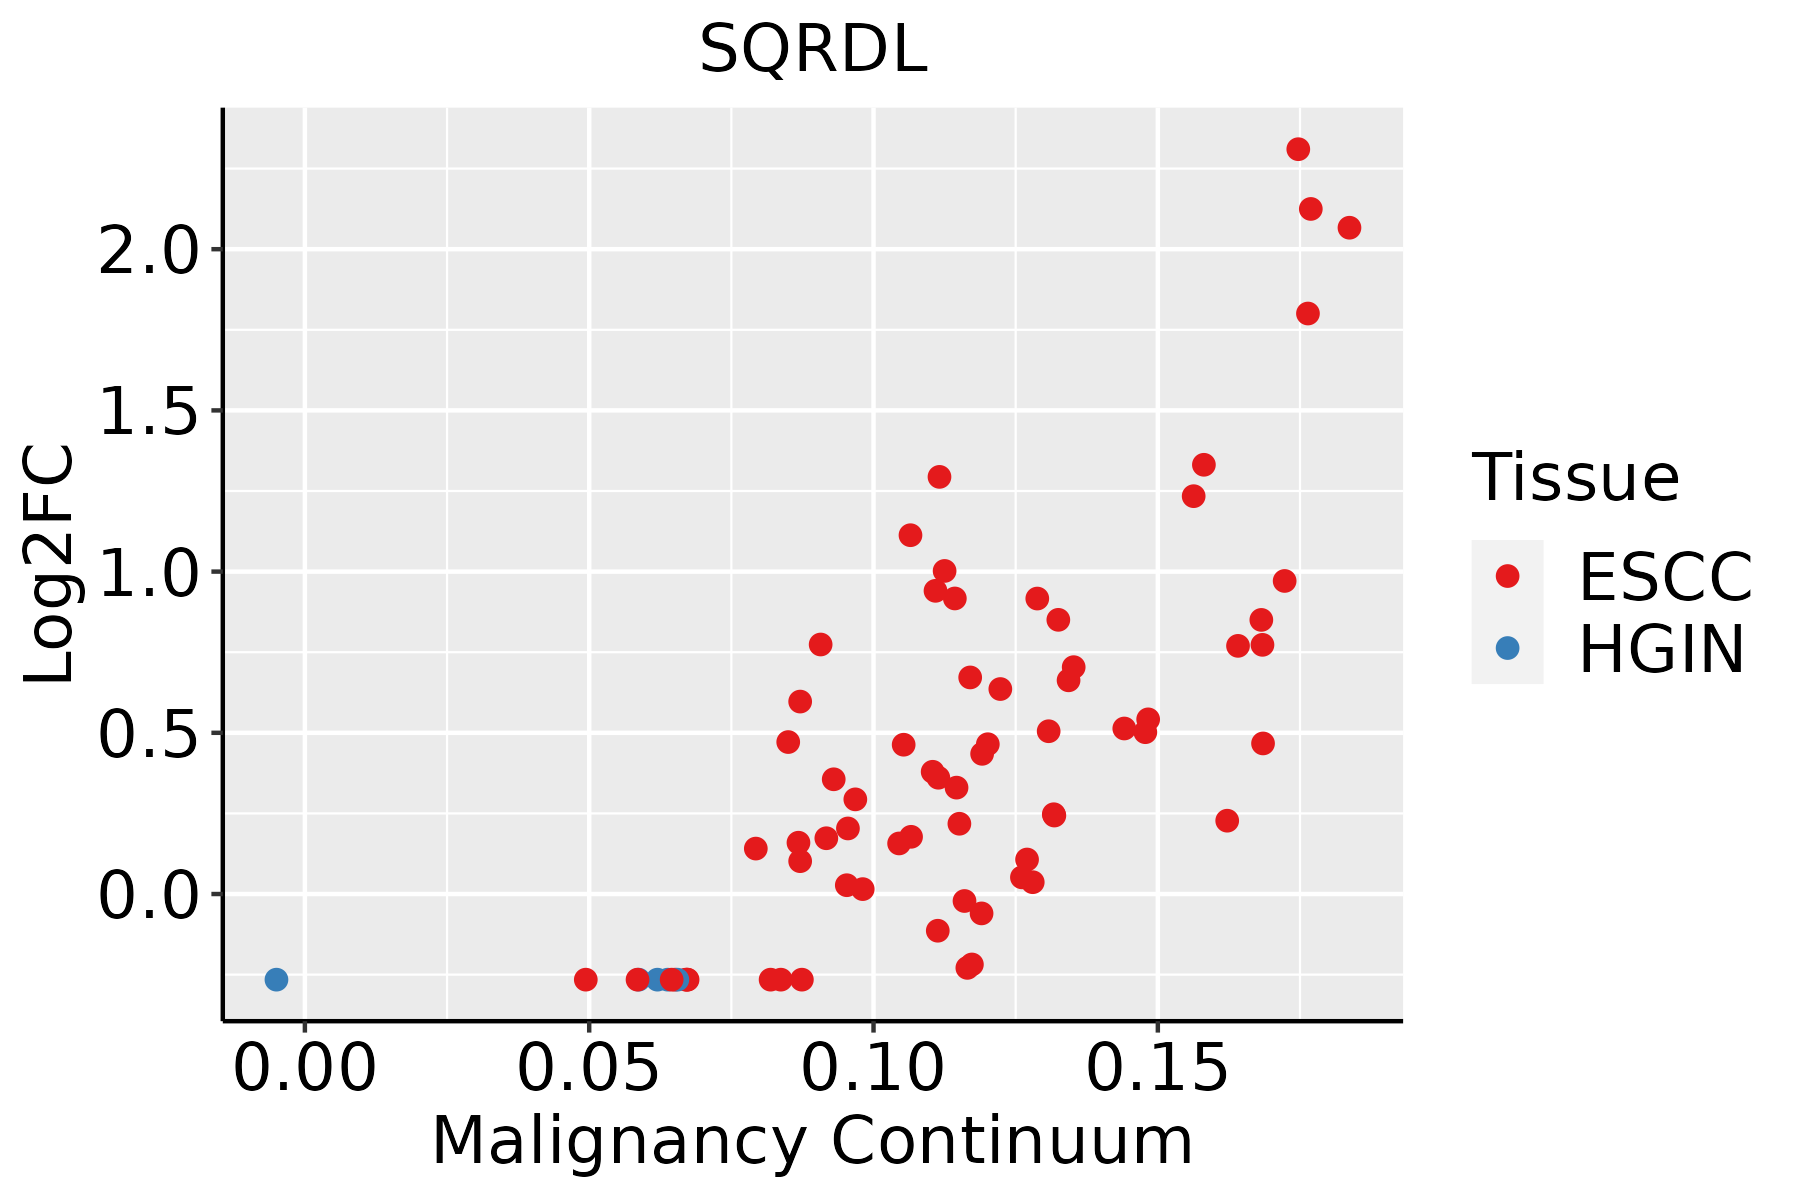 | ESCC: Esophageal squamous cell carcinoma |
| HGIN: High-grade intraepithelial neoplasias | ||
| LGIN: Low-grade intraepithelial neoplasias | ||
| GC | 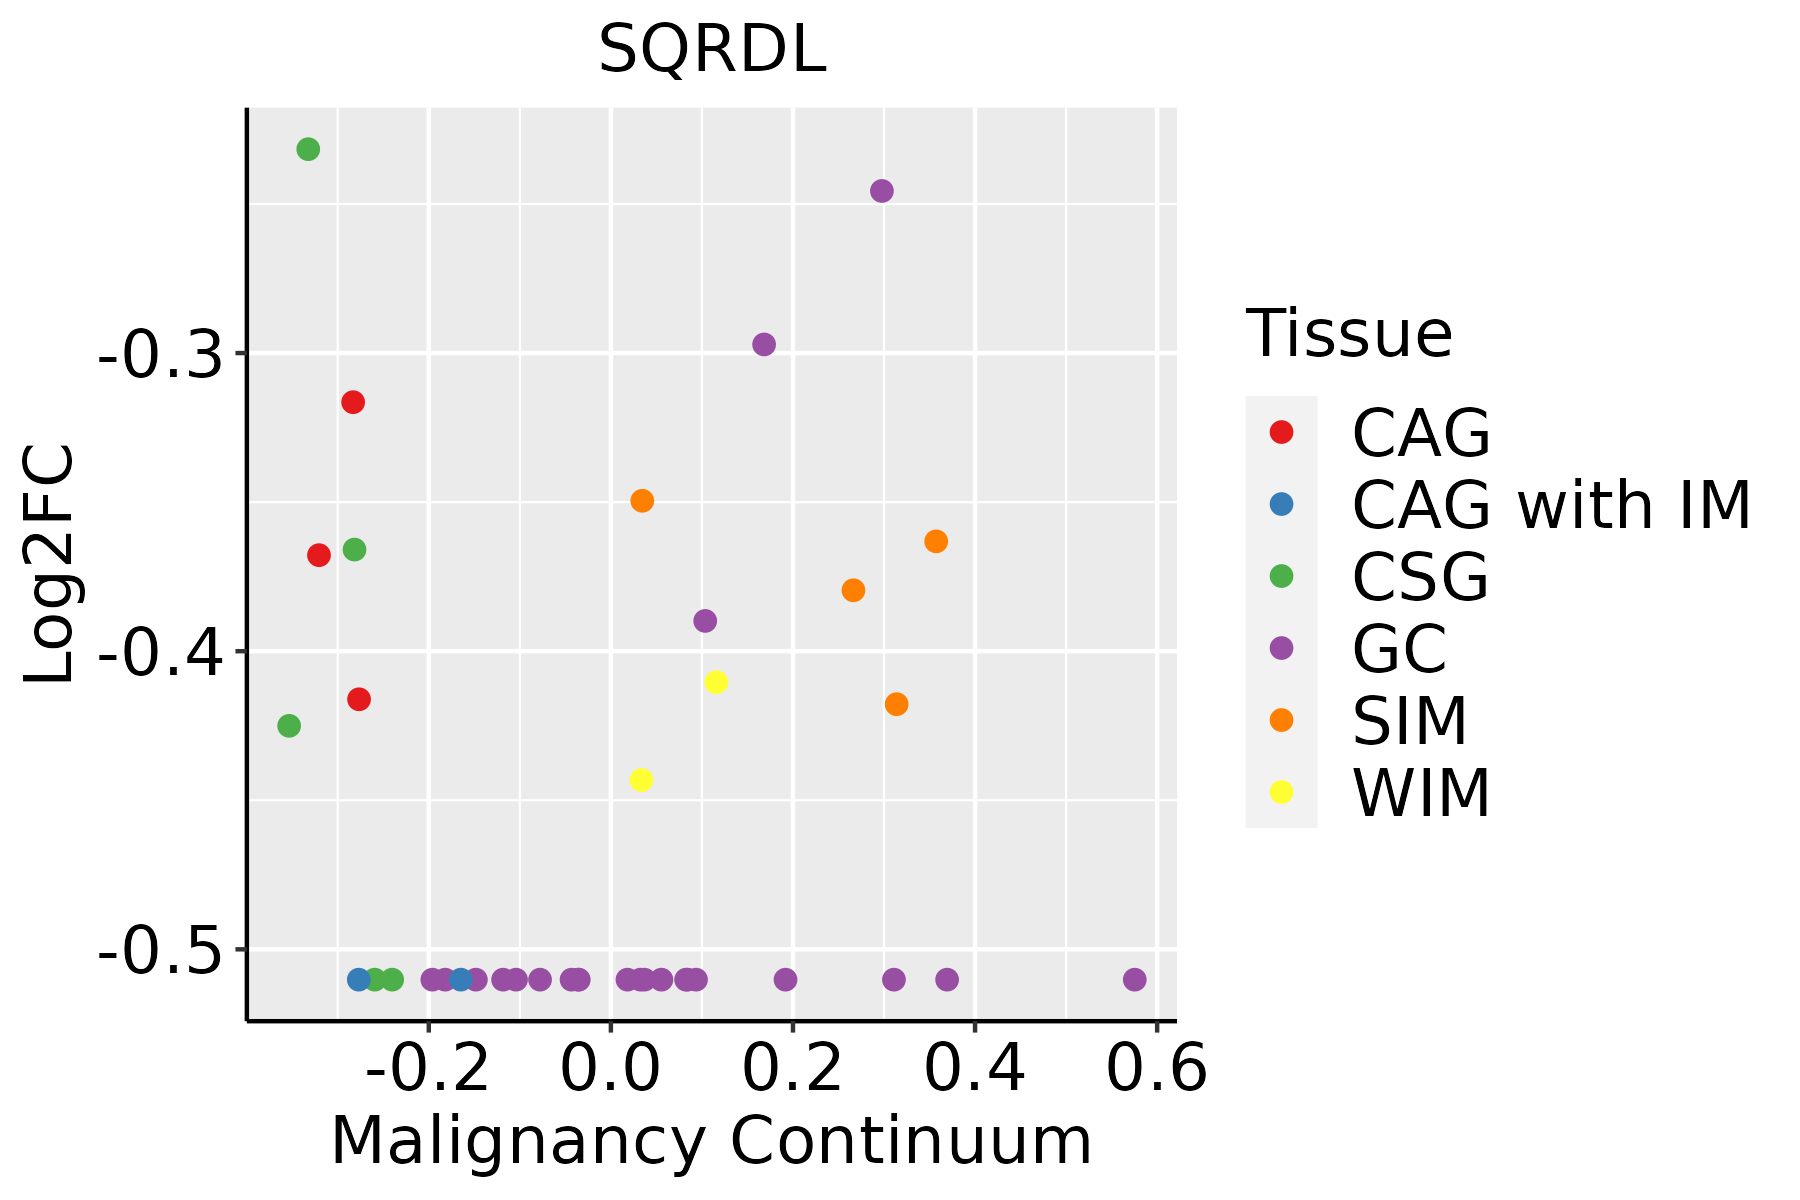 | CAG: Chronic atrophic gastritis |
| CAG with IM: Chronic atrophic gastritis with intestinal metaplasia | ||
| CSG: Chronic superficial gastritis | ||
| GC: Gastric cancer | ||
| SIM: Severe intestinal metaplasia | ||
| WIM: Wild intestinal metaplasia | ||
| Oral Cavity | 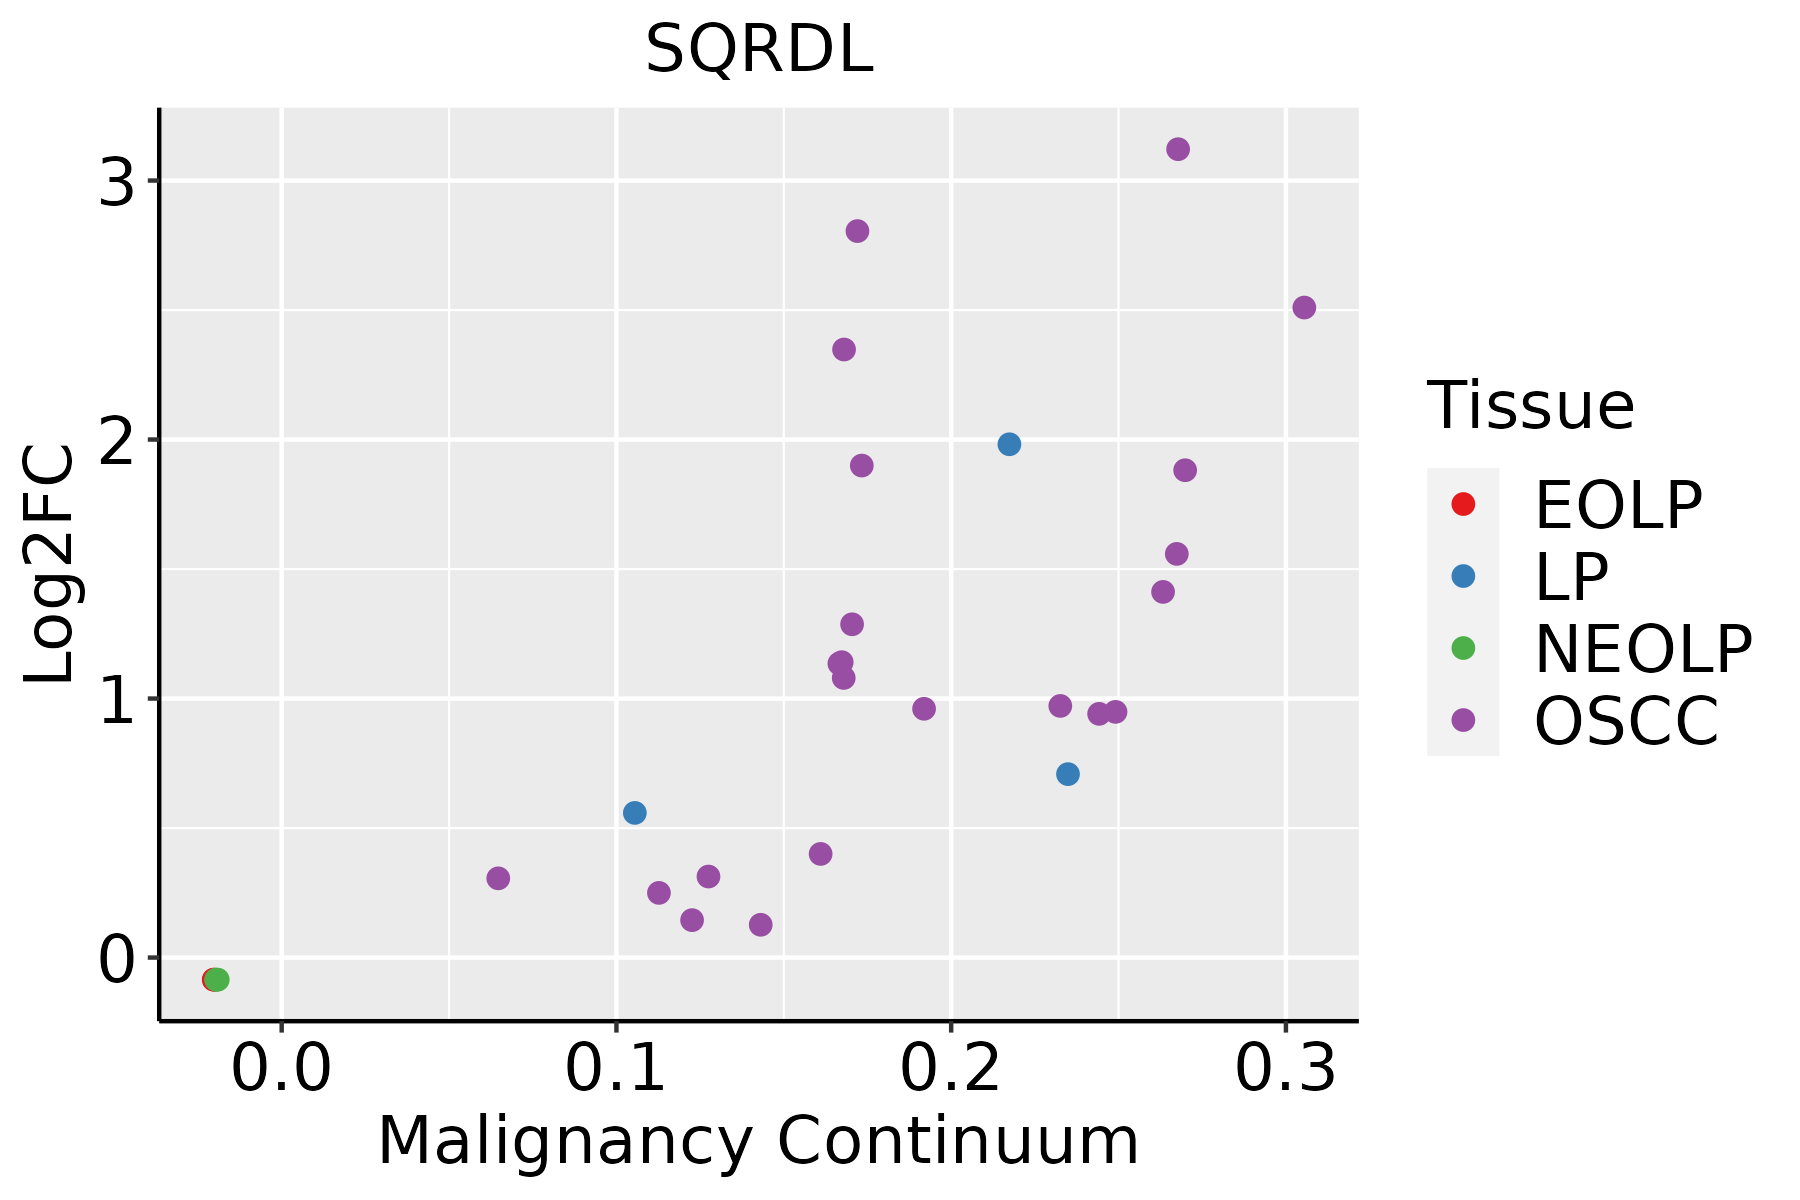 | EOLP: Erosive Oral lichen planus |
| LP: leukoplakia | ||
| NEOLP: Non-erosive oral lichen planus | ||
| OSCC: Oral squamous cell carcinoma | ||
| Skin | 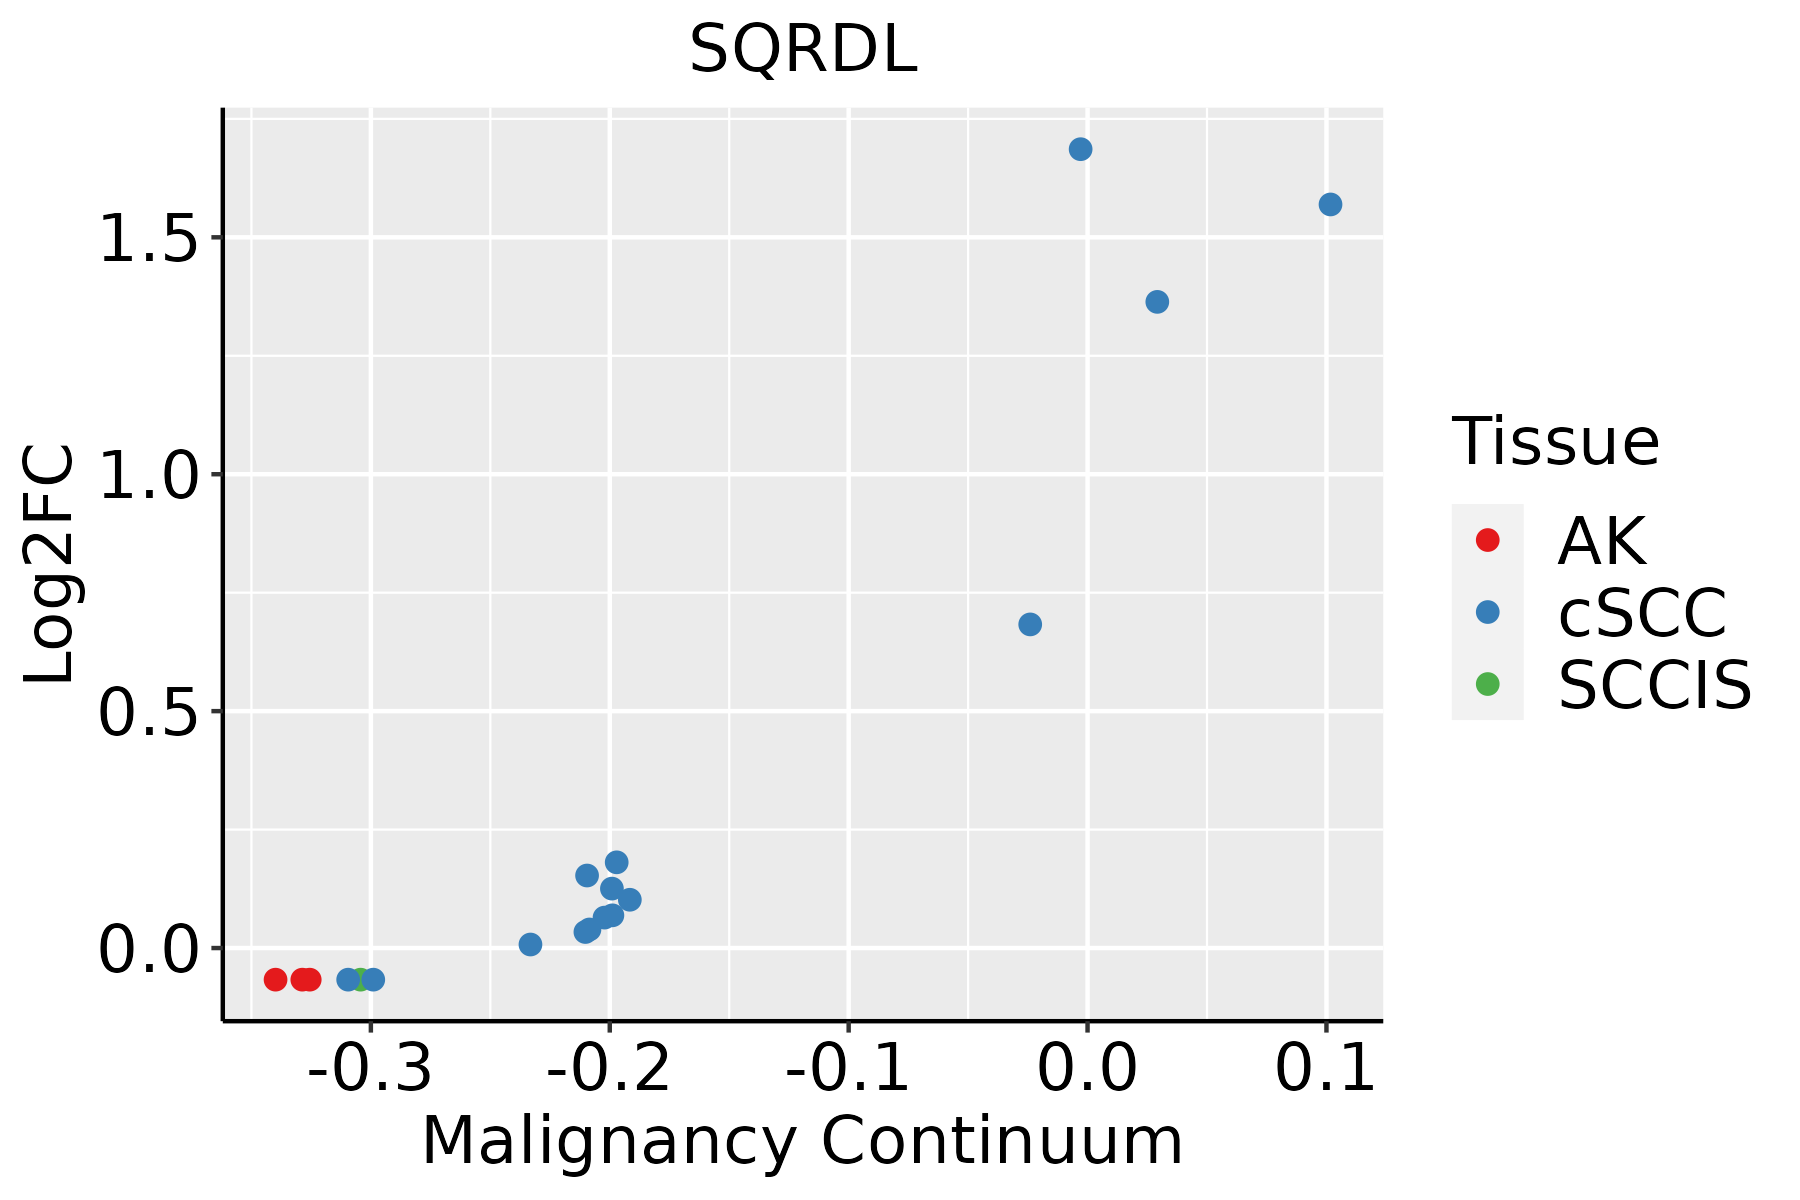 | AK: Actinic keratosis |
| cSCC: Cutaneous squamous cell carcinoma | ||
| SCCIS:squamous cell carcinoma in situ |
| ∗log2FC in expression of this searched gene in stem-like cells from each diseased tissue sample relative to stem-like cells in normal samples in each tissue plotted against the malignancy continuum. Samples are colored based on if they are from different disease stage. |
Top |
Malignant transformation related pathway analysis |
| Find out the enriched GO biological processes and KEGG pathways involved in transition from healthy to precancer to cancer |
| Tissue | Disease Stage | Enriched GO biological Processes |
| Colorectum | AD |  |
| Colorectum | SER |  |
| Colorectum | MSS |  |
| Colorectum | MSI-H |  |
| Colorectum | FAP |  |
| ∗Top 15 enriched GO BP terms are showed in the bar plot of each disease state in each tissue. Each row represents a significant GO biological process which is colored according to the -log10(p.adjust). |
| Page: 1 2 3 4 5 6 7 8 9 |
| GO ID | Tissue | Disease Stage | Description | Gene Ratio | Bg Ratio | pvalue | p.adjust | Count |
| Page: 1 |
| Pathway ID | Tissue | Disease Stage | Description | Gene Ratio | Bg Ratio | pvalue | p.adjust | qvalue | Count |
| hsa009202 | Colorectum | SER | Sulfur metabolism | 8/1580 | 10/8465 | 4.56e-05 | 5.22e-04 | 3.79e-04 | 8 |
| hsa009203 | Colorectum | SER | Sulfur metabolism | 8/1580 | 10/8465 | 4.56e-05 | 5.22e-04 | 3.79e-04 | 8 |
| hsa009204 | Colorectum | MSS | Sulfur metabolism | 6/1875 | 10/8465 | 1.07e-02 | 3.74e-02 | 2.29e-02 | 6 |
| hsa009205 | Colorectum | MSS | Sulfur metabolism | 6/1875 | 10/8465 | 1.07e-02 | 3.74e-02 | 2.29e-02 | 6 |
| hsa009206 | Colorectum | FAP | Sulfur metabolism | 6/1404 | 10/8465 | 2.36e-03 | 1.13e-02 | 6.85e-03 | 6 |
| hsa009207 | Colorectum | FAP | Sulfur metabolism | 6/1404 | 10/8465 | 2.36e-03 | 1.13e-02 | 6.85e-03 | 6 |
| hsa009208 | Colorectum | CRC | Sulfur metabolism | 5/1091 | 10/8465 | 5.07e-03 | 2.72e-02 | 1.84e-02 | 5 |
| hsa009209 | Colorectum | CRC | Sulfur metabolism | 5/1091 | 10/8465 | 5.07e-03 | 2.72e-02 | 1.84e-02 | 5 |
| hsa0092010 | Esophagus | ESCC | Sulfur metabolism | 9/4205 | 10/8465 | 1.01e-02 | 2.38e-02 | 1.22e-02 | 9 |
| hsa0092011 | Esophagus | ESCC | Sulfur metabolism | 9/4205 | 10/8465 | 1.01e-02 | 2.38e-02 | 1.22e-02 | 9 |
| Page: 1 |
Top |
Cell-cell communication analysis |
| Identification of potential cell-cell interactions between two cell types and their ligand-receptor pairs for different disease states |
| Ligand | Receptor | LRpair | Pathway | Tissue | Disease Stage |
| Page: 1 |
Top |
Single-cell gene regulatory network inference analysis |
| Find out the significant the regulons (TFs) and the target genes of each regulon across cell types for different disease states |
| TF | Cell Type | Tissue | Disease Stage | Target Gene | RSS | Regulon Activity |
| ∗The dot plots of a searched regulon are shown for all cell subpopulations in each disease state of each tissue based on the regulon specific score inferred using pySCENIC and by calculating the average expression. |
| Page: 1 |
Top |
Somatic mutation of malignant transformation related genes |
| Annotation of somatic variants for genes involved in malignant transformation |
| Hugo Symbol | Variant Class | Variant Classification | dbSNP RS | HGVSc | HGVSp | HGVSp Short | SWISSPROT | BIOTYPE | SIFT | PolyPhen | Tumor Sample Barcode | Tissue | Histology | Sex | Age | Stage | Therapy Types | Drugs | Outcome |
| SQRDL | SNV | Missense_Mutation | c.755A>T | p.Glu252Val | p.E252V | Q9Y6N5 | protein_coding | deleterious(0.05) | possibly_damaging(0.616) | TCGA-BH-A18V-01 | Breast | breast invasive carcinoma | Female | <65 | I/II | Unknown | Unknown | SD | |
| SQRDL | SNV | Missense_Mutation | c.573C>G | p.Ile191Met | p.I191M | Q9Y6N5 | protein_coding | deleterious(0) | possibly_damaging(0.626) | TCGA-E2-A2P6-01 | Breast | breast invasive carcinoma | Female | >=65 | I/II | Hormone Therapy | anastrozole | SD | |
| SQRDL | SNV | Missense_Mutation | rs764809712 | c.245A>C | p.Tyr82Ser | p.Y82S | Q9Y6N5 | protein_coding | deleterious(0) | probably_damaging(0.999) | TCGA-E9-A1N5-01 | Breast | breast invasive carcinoma | Female | <65 | I/II | Chemotherapy | doxorubicin | SD |
| SQRDL | SNV | Missense_Mutation | c.874N>A | p.Leu292Ile | p.L292I | Q9Y6N5 | protein_coding | tolerated(0.27) | possibly_damaging(0.836) | TCGA-AA-3492-01 | Colorectum | colon adenocarcinoma | Female | >=65 | I/II | Unknown | Unknown | SD | |
| SQRDL | SNV | Missense_Mutation | c.523N>A | p.Val175Ile | p.V175I | Q9Y6N5 | protein_coding | deleterious(0) | possibly_damaging(0.588) | TCGA-AA-3715-01 | Colorectum | colon adenocarcinoma | Male | >=65 | I/II | Unknown | Unknown | PD | |
| SQRDL | SNV | Missense_Mutation | novel | c.430N>A | p.Ala144Thr | p.A144T | Q9Y6N5 | protein_coding | deleterious(0) | probably_damaging(0.912) | TCGA-A5-A0G2-01 | Endometrium | uterine corpus endometrioid carcinoma | Female | <65 | III/IV | Unknown | Unknown | SD |
| SQRDL | SNV | Missense_Mutation | novel | c.980N>A | p.Arg327Lys | p.R327K | Q9Y6N5 | protein_coding | tolerated(1) | benign(0) | TCGA-A5-A1OF-01 | Endometrium | uterine corpus endometrioid carcinoma | Female | <65 | I/II | Unknown | Unknown | SD |
| SQRDL | SNV | Missense_Mutation | novel | c.370N>A | p.Asp124Asn | p.D124N | Q9Y6N5 | protein_coding | tolerated(0.18) | benign(0.098) | TCGA-AJ-A3EK-01 | Endometrium | uterine corpus endometrioid carcinoma | Female | <65 | I/II | Chemotherapy | carboplatin | CR |
| SQRDL | SNV | Missense_Mutation | c.670N>G | p.Lys224Glu | p.K224E | Q9Y6N5 | protein_coding | deleterious(0.04) | benign(0.213) | TCGA-AP-A056-01 | Endometrium | uterine corpus endometrioid carcinoma | Female | <65 | I/II | Unknown | Unknown | SD | |
| SQRDL | SNV | Missense_Mutation | novel | c.1223N>A | p.Ser408Asn | p.S408N | Q9Y6N5 | protein_coding | tolerated(0.17) | benign(0.009) | TCGA-AP-A1DV-01 | Endometrium | uterine corpus endometrioid carcinoma | Female | <65 | I/II | Unknown | Unknown | SD |
| Page: 1 2 3 4 |
Top |
Related drugs of malignant transformation related genes |
| Identification of chemicals and drugs interact with genes involved in malignant transfromation |
| (DGIdb 4.0) |
| Entrez ID | Symbol | Category | Interaction Types | Drug Claim Name | Drug Name | PMIDs |
| Page: 1 |

Copyright 2023-Present -The University of Texas Health Science Center at Houston |