
|
|||||
|
 | |
| |
| |
| |
| |
| |
|
Gene: SQOR |
Gene summary for SQOR |
| Gene information | Species | Human | Gene symbol | SQOR | Gene ID | 58472 |
| Gene name | sulfide quinone oxidoreductase | |
| Gene Alias | CGI-44 | |
| Cytomap | 15q21.1 | |
| Gene Type | protein-coding | GO ID | GO:0006790 | UniProtAcc | A0A024R5X2 |
Top |
Malignant transformation analysis |
| Identification of the aberrant gene expression in precancerous and cancerous lesions by comparing the gene expression of stem-like cells in diseased tissues with normal stem cells |
| Entrez ID | Symbol | Replicates | Species | Organ | Tissue | Adj P-value | Log2FC | Malignancy |
| 58472 | SQOR | GSM4909282 | Human | Breast | IDC | 1.57e-08 | 3.20e-01 | -0.0288 |
| 58472 | SQOR | GSM4909286 | Human | Breast | IDC | 1.48e-02 | -1.14e-01 | 0.1081 |
| 58472 | SQOR | GSM4909290 | Human | Breast | IDC | 6.59e-06 | 2.38e-01 | 0.2096 |
| 58472 | SQOR | GSM4909305 | Human | Breast | IDC | 4.93e-04 | 1.39e-01 | 0.0436 |
| 58472 | SQOR | GSM4909308 | Human | Breast | IDC | 1.92e-06 | 2.30e-01 | 0.158 |
| 58472 | SQOR | GSM4909319 | Human | Breast | IDC | 4.58e-03 | -9.21e-03 | 0.1563 |
| 58472 | SQOR | ctrl6 | Human | Breast | Precancer | 1.26e-10 | 4.20e-01 | -0.0061 |
| 58472 | SQOR | brca1 | Human | Breast | Precancer | 7.01e-03 | -1.14e-01 | -0.0338 |
| 58472 | SQOR | brca7 | Human | Breast | Precancer | 2.82e-02 | 5.95e-01 | -0.009 |
| 58472 | SQOR | brca10 | Human | Breast | Precancer | 1.58e-29 | 6.91e-01 | -0.0029 |
| 58472 | SQOR | DCIS2 | Human | Breast | DCIS | 2.23e-18 | 5.44e-03 | 0.0085 |
| 58472 | SQOR | N_HPV_2 | Human | Cervix | N_HPV | 1.98e-03 | 1.70e-01 | -0.0131 |
| 58472 | SQOR | Tumor | Human | Cervix | CC | 1.72e-03 | -1.55e-01 | 0.1241 |
| 58472 | SQOR | sample3 | Human | Cervix | CC | 1.58e-28 | 5.16e-01 | 0.1387 |
| 58472 | SQOR | T3 | Human | Cervix | CC | 5.85e-22 | 5.30e-01 | 0.1389 |
| 58472 | SQOR | HTA11_2487_2000001011 | Human | Colorectum | SER | 1.68e-28 | 1.06e+00 | -0.1808 |
| 58472 | SQOR | HTA11_1938_2000001011 | Human | Colorectum | AD | 1.64e-12 | 8.69e-01 | -0.0811 |
| 58472 | SQOR | HTA11_78_2000001011 | Human | Colorectum | AD | 3.62e-14 | 9.62e-01 | -0.1088 |
| 58472 | SQOR | HTA11_347_2000001011 | Human | Colorectum | AD | 4.39e-46 | 1.22e+00 | -0.1954 |
| 58472 | SQOR | HTA11_411_2000001011 | Human | Colorectum | SER | 1.98e-09 | 1.60e+00 | -0.2602 |
| Page: 1 2 3 4 5 6 7 |
| Tissue | Expression Dynamics | Abbreviation |
| Breast | 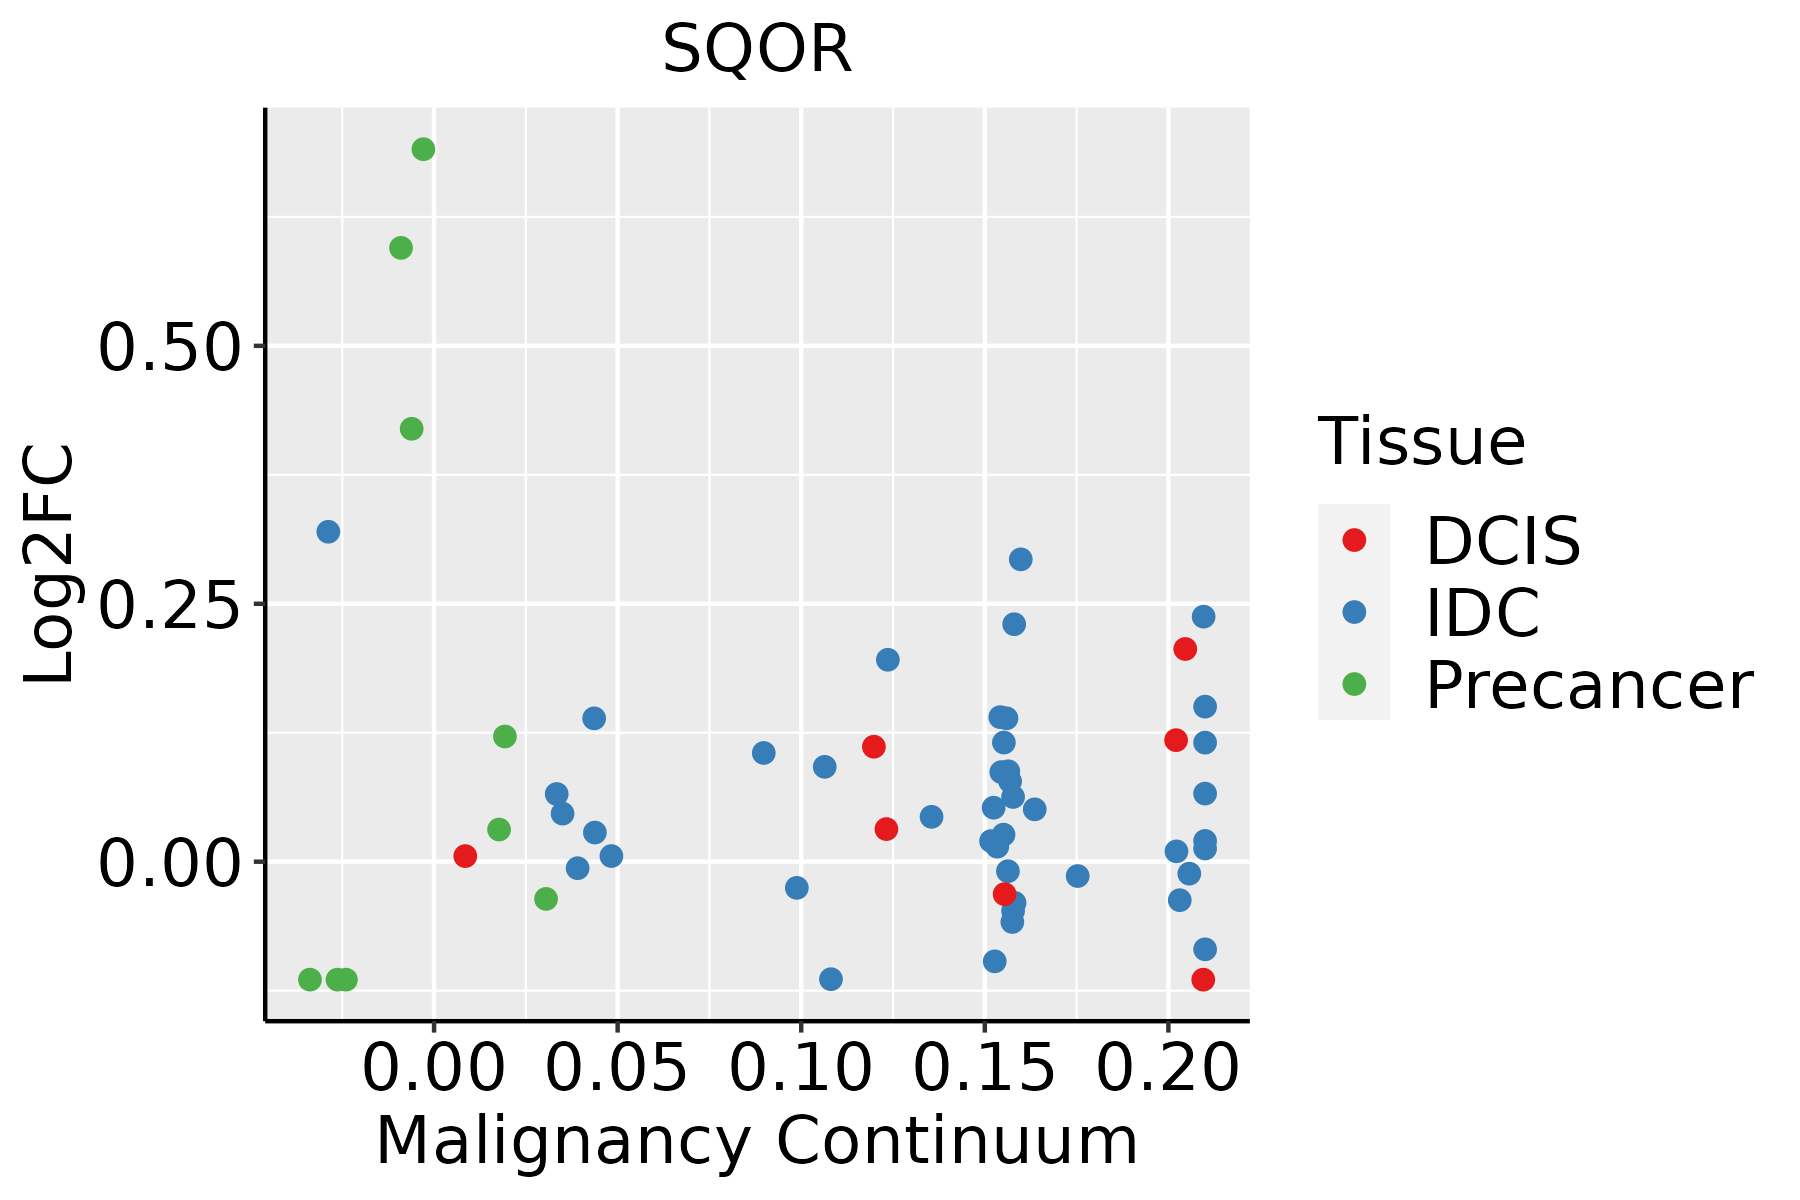 | IDC: Invasive ductal carcinoma |
| DCIS: Ductal carcinoma in situ | ||
| Precancer(BRCA1-mut): Precancerous lesion from BRCA1 mutation carriers | ||
| Cervix |  | CC: Cervix cancer |
| HSIL_HPV: HPV-infected high-grade squamous intraepithelial lesions | ||
| N_HPV: HPV-infected normal cervix | ||
| Colorectum (GSE201348) |  | FAP: Familial adenomatous polyposis |
| CRC: Colorectal cancer | ||
| Colorectum (HTA11) |  | AD: Adenomas |
| SER: Sessile serrated lesions | ||
| MSI-H: Microsatellite-high colorectal cancer | ||
| MSS: Microsatellite stable colorectal cancer | ||
| Esophagus | 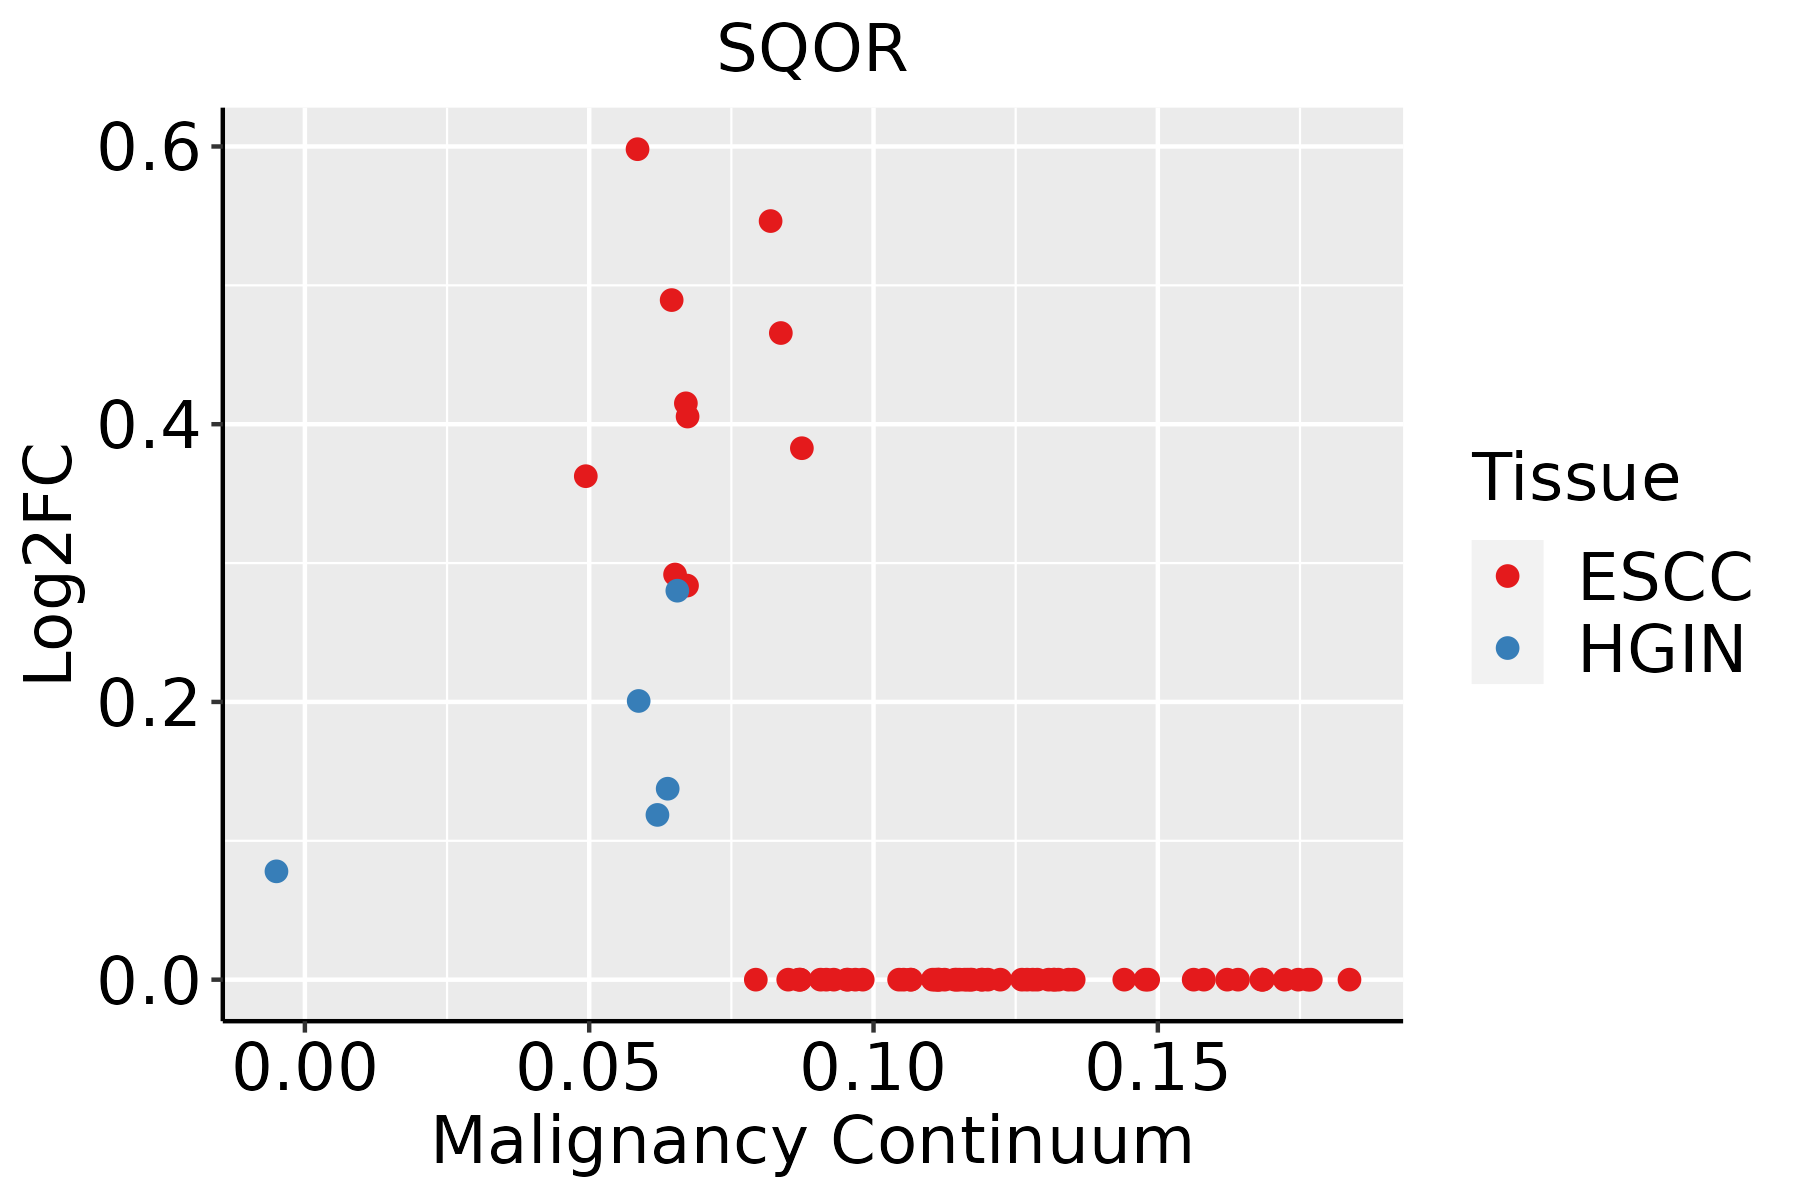 | ESCC: Esophageal squamous cell carcinoma |
| HGIN: High-grade intraepithelial neoplasias | ||
| LGIN: Low-grade intraepithelial neoplasias | ||
| GC |  | CAG: Chronic atrophic gastritis |
| CAG with IM: Chronic atrophic gastritis with intestinal metaplasia | ||
| CSG: Chronic superficial gastritis | ||
| GC: Gastric cancer | ||
| SIM: Severe intestinal metaplasia | ||
| WIM: Wild intestinal metaplasia | ||
| Liver | 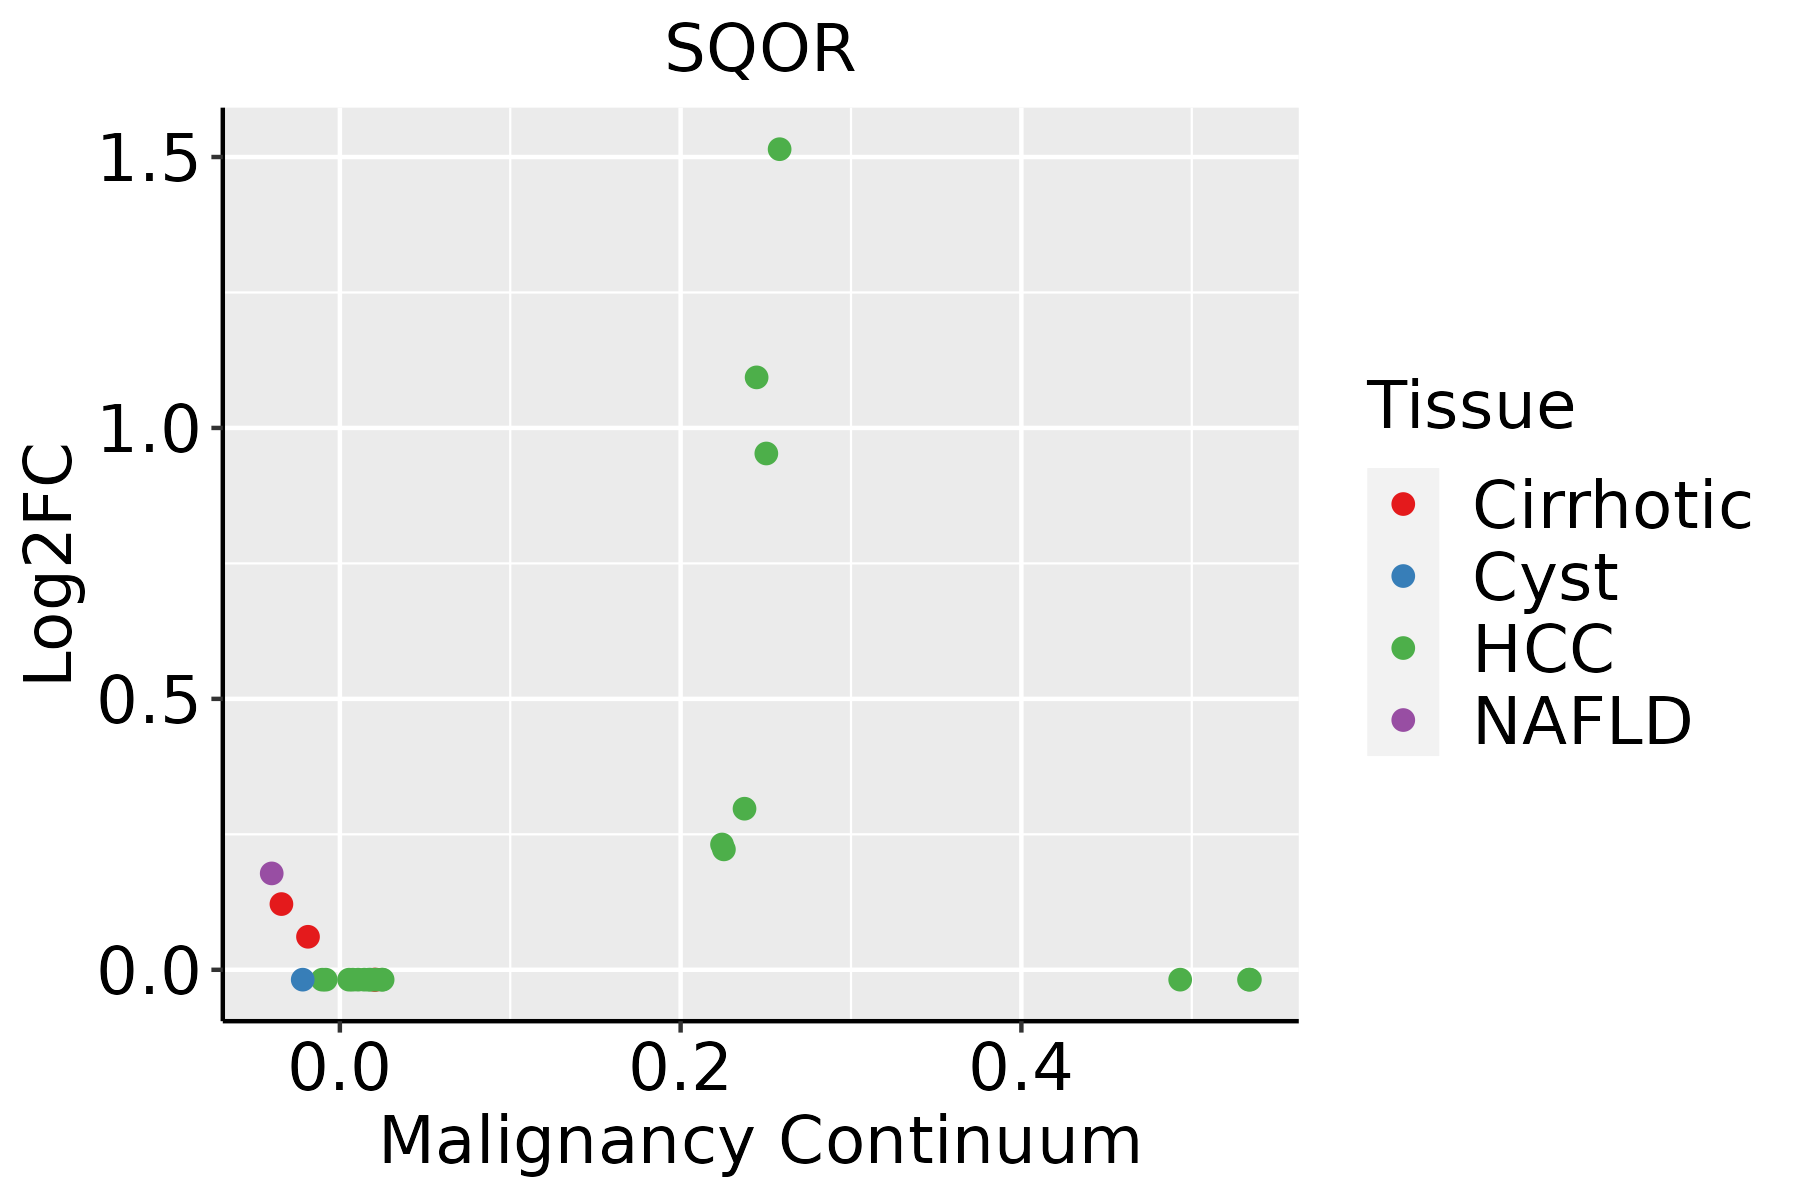 | HCC: Hepatocellular carcinoma |
| NAFLD: Non-alcoholic fatty liver disease | ||
| Prostate |  | BPH: Benign Prostatic Hyperplasia |
| Thyroid |  | ATC: Anaplastic thyroid cancer |
| HT: Hashimoto's thyroiditis | ||
| PTC: Papillary thyroid cancer |
| ∗log2FC in expression of this searched gene in stem-like cells from each diseased tissue sample relative to stem-like cells in normal samples in each tissue plotted against the malignancy continuum. Samples are colored based on if they are from different disease stage. |
Top |
Malignant transformation related pathway analysis |
| Find out the enriched GO biological processes and KEGG pathways involved in transition from healthy to precancer to cancer |
| Tissue | Disease Stage | Enriched GO biological Processes |
| Colorectum | AD |  |
| Colorectum | SER |  |
| Colorectum | MSS |  |
| Colorectum | MSI-H |  |
| Colorectum | FAP |  |
| ∗Top 15 enriched GO BP terms are showed in the bar plot of each disease state in each tissue. Each row represents a significant GO biological process which is colored according to the -log10(p.adjust). |
| Page: 1 2 3 4 5 6 7 8 9 |
| GO ID | Tissue | Disease Stage | Description | Gene Ratio | Bg Ratio | pvalue | p.adjust | Count |
| GO:0006790 | Colorectum | AD | sulfur compound metabolic process | 101/3918 | 339/18723 | 6.46e-05 | 1.07e-03 | 101 |
| GO:00067901 | Colorectum | SER | sulfur compound metabolic process | 73/2897 | 339/18723 | 1.75e-03 | 1.81e-02 | 73 |
| GO:00067902 | Colorectum | MSS | sulfur compound metabolic process | 85/3467 | 339/18723 | 1.52e-03 | 1.39e-02 | 85 |
| GO:00067906 | Esophagus | ESCC | sulfur compound metabolic process | 201/8552 | 339/18723 | 2.64e-07 | 3.94e-06 | 201 |
| GO:000679021 | Liver | HCC | sulfur compound metabolic process | 212/7958 | 339/18723 | 5.60e-14 | 3.39e-12 | 212 |
| GO:00067903 | Stomach | GC | sulfur compound metabolic process | 35/1159 | 339/18723 | 2.10e-03 | 2.10e-02 | 35 |
| Page: 1 |
| Pathway ID | Tissue | Disease Stage | Description | Gene Ratio | Bg Ratio | pvalue | p.adjust | qvalue | Count |
| hsa009202 | Colorectum | SER | Sulfur metabolism | 8/1580 | 10/8465 | 4.56e-05 | 5.22e-04 | 3.79e-04 | 8 |
| hsa009203 | Colorectum | SER | Sulfur metabolism | 8/1580 | 10/8465 | 4.56e-05 | 5.22e-04 | 3.79e-04 | 8 |
| hsa009204 | Colorectum | MSS | Sulfur metabolism | 6/1875 | 10/8465 | 1.07e-02 | 3.74e-02 | 2.29e-02 | 6 |
| hsa009205 | Colorectum | MSS | Sulfur metabolism | 6/1875 | 10/8465 | 1.07e-02 | 3.74e-02 | 2.29e-02 | 6 |
| hsa009206 | Colorectum | FAP | Sulfur metabolism | 6/1404 | 10/8465 | 2.36e-03 | 1.13e-02 | 6.85e-03 | 6 |
| hsa009207 | Colorectum | FAP | Sulfur metabolism | 6/1404 | 10/8465 | 2.36e-03 | 1.13e-02 | 6.85e-03 | 6 |
| hsa009208 | Colorectum | CRC | Sulfur metabolism | 5/1091 | 10/8465 | 5.07e-03 | 2.72e-02 | 1.84e-02 | 5 |
| hsa009209 | Colorectum | CRC | Sulfur metabolism | 5/1091 | 10/8465 | 5.07e-03 | 2.72e-02 | 1.84e-02 | 5 |
| hsa0092010 | Esophagus | ESCC | Sulfur metabolism | 9/4205 | 10/8465 | 1.01e-02 | 2.38e-02 | 1.22e-02 | 9 |
| hsa0092011 | Esophagus | ESCC | Sulfur metabolism | 9/4205 | 10/8465 | 1.01e-02 | 2.38e-02 | 1.22e-02 | 9 |
| Page: 1 |
Top |
Cell-cell communication analysis |
| Identification of potential cell-cell interactions between two cell types and their ligand-receptor pairs for different disease states |
| Ligand | Receptor | LRpair | Pathway | Tissue | Disease Stage |
| Page: 1 |
Top |
Single-cell gene regulatory network inference analysis |
| Find out the significant the regulons (TFs) and the target genes of each regulon across cell types for different disease states |
| TF | Cell Type | Tissue | Disease Stage | Target Gene | RSS | Regulon Activity |
| ∗The dot plots of a searched regulon are shown for all cell subpopulations in each disease state of each tissue based on the regulon specific score inferred using pySCENIC and by calculating the average expression. |
| Page: 1 |
Top |
Somatic mutation of malignant transformation related genes |
| Annotation of somatic variants for genes involved in malignant transformation |
| Hugo Symbol | Variant Class | Variant Classification | dbSNP RS | HGVSc | HGVSp | HGVSp Short | SWISSPROT | BIOTYPE | SIFT | PolyPhen | Tumor Sample Barcode | Tissue | Histology | Sex | Age | Stage | Therapy Types | Drugs | Outcome |
| Page: 1 |
Top |
Related drugs of malignant transformation related genes |
| Identification of chemicals and drugs interact with genes involved in malignant transfromation |
| (DGIdb 4.0) |
| Entrez ID | Symbol | Category | Interaction Types | Drug Claim Name | Drug Name | PMIDs |
| Page: 1 |

Copyright 2023-Present -The University of Texas Health Science Center at Houston |