
|
|||||
|
 | |
| |
| |
| |
| |
| |
|
Gene: SQLE |
Gene summary for SQLE |
| Gene information | Species | Human | Gene symbol | SQLE | Gene ID | 6713 |
| Gene name | squalene epoxidase | |
| Gene Alias | SQLE | |
| Cytomap | 8q24.13 | |
| Gene Type | protein-coding | GO ID | GO:0006066 | UniProtAcc | Q14534 |
Top |
Malignant transformation analysis |
| Identification of the aberrant gene expression in precancerous and cancerous lesions by comparing the gene expression of stem-like cells in diseased tissues with normal stem cells |
| Entrez ID | Symbol | Replicates | Species | Organ | Tissue | Adj P-value | Log2FC | Malignancy |
| 6713 | SQLE | GSM4909281 | Human | Breast | IDC | 3.51e-51 | 1.00e+00 | 0.21 |
| 6713 | SQLE | GSM4909282 | Human | Breast | IDC | 1.13e-07 | 4.22e-01 | -0.0288 |
| 6713 | SQLE | GSM4909285 | Human | Breast | IDC | 1.35e-20 | 5.67e-01 | 0.21 |
| 6713 | SQLE | GSM4909286 | Human | Breast | IDC | 5.94e-09 | 3.51e-01 | 0.1081 |
| 6713 | SQLE | GSM4909290 | Human | Breast | IDC | 1.29e-55 | 1.14e+00 | 0.2096 |
| 6713 | SQLE | GSM4909291 | Human | Breast | IDC | 4.71e-47 | 1.14e+00 | 0.1753 |
| 6713 | SQLE | GSM4909296 | Human | Breast | IDC | 6.91e-04 | 4.82e-03 | 0.1524 |
| 6713 | SQLE | GSM4909301 | Human | Breast | IDC | 9.57e-22 | 6.53e-01 | 0.1577 |
| 6713 | SQLE | GSM4909311 | Human | Breast | IDC | 1.45e-15 | 1.45e-01 | 0.1534 |
| 6713 | SQLE | GSM4909312 | Human | Breast | IDC | 1.05e-18 | 6.04e-01 | 0.1552 |
| 6713 | SQLE | GSM4909317 | Human | Breast | IDC | 3.50e-11 | 4.30e-01 | 0.1355 |
| 6713 | SQLE | GSM4909319 | Human | Breast | IDC | 7.96e-17 | 7.03e-02 | 0.1563 |
| 6713 | SQLE | GSM4909320 | Human | Breast | IDC | 4.80e-07 | 3.79e-01 | 0.1575 |
| 6713 | SQLE | brca2 | Human | Breast | Precancer | 2.10e-14 | 4.65e-01 | -0.024 |
| 6713 | SQLE | M2 | Human | Breast | IDC | 2.36e-04 | 4.80e-01 | 0.21 |
| 6713 | SQLE | NCCBC14 | Human | Breast | DCIS | 2.09e-04 | 3.92e-02 | 0.2021 |
| 6713 | SQLE | NCCBC5 | Human | Breast | DCIS | 1.79e-03 | 1.26e-01 | 0.2046 |
| 6713 | SQLE | P1 | Human | Breast | IDC | 4.17e-02 | -4.25e-02 | 0.1527 |
| 6713 | SQLE | DCIS2 | Human | Breast | DCIS | 1.28e-18 | -6.09e-02 | 0.0085 |
| 6713 | SQLE | Tumor | Human | Cervix | CC | 5.46e-19 | 5.34e-01 | 0.1241 |
| Page: 1 2 3 4 5 6 7 |
| Tissue | Expression Dynamics | Abbreviation |
| Breast |  | IDC: Invasive ductal carcinoma |
| DCIS: Ductal carcinoma in situ | ||
| Precancer(BRCA1-mut): Precancerous lesion from BRCA1 mutation carriers | ||
| Cervix |  | CC: Cervix cancer |
| HSIL_HPV: HPV-infected high-grade squamous intraepithelial lesions | ||
| N_HPV: HPV-infected normal cervix | ||
| Esophagus | 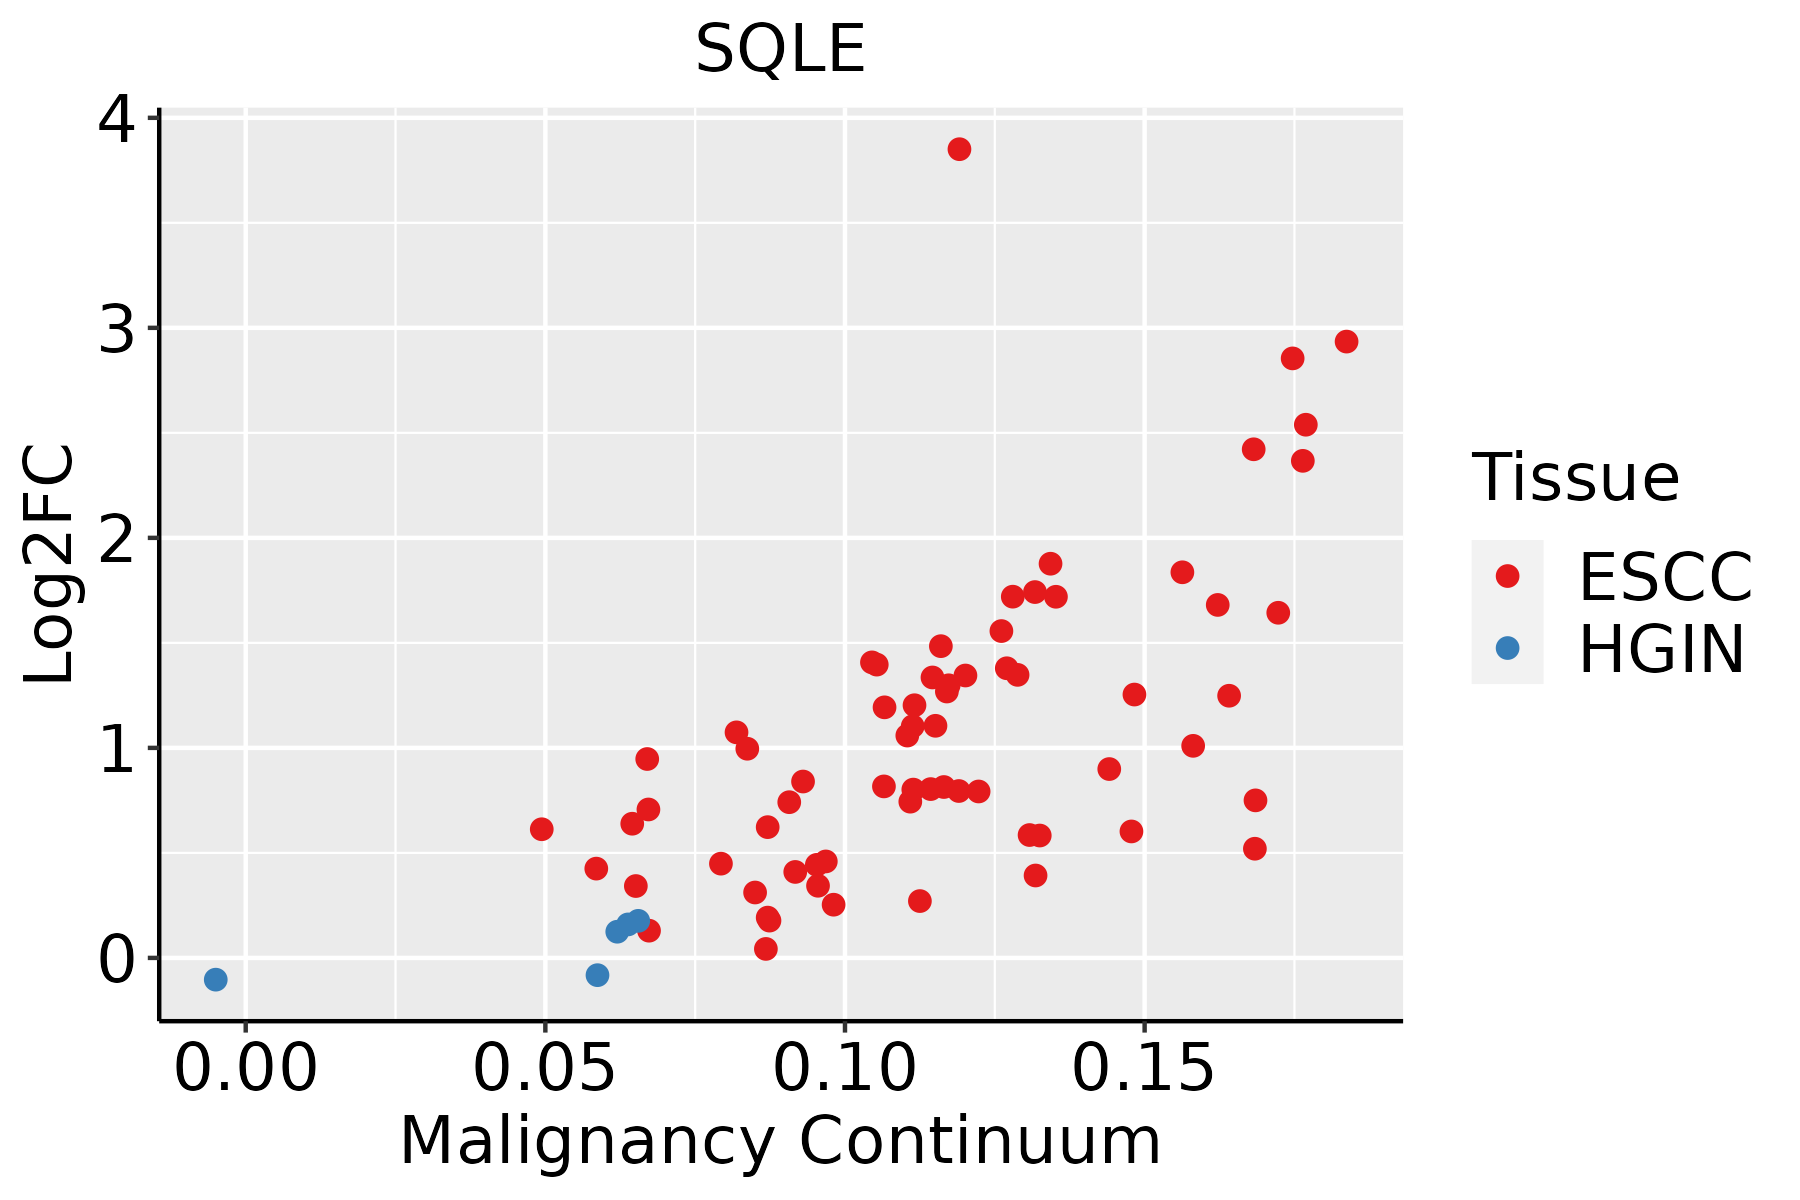 | ESCC: Esophageal squamous cell carcinoma |
| HGIN: High-grade intraepithelial neoplasias | ||
| LGIN: Low-grade intraepithelial neoplasias | ||
| Liver | 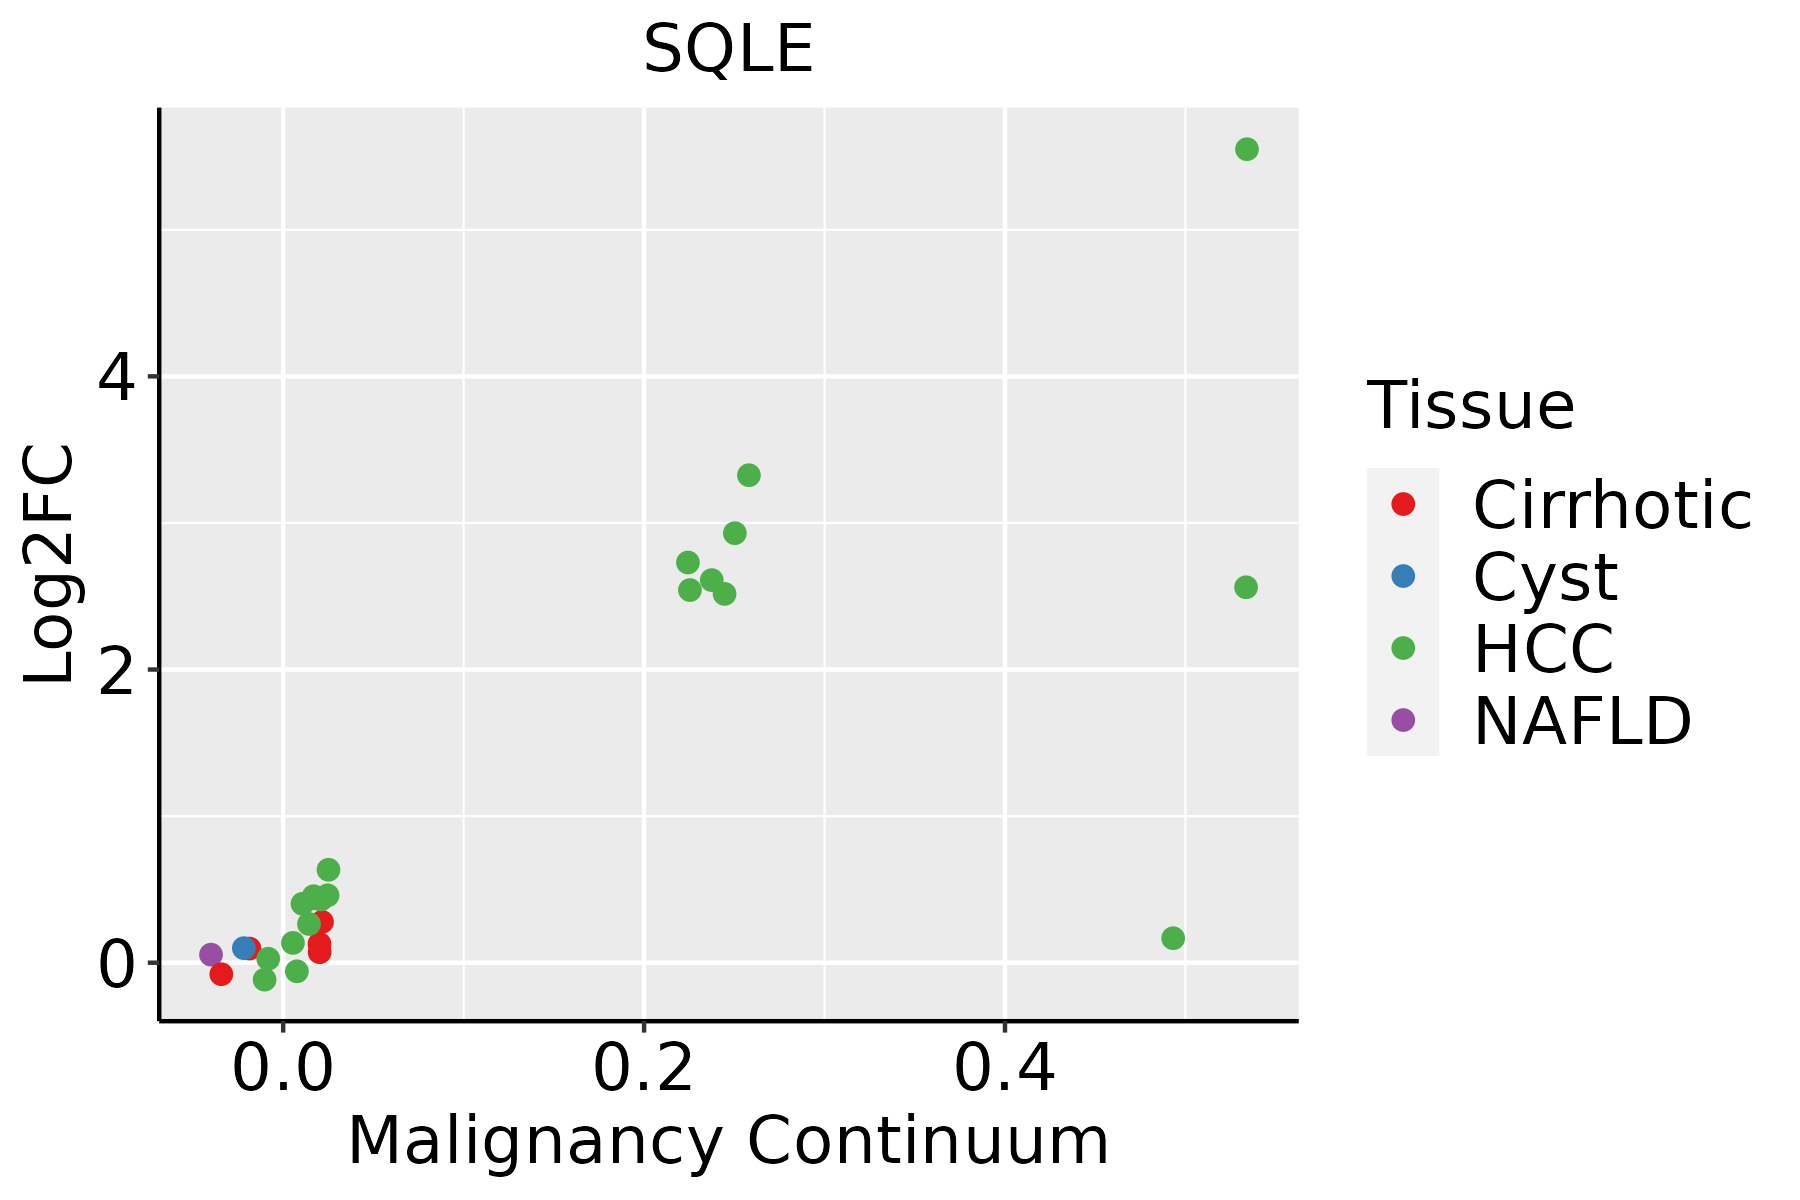 | HCC: Hepatocellular carcinoma |
| NAFLD: Non-alcoholic fatty liver disease | ||
| Oral Cavity | 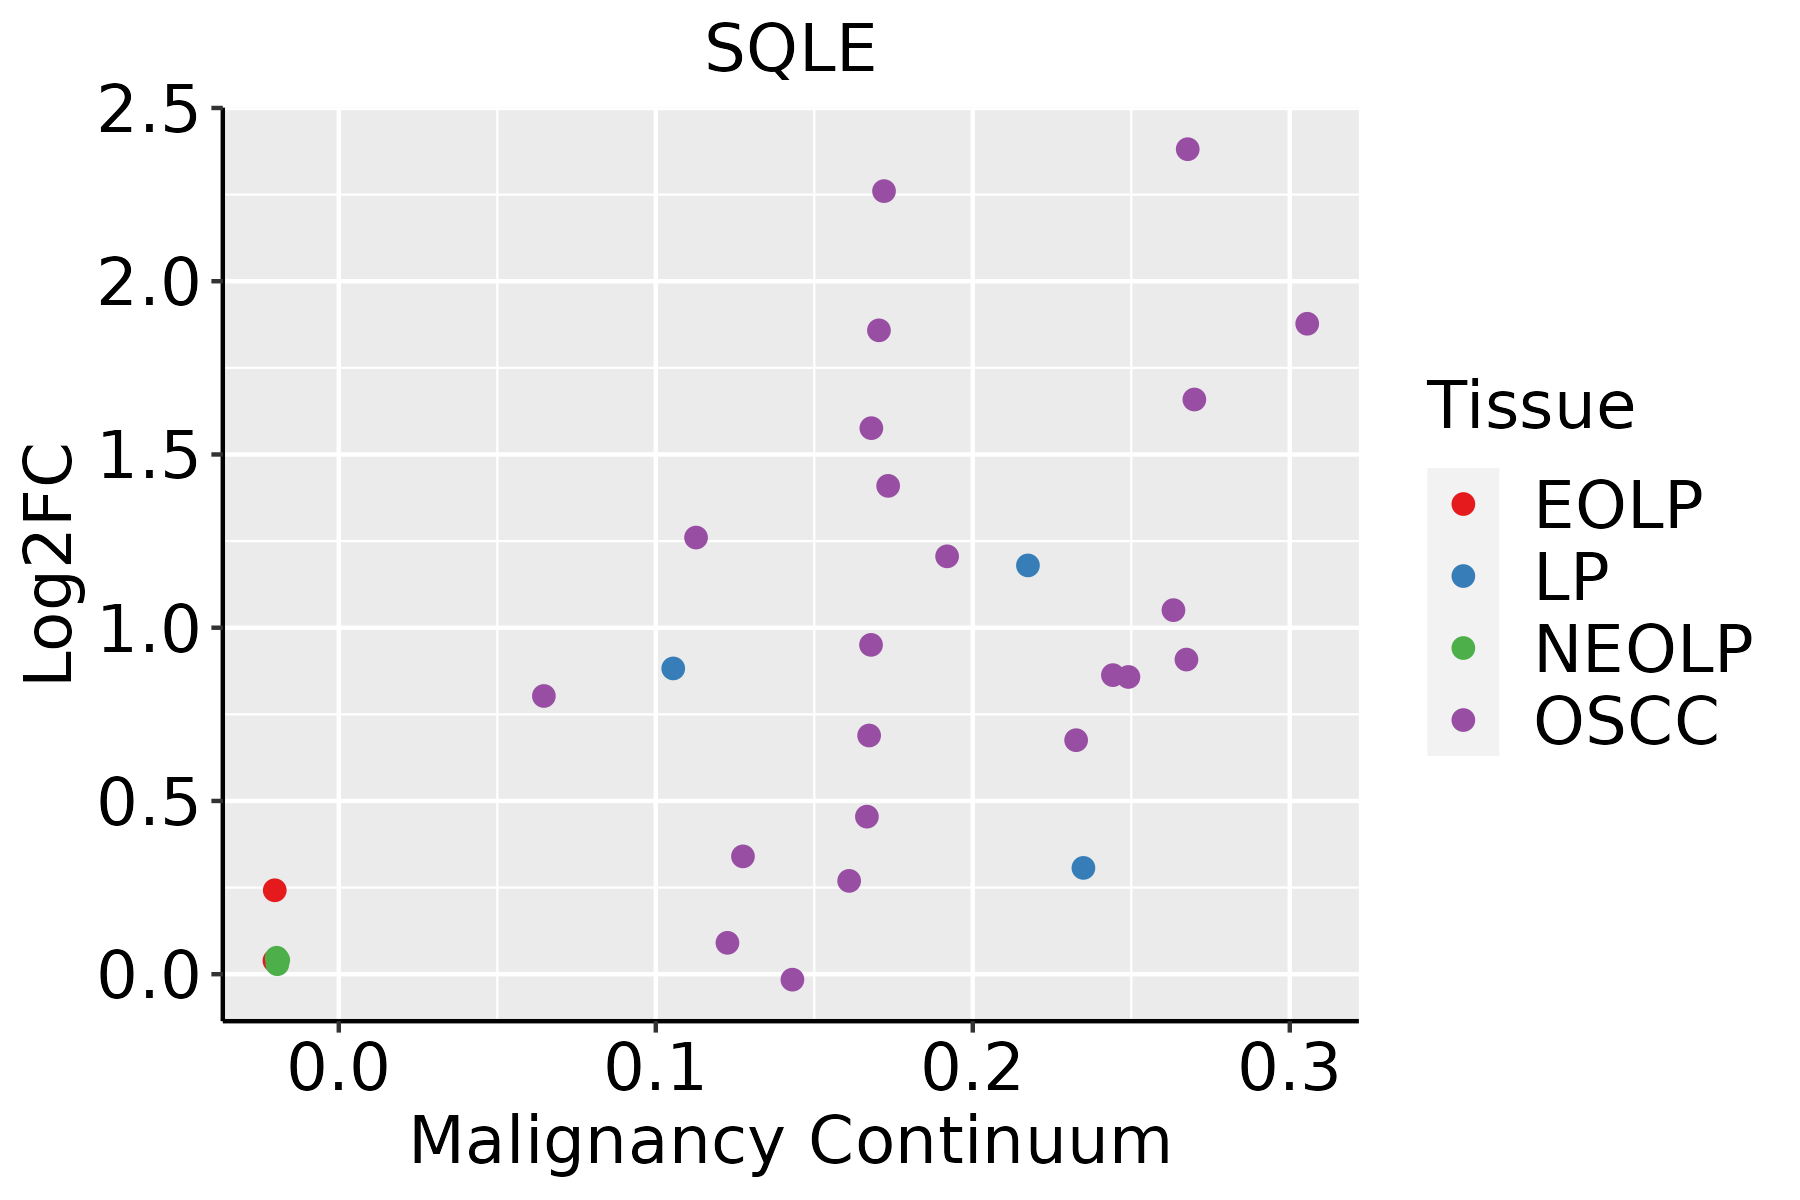 | EOLP: Erosive Oral lichen planus |
| LP: leukoplakia | ||
| NEOLP: Non-erosive oral lichen planus | ||
| OSCC: Oral squamous cell carcinoma | ||
| Skin | 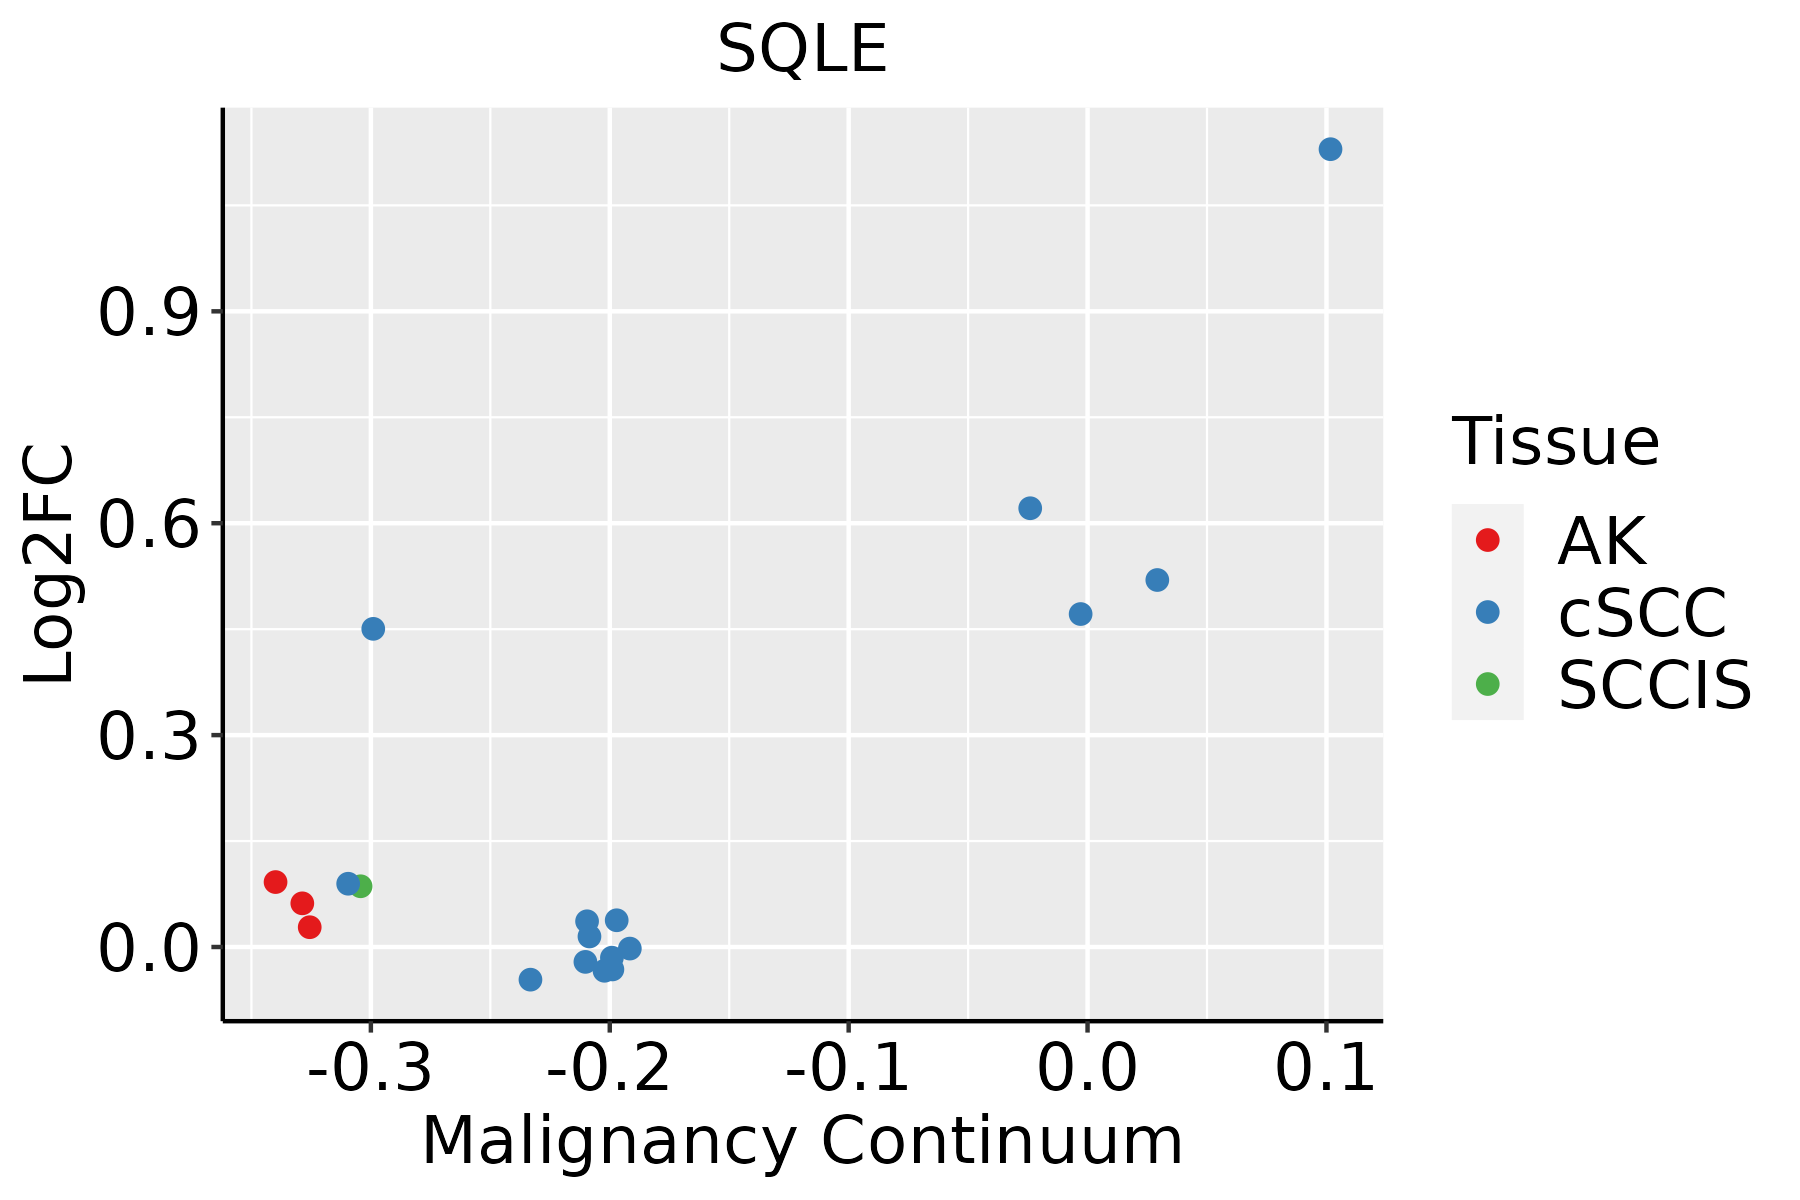 | AK: Actinic keratosis |
| cSCC: Cutaneous squamous cell carcinoma | ||
| SCCIS:squamous cell carcinoma in situ | ||
| Thyroid |  | ATC: Anaplastic thyroid cancer |
| HT: Hashimoto's thyroiditis | ||
| PTC: Papillary thyroid cancer |
| ∗log2FC in expression of this searched gene in stem-like cells from each diseased tissue sample relative to stem-like cells in normal samples in each tissue plotted against the malignancy continuum. Samples are colored based on if they are from different disease stage. |
Top |
Malignant transformation related pathway analysis |
| Find out the enriched GO biological processes and KEGG pathways involved in transition from healthy to precancer to cancer |
| Tissue | Disease Stage | Enriched GO biological Processes |
| Colorectum | AD |  |
| Colorectum | SER |  |
| Colorectum | MSS |  |
| Colorectum | MSI-H |  |
| Colorectum | FAP |  |
| ∗Top 15 enriched GO BP terms are showed in the bar plot of each disease state in each tissue. Each row represents a significant GO biological process which is colored according to the -log10(p.adjust). |
| Page: 1 2 3 4 5 6 7 8 9 |
| GO ID | Tissue | Disease Stage | Description | Gene Ratio | Bg Ratio | pvalue | p.adjust | Count |
| GO:00512358 | Breast | Precancer | maintenance of location | 40/1080 | 327/18723 | 5.85e-06 | 1.71e-04 | 40 |
| GO:005123513 | Breast | IDC | maintenance of location | 48/1434 | 327/18723 | 9.90e-06 | 2.77e-04 | 48 |
| GO:00066944 | Breast | IDC | steroid biosynthetic process | 25/1434 | 173/18723 | 1.56e-03 | 1.56e-02 | 25 |
| GO:005123523 | Breast | DCIS | maintenance of location | 47/1390 | 327/18723 | 9.55e-06 | 2.56e-04 | 47 |
| GO:000669411 | Breast | DCIS | steroid biosynthetic process | 23/1390 | 173/18723 | 4.63e-03 | 3.52e-02 | 23 |
| GO:00512359 | Cervix | CC | maintenance of location | 78/2311 | 327/18723 | 5.18e-09 | 4.92e-07 | 78 |
| GO:0051235110 | Esophagus | ESCC | maintenance of location | 200/8552 | 327/18723 | 1.01e-08 | 2.02e-07 | 200 |
| GO:00060668 | Esophagus | ESCC | alcohol metabolic process | 202/8552 | 353/18723 | 7.32e-06 | 7.26e-05 | 202 |
| GO:00161263 | Esophagus | ESCC | sterol biosynthetic process | 46/8552 | 64/18723 | 1.91e-05 | 1.67e-04 | 46 |
| GO:00199155 | Esophagus | ESCC | lipid storage | 58/8552 | 87/18723 | 6.15e-05 | 4.72e-04 | 58 |
| GO:19026524 | Esophagus | ESCC | secondary alcohol metabolic process | 87/8552 | 147/18723 | 6.58e-04 | 3.50e-03 | 87 |
| GO:00066946 | Esophagus | ESCC | steroid biosynthetic process | 98/8552 | 173/18723 | 2.34e-03 | 1.03e-02 | 98 |
| GO:00082034 | Esophagus | ESCC | cholesterol metabolic process | 79/8552 | 137/18723 | 3.11e-03 | 1.29e-02 | 79 |
| GO:00161254 | Esophagus | ESCC | sterol metabolic process | 86/8552 | 152/18723 | 4.37e-03 | 1.73e-02 | 86 |
| GO:19016174 | Esophagus | ESCC | organic hydroxy compound biosynthetic process | 128/8552 | 237/18723 | 5.86e-03 | 2.16e-02 | 128 |
| GO:000820211 | Liver | Cirrhotic | steroid metabolic process | 143/4634 | 319/18723 | 2.79e-15 | 3.18e-13 | 143 |
| GO:19026521 | Liver | Cirrhotic | secondary alcohol metabolic process | 75/4634 | 147/18723 | 5.62e-12 | 3.91e-10 | 75 |
| GO:00082031 | Liver | Cirrhotic | cholesterol metabolic process | 70/4634 | 137/18723 | 2.59e-11 | 1.55e-09 | 70 |
| GO:00161251 | Liver | Cirrhotic | sterol metabolic process | 75/4634 | 152/18723 | 4.54e-11 | 2.61e-09 | 75 |
| GO:000606612 | Liver | Cirrhotic | alcohol metabolic process | 141/4634 | 353/18723 | 1.57e-10 | 8.03e-09 | 141 |
| Page: 1 2 3 |
| Pathway ID | Tissue | Disease Stage | Description | Gene Ratio | Bg Ratio | pvalue | p.adjust | qvalue | Count |
| hsa001005 | Esophagus | ESCC | Steroid biosynthesis | 18/4205 | 20/8465 | 1.78e-04 | 6.79e-04 | 3.48e-04 | 18 |
| hsa0010012 | Esophagus | ESCC | Steroid biosynthesis | 18/4205 | 20/8465 | 1.78e-04 | 6.79e-04 | 3.48e-04 | 18 |
| hsa001002 | Liver | HCC | Steroid biosynthesis | 15/4020 | 20/8465 | 1.17e-02 | 2.97e-02 | 1.65e-02 | 15 |
| hsa001003 | Liver | HCC | Steroid biosynthesis | 15/4020 | 20/8465 | 1.17e-02 | 2.97e-02 | 1.65e-02 | 15 |
| hsa001004 | Oral cavity | OSCC | Steroid biosynthesis | 15/3704 | 20/8465 | 4.62e-03 | 1.13e-02 | 5.75e-03 | 15 |
| hsa0010011 | Oral cavity | OSCC | Steroid biosynthesis | 15/3704 | 20/8465 | 4.62e-03 | 1.13e-02 | 5.75e-03 | 15 |
| Page: 1 |
Top |
Cell-cell communication analysis |
| Identification of potential cell-cell interactions between two cell types and their ligand-receptor pairs for different disease states |
| Ligand | Receptor | LRpair | Pathway | Tissue | Disease Stage |
| Page: 1 |
Top |
Single-cell gene regulatory network inference analysis |
| Find out the significant the regulons (TFs) and the target genes of each regulon across cell types for different disease states |
| TF | Cell Type | Tissue | Disease Stage | Target Gene | RSS | Regulon Activity |
| ∗The dot plots of a searched regulon are shown for all cell subpopulations in each disease state of each tissue based on the regulon specific score inferred using pySCENIC and by calculating the average expression. |
| Page: 1 |
Top |
Somatic mutation of malignant transformation related genes |
| Annotation of somatic variants for genes involved in malignant transformation |
| Hugo Symbol | Variant Class | Variant Classification | dbSNP RS | HGVSc | HGVSp | HGVSp Short | SWISSPROT | BIOTYPE | SIFT | PolyPhen | Tumor Sample Barcode | Tissue | Histology | Sex | Age | Stage | Therapy Types | Drugs | Outcome |
| SQLE | SNV | Missense_Mutation | c.397N>A | p.Val133Met | p.V133M | Q14534 | protein_coding | deleterious(0) | probably_damaging(0.933) | TCGA-AN-A046-01 | Breast | breast invasive carcinoma | Female | >=65 | I/II | Unknown | Unknown | SD | |
| SQLE | SNV | Missense_Mutation | c.174N>C | p.Gln58His | p.Q58H | Q14534 | protein_coding | tolerated_low_confidence(0.49) | benign(0) | TCGA-FU-A3YQ-01 | Cervix | cervical & endocervical cancer | Female | <65 | I/II | Unknown | Unknown | SD | |
| SQLE | SNV | Missense_Mutation | c.559C>A | p.Leu187Ile | p.L187I | Q14534 | protein_coding | tolerated(0.86) | benign(0.015) | TCGA-Q1-A73O-01 | Cervix | cervical & endocervical cancer | Female | <65 | I/II | Chemotherapy | cisplatin | CR | |
| SQLE | SNV | Missense_Mutation | novel | c.955N>T | p.Ala319Ser | p.A319S | Q14534 | protein_coding | tolerated(0.35) | possibly_damaging(0.446) | TCGA-VS-A9UJ-01 | Cervix | cervical & endocervical cancer | Female | <65 | I/II | Unknown | Unknown | PD |
| SQLE | SNV | Missense_Mutation | novel | c.459G>C | p.Glu153Asp | p.E153D | Q14534 | protein_coding | deleterious(0) | probably_damaging(0.958) | TCGA-5M-AAT4-01 | Colorectum | colon adenocarcinoma | Male | >=65 | III/IV | Unknown | Unknown | PD |
| SQLE | SNV | Missense_Mutation | c.179G>A | p.Gly60Asp | p.G60D | Q14534 | protein_coding | tolerated_low_confidence(0.56) | benign(0.01) | TCGA-A6-2686-01 | Colorectum | colon adenocarcinoma | Female | >=65 | I/II | Unknown | Unknown | SD | |
| SQLE | SNV | Missense_Mutation | c.1562N>A | p.Gly521Glu | p.G521E | Q14534 | protein_coding | deleterious(0.03) | probably_damaging(0.965) | TCGA-AA-3977-01 | Colorectum | colon adenocarcinoma | Male | >=65 | I/II | Unknown | Unknown | SD | |
| SQLE | SNV | Missense_Mutation | novel | c.798G>T | p.Lys266Asn | p.K266N | Q14534 | protein_coding | deleterious(0.03) | benign(0.249) | TCGA-AA-A010-01 | Colorectum | colon adenocarcinoma | Female | <65 | I/II | Chemotherapy | folinic | CR |
| SQLE | SNV | Missense_Mutation | c.736N>G | p.Ile246Val | p.I246V | Q14534 | protein_coding | tolerated(0.19) | benign(0.003) | TCGA-AG-A002-01 | Colorectum | rectum adenocarcinoma | Male | <65 | I/II | Unknown | Unknown | SD | |
| SQLE | SNV | Missense_Mutation | c.778N>A | p.Val260Met | p.V260M | Q14534 | protein_coding | deleterious(0) | possibly_damaging(0.59) | TCGA-EI-6507-01 | Colorectum | rectum adenocarcinoma | Male | <65 | I/II | Unknown | Unknown | SD |
| Page: 1 2 3 4 5 |
Top |
Related drugs of malignant transformation related genes |
| Identification of chemicals and drugs interact with genes involved in malignant transfromation |
| (DGIdb 4.0) |
| Entrez ID | Symbol | Category | Interaction Types | Drug Claim Name | Drug Name | PMIDs |
| 6713 | SQLE | DRUGGABLE GENOME, ENZYME | inhibitor | 252827452 | ||
| 6713 | SQLE | DRUGGABLE GENOME, ENZYME | Tolnaftate | TOLNAFTATE | ||
| 6713 | SQLE | DRUGGABLE GENOME, ENZYME | AMIODARONE | AMIODARONE | 16451055 | |
| 6713 | SQLE | DRUGGABLE GENOME, ENZYME | Naftifine | NAFTIFINE | ||
| 6713 | SQLE | DRUGGABLE GENOME, ENZYME | Epigallocatechin gallate |
| Page: 1 |

Copyright 2023-Present -The University of Texas Health Science Center at Houston |