
|
|||||
|
 | |
| |
| |
| |
| |
| |
|
Gene: SPTSSB |
Gene summary for SPTSSB |
| Gene information | Species | Human | Gene symbol | SPTSSB | Gene ID | 165679 |
| Gene name | serine palmitoyltransferase small subunit B | |
| Gene Alias | ADMP | |
| Cytomap | 3q26.1 | |
| Gene Type | protein-coding | GO ID | GO:0006629 | UniProtAcc | Q6ZWB5 |
Top |
Malignant transformation analysis |
| Identification of the aberrant gene expression in precancerous and cancerous lesions by comparing the gene expression of stem-like cells in diseased tissues with normal stem cells |
| Entrez ID | Symbol | Replicates | Species | Organ | Tissue | Adj P-value | Log2FC | Malignancy |
| 165679 | SPTSSB | P8T-E | Human | Esophagus | ESCC | 1.73e-22 | 4.99e-01 | 0.0889 |
| 165679 | SPTSSB | P16T-E | Human | Esophagus | ESCC | 3.69e-92 | 2.76e+00 | 0.1153 |
| 165679 | SPTSSB | P28T-E | Human | Esophagus | ESCC | 1.71e-03 | 1.66e-01 | 0.1149 |
| 165679 | SPTSSB | P54T-E | Human | Esophagus | ESCC | 7.80e-03 | 3.22e-01 | 0.0975 |
| 165679 | SPTSSB | P61T-E | Human | Esophagus | ESCC | 1.68e-04 | 1.90e-01 | 0.099 |
| 165679 | SPTSSB | P65T-E | Human | Esophagus | ESCC | 3.85e-09 | 2.83e-01 | 0.0978 |
| 165679 | SPTSSB | P74T-E | Human | Esophagus | ESCC | 1.42e-18 | 1.06e+00 | 0.1479 |
| 165679 | SPTSSB | P75T-E | Human | Esophagus | ESCC | 1.90e-38 | 1.24e+00 | 0.1125 |
| 165679 | SPTSSB | P76T-E | Human | Esophagus | ESCC | 1.30e-19 | 1.08e+00 | 0.1207 |
| 165679 | SPTSSB | P94T-E | Human | Esophagus | ESCC | 1.98e-03 | 6.27e-01 | 0.0879 |
| 165679 | SPTSSB | P104T-E | Human | Esophagus | ESCC | 1.21e-04 | 3.09e-01 | 0.0931 |
| 165679 | SPTSSB | P127T-E | Human | Esophagus | ESCC | 2.10e-04 | 3.71e-01 | 0.0826 |
| 165679 | SPTSSB | P128T-E | Human | Esophagus | ESCC | 2.52e-67 | 4.22e+00 | 0.1241 |
| 165679 | SPTSSB | HCC1_Meng | Human | Liver | HCC | 8.11e-22 | 5.30e-02 | 0.0246 |
| 165679 | SPTSSB | HCC2_Meng | Human | Liver | HCC | 5.91e-47 | 5.13e-01 | 0.0107 |
| 165679 | SPTSSB | S027 | Human | Liver | HCC | 3.96e-04 | 3.89e-01 | 0.2446 |
| 165679 | SPTSSB | S028 | Human | Liver | HCC | 3.35e-09 | 7.46e-01 | 0.2503 |
| 165679 | SPTSSB | S029 | Human | Liver | HCC | 1.09e-19 | 1.30e+00 | 0.2581 |
| Page: 1 |
| Tissue | Expression Dynamics | Abbreviation |
| Esophagus |  | ESCC: Esophageal squamous cell carcinoma |
| HGIN: High-grade intraepithelial neoplasias | ||
| LGIN: Low-grade intraepithelial neoplasias | ||
| Liver | 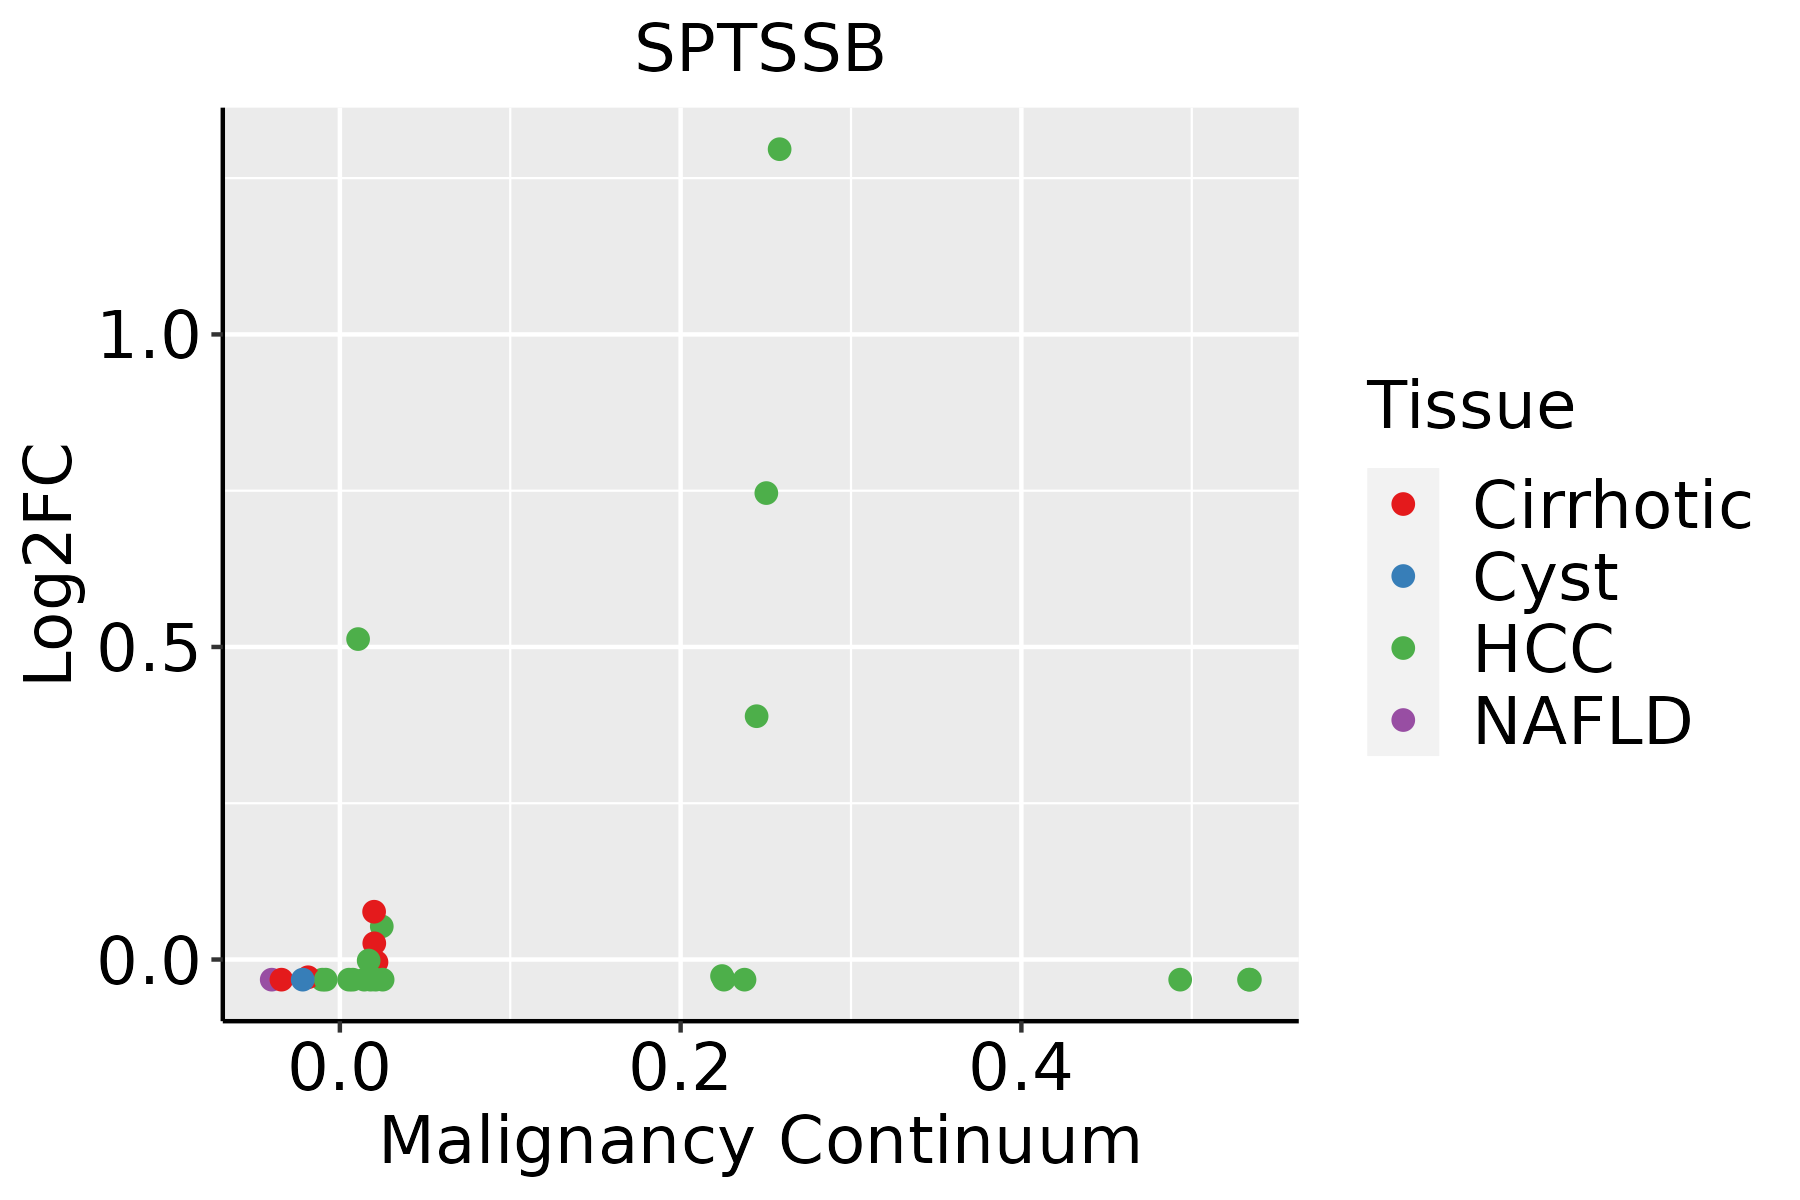 | HCC: Hepatocellular carcinoma |
| NAFLD: Non-alcoholic fatty liver disease |
| ∗log2FC in expression of this searched gene in stem-like cells from each diseased tissue sample relative to stem-like cells in normal samples in each tissue plotted against the malignancy continuum. Samples are colored based on if they are from different disease stage. |
Top |
Malignant transformation related pathway analysis |
| Find out the enriched GO biological processes and KEGG pathways involved in transition from healthy to precancer to cancer |
| Tissue | Disease Stage | Enriched GO biological Processes |
| Colorectum | AD |  |
| Colorectum | SER |  |
| Colorectum | MSS |  |
| Colorectum | MSI-H |  |
| Colorectum | FAP |  |
| ∗Top 15 enriched GO BP terms are showed in the bar plot of each disease state in each tissue. Each row represents a significant GO biological process which is colored according to the -log10(p.adjust). |
| Page: 1 2 3 4 5 6 7 8 9 |
| GO ID | Tissue | Disease Stage | Description | Gene Ratio | Bg Ratio | pvalue | p.adjust | Count |
| GO:000702914 | Esophagus | ESCC | endoplasmic reticulum organization | 65/8552 | 87/18723 | 3.28e-08 | 6.08e-07 | 65 |
| GO:00066433 | Esophagus | ESCC | membrane lipid metabolic process | 130/8552 | 203/18723 | 9.29e-08 | 1.54e-06 | 130 |
| GO:00464673 | Esophagus | ESCC | membrane lipid biosynthetic process | 91/8552 | 142/18723 | 7.19e-06 | 7.19e-05 | 91 |
| GO:00066652 | Esophagus | ESCC | sphingolipid metabolic process | 96/8552 | 155/18723 | 3.21e-05 | 2.66e-04 | 96 |
| GO:00301481 | Esophagus | ESCC | sphingolipid biosynthetic process | 62/8552 | 103/18723 | 2.10e-03 | 9.38e-03 | 62 |
| GO:00066721 | Esophagus | ESCC | ceramide metabolic process | 61/8552 | 102/18723 | 2.82e-03 | 1.19e-02 | 61 |
| GO:0046513 | Esophagus | ESCC | ceramide biosynthetic process | 40/8552 | 65/18723 | 7.25e-03 | 2.63e-02 | 40 |
| GO:000702911 | Liver | HCC | endoplasmic reticulum organization | 64/7958 | 87/18723 | 3.92e-09 | 1.04e-07 | 64 |
| GO:00066431 | Liver | HCC | membrane lipid metabolic process | 115/7958 | 203/18723 | 3.17e-05 | 3.22e-04 | 115 |
| GO:0006665 | Liver | HCC | sphingolipid metabolic process | 85/7958 | 155/18723 | 1.27e-03 | 6.92e-03 | 85 |
| GO:0046467 | Liver | HCC | membrane lipid biosynthetic process | 78/7958 | 142/18723 | 1.85e-03 | 9.46e-03 | 78 |
| Page: 1 |
| Pathway ID | Tissue | Disease Stage | Description | Gene Ratio | Bg Ratio | pvalue | p.adjust | qvalue | Count |
| hsa040718 | Liver | HCC | Sphingolipid signaling pathway | 72/4020 | 121/8465 | 5.01e-03 | 1.47e-02 | 8.18e-03 | 72 |
| hsa0407111 | Liver | HCC | Sphingolipid signaling pathway | 72/4020 | 121/8465 | 5.01e-03 | 1.47e-02 | 8.18e-03 | 72 |
| Page: 1 |
Top |
Cell-cell communication analysis |
| Identification of potential cell-cell interactions between two cell types and their ligand-receptor pairs for different disease states |
| Ligand | Receptor | LRpair | Pathway | Tissue | Disease Stage |
| Page: 1 |
Top |
Single-cell gene regulatory network inference analysis |
| Find out the significant the regulons (TFs) and the target genes of each regulon across cell types for different disease states |
| TF | Cell Type | Tissue | Disease Stage | Target Gene | RSS | Regulon Activity |
| ∗The dot plots of a searched regulon are shown for all cell subpopulations in each disease state of each tissue based on the regulon specific score inferred using pySCENIC and by calculating the average expression. |
| Page: 1 |
Top |
Somatic mutation of malignant transformation related genes |
| Annotation of somatic variants for genes involved in malignant transformation |
| Hugo Symbol | Variant Class | Variant Classification | dbSNP RS | HGVSc | HGVSp | HGVSp Short | SWISSPROT | BIOTYPE | SIFT | PolyPhen | Tumor Sample Barcode | Tissue | Histology | Sex | Age | Stage | Therapy Types | Drugs | Outcome |
| SPTSSB | SNV | Missense_Mutation | novel | c.132N>A | p.Met44Ile | p.M44I | Q8NFR3 | protein_coding | deleterious(0.01) | probably_damaging(0.992) | TCGA-CA-6717-01 | Colorectum | colon adenocarcinoma | Male | <65 | I/II | Chemotherapy | oxaliplatin | CR |
| SPTSSB | SNV | Missense_Mutation | c.194N>T | p.Ser65Leu | p.S65L | Q8NFR3 | protein_coding | tolerated(0.7) | benign(0.401) | TCGA-D5-6930-01 | Colorectum | colon adenocarcinoma | Male | >=65 | I/II | Unknown | Unknown | SD | |
| SPTSSB | SNV | Missense_Mutation | novel | c.224N>A | p.Ser75Tyr | p.S75Y | Q8NFR3 | protein_coding | deleterious(0.05) | benign(0.172) | TCGA-F5-6814-01 | Colorectum | rectum adenocarcinoma | Male | <65 | I/II | Unknown | Unknown | SD |
| SPTSSB | SNV | Missense_Mutation | c.172C>T | p.Arg58Cys | p.R58C | Q8NFR3 | protein_coding | deleterious(0.05) | probably_damaging(0.989) | TCGA-A5-A0GP-01 | Endometrium | uterine corpus endometrioid carcinoma | Female | <65 | I/II | Unknown | Unknown | SD | |
| SPTSSB | SNV | Missense_Mutation | c.172N>T | p.Arg58Cys | p.R58C | Q8NFR3 | protein_coding | deleterious(0.05) | probably_damaging(0.989) | TCGA-AJ-A5DW-01 | Endometrium | uterine corpus endometrioid carcinoma | Female | <65 | I/II | Unknown | Unknown | SD | |
| SPTSSB | SNV | Missense_Mutation | rs777850686 | c.173N>A | p.Arg58His | p.R58H | Q8NFR3 | protein_coding | tolerated(0.16) | probably_damaging(0.971) | TCGA-AP-A1DV-01 | Endometrium | uterine corpus endometrioid carcinoma | Female | <65 | I/II | Unknown | Unknown | SD |
| SPTSSB | SNV | Missense_Mutation | c.172N>T | p.Arg58Cys | p.R58C | Q8NFR3 | protein_coding | deleterious(0.05) | probably_damaging(0.989) | TCGA-B5-A11N-01 | Endometrium | uterine corpus endometrioid carcinoma | Female | >=65 | I/II | Unknown | Unknown | SD | |
| SPTSSB | SNV | Missense_Mutation | novel | c.224C>A | p.Ser75Tyr | p.S75Y | Q8NFR3 | protein_coding | deleterious(0.05) | benign(0.172) | TCGA-E6-A1LX-01 | Endometrium | uterine corpus endometrioid carcinoma | Female | <65 | I/II | Unknown | Unknown | SD |
| SPTSSB | SNV | Missense_Mutation | novel | c.65G>T | p.Cys22Phe | p.C22F | Q8NFR3 | protein_coding | deleterious(0) | probably_damaging(0.948) | TCGA-73-A9RS-01 | Lung | lung adenocarcinoma | Male | <65 | I/II | Chemotherapy | carboplatin | PD |
| SPTSSB | SNV | Missense_Mutation | c.13N>G | p.Arg5Gly | p.R5G | Q8NFR3 | protein_coding | tolerated(0.55) | benign(0.005) | TCGA-CN-A63U-01 | Oral cavity | head & neck squamous cell carcinoma | Male | <65 | I/II | Unknown | Unknown | SD |
| Page: 1 2 |
Top |
Related drugs of malignant transformation related genes |
| Identification of chemicals and drugs interact with genes involved in malignant transfromation |
| (DGIdb 4.0) |
| Entrez ID | Symbol | Category | Interaction Types | Drug Claim Name | Drug Name | PMIDs |
| Page: 1 |

Copyright 2023-Present -The University of Texas Health Science Center at Houston |