
|
|||||
|
 | |
| |
| |
| |
| |
| |
|
Gene: SPTSSA |
Gene summary for SPTSSA |
| Gene information | Species | Human | Gene symbol | SPTSSA | Gene ID | 171546 |
| Gene name | serine palmitoyltransferase small subunit A | |
| Gene Alias | C14orf147 | |
| Cytomap | 14q13.1 | |
| Gene Type | protein-coding | GO ID | GO:0006629 | UniProtAcc | Q969W0 |
Top |
Malignant transformation analysis |
| Identification of the aberrant gene expression in precancerous and cancerous lesions by comparing the gene expression of stem-like cells in diseased tissues with normal stem cells |
| Entrez ID | Symbol | Replicates | Species | Organ | Tissue | Adj P-value | Log2FC | Malignancy |
| 171546 | SPTSSA | GSM4909281 | Human | Breast | IDC | 2.71e-02 | 2.46e-01 | 0.21 |
| 171546 | SPTSSA | GSM4909282 | Human | Breast | IDC | 8.93e-03 | 1.92e-01 | -0.0288 |
| 171546 | SPTSSA | GSM4909285 | Human | Breast | IDC | 1.67e-04 | -1.40e-01 | 0.21 |
| 171546 | SPTSSA | GSM4909286 | Human | Breast | IDC | 6.08e-14 | -4.07e-01 | 0.1081 |
| 171546 | SPTSSA | GSM4909287 | Human | Breast | IDC | 1.32e-04 | -4.33e-01 | 0.2057 |
| 171546 | SPTSSA | GSM4909290 | Human | Breast | IDC | 1.56e-09 | 4.46e-01 | 0.2096 |
| 171546 | SPTSSA | GSM4909293 | Human | Breast | IDC | 1.21e-05 | -2.79e-01 | 0.1581 |
| 171546 | SPTSSA | GSM4909296 | Human | Breast | IDC | 9.27e-07 | -3.33e-01 | 0.1524 |
| 171546 | SPTSSA | GSM4909297 | Human | Breast | IDC | 2.18e-09 | -2.51e-01 | 0.1517 |
| 171546 | SPTSSA | GSM4909298 | Human | Breast | IDC | 1.63e-05 | -2.18e-01 | 0.1551 |
| 171546 | SPTSSA | GSM4909301 | Human | Breast | IDC | 1.46e-26 | -6.79e-01 | 0.1577 |
| 171546 | SPTSSA | GSM4909304 | Human | Breast | IDC | 3.62e-02 | -2.50e-01 | 0.1636 |
| 171546 | SPTSSA | GSM4909308 | Human | Breast | IDC | 1.41e-08 | 2.79e-01 | 0.158 |
| 171546 | SPTSSA | GSM4909311 | Human | Breast | IDC | 1.05e-31 | -6.55e-01 | 0.1534 |
| 171546 | SPTSSA | GSM4909312 | Human | Breast | IDC | 5.23e-21 | -5.22e-01 | 0.1552 |
| 171546 | SPTSSA | GSM4909318 | Human | Breast | IDC | 3.41e-03 | -6.43e-01 | 0.2031 |
| 171546 | SPTSSA | GSM4909319 | Human | Breast | IDC | 4.06e-29 | -5.18e-01 | 0.1563 |
| 171546 | SPTSSA | GSM4909320 | Human | Breast | IDC | 6.19e-11 | -6.78e-01 | 0.1575 |
| 171546 | SPTSSA | GSM4909321 | Human | Breast | IDC | 8.25e-11 | -3.50e-01 | 0.1559 |
| 171546 | SPTSSA | brca2 | Human | Breast | Precancer | 1.96e-10 | 4.27e-01 | -0.024 |
| Page: 1 2 3 4 5 6 7 8 9 |
| Tissue | Expression Dynamics | Abbreviation |
| Breast | 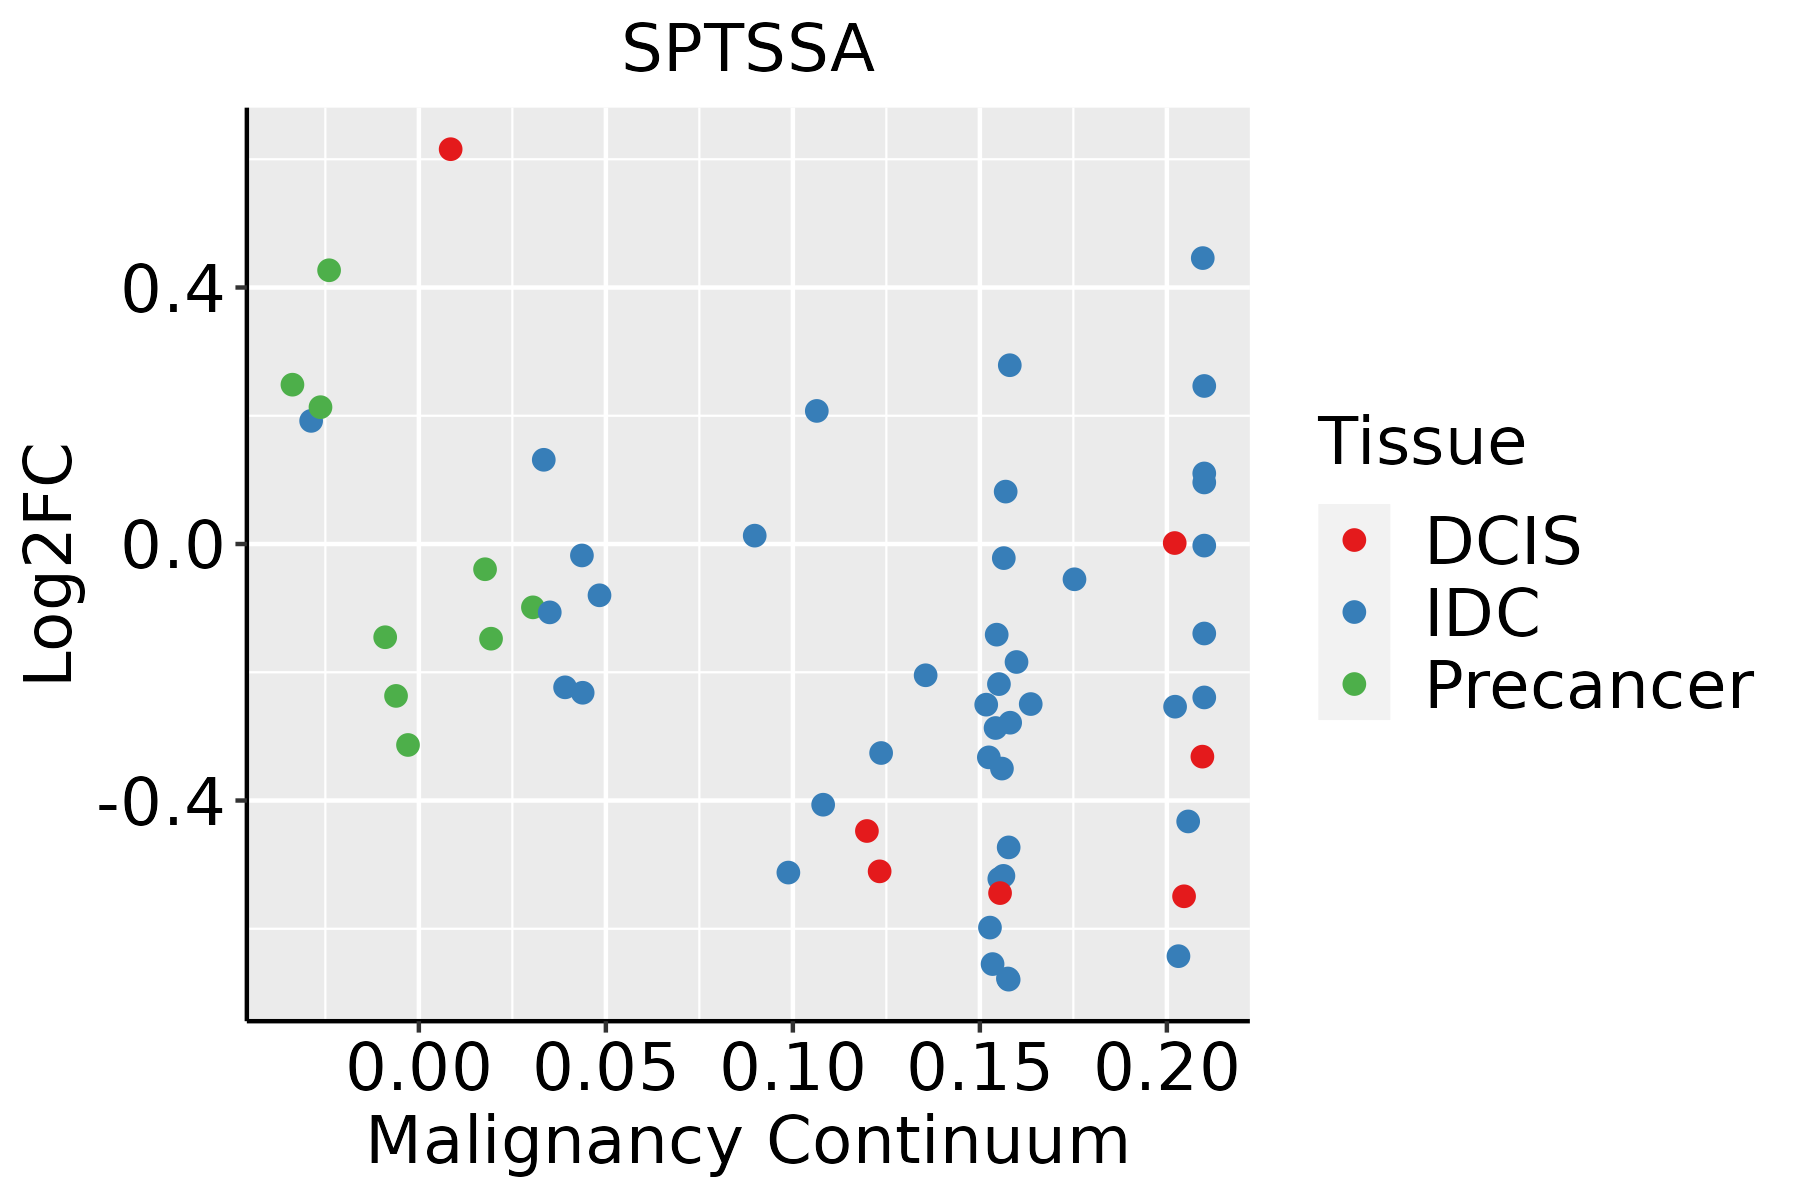 | IDC: Invasive ductal carcinoma |
| DCIS: Ductal carcinoma in situ | ||
| Precancer(BRCA1-mut): Precancerous lesion from BRCA1 mutation carriers | ||
| Colorectum (GSE201348) |  | FAP: Familial adenomatous polyposis |
| CRC: Colorectal cancer | ||
| Colorectum (HTA11) |  | AD: Adenomas |
| SER: Sessile serrated lesions | ||
| MSI-H: Microsatellite-high colorectal cancer | ||
| MSS: Microsatellite stable colorectal cancer | ||
| Esophagus | 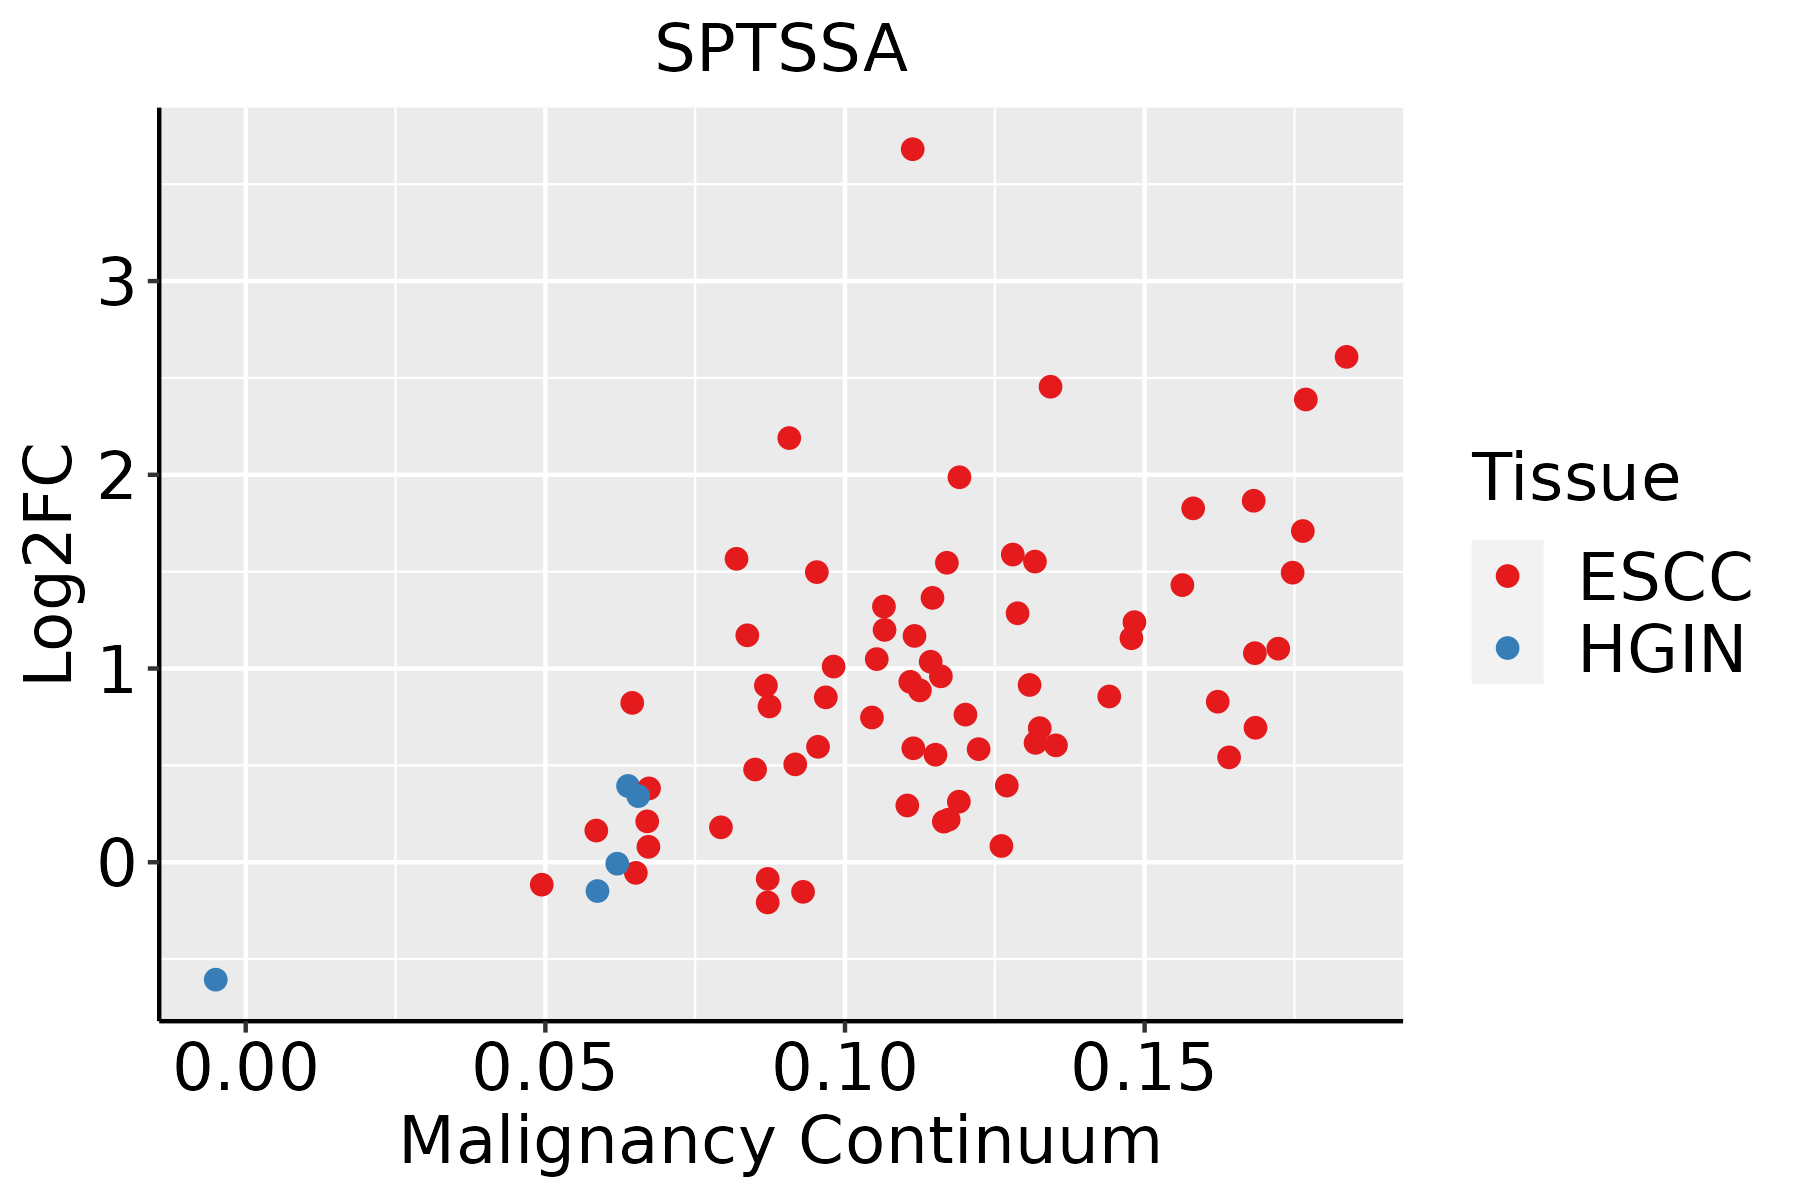 | ESCC: Esophageal squamous cell carcinoma |
| HGIN: High-grade intraepithelial neoplasias | ||
| LGIN: Low-grade intraepithelial neoplasias | ||
| Liver |  | HCC: Hepatocellular carcinoma |
| NAFLD: Non-alcoholic fatty liver disease | ||
| Oral Cavity | 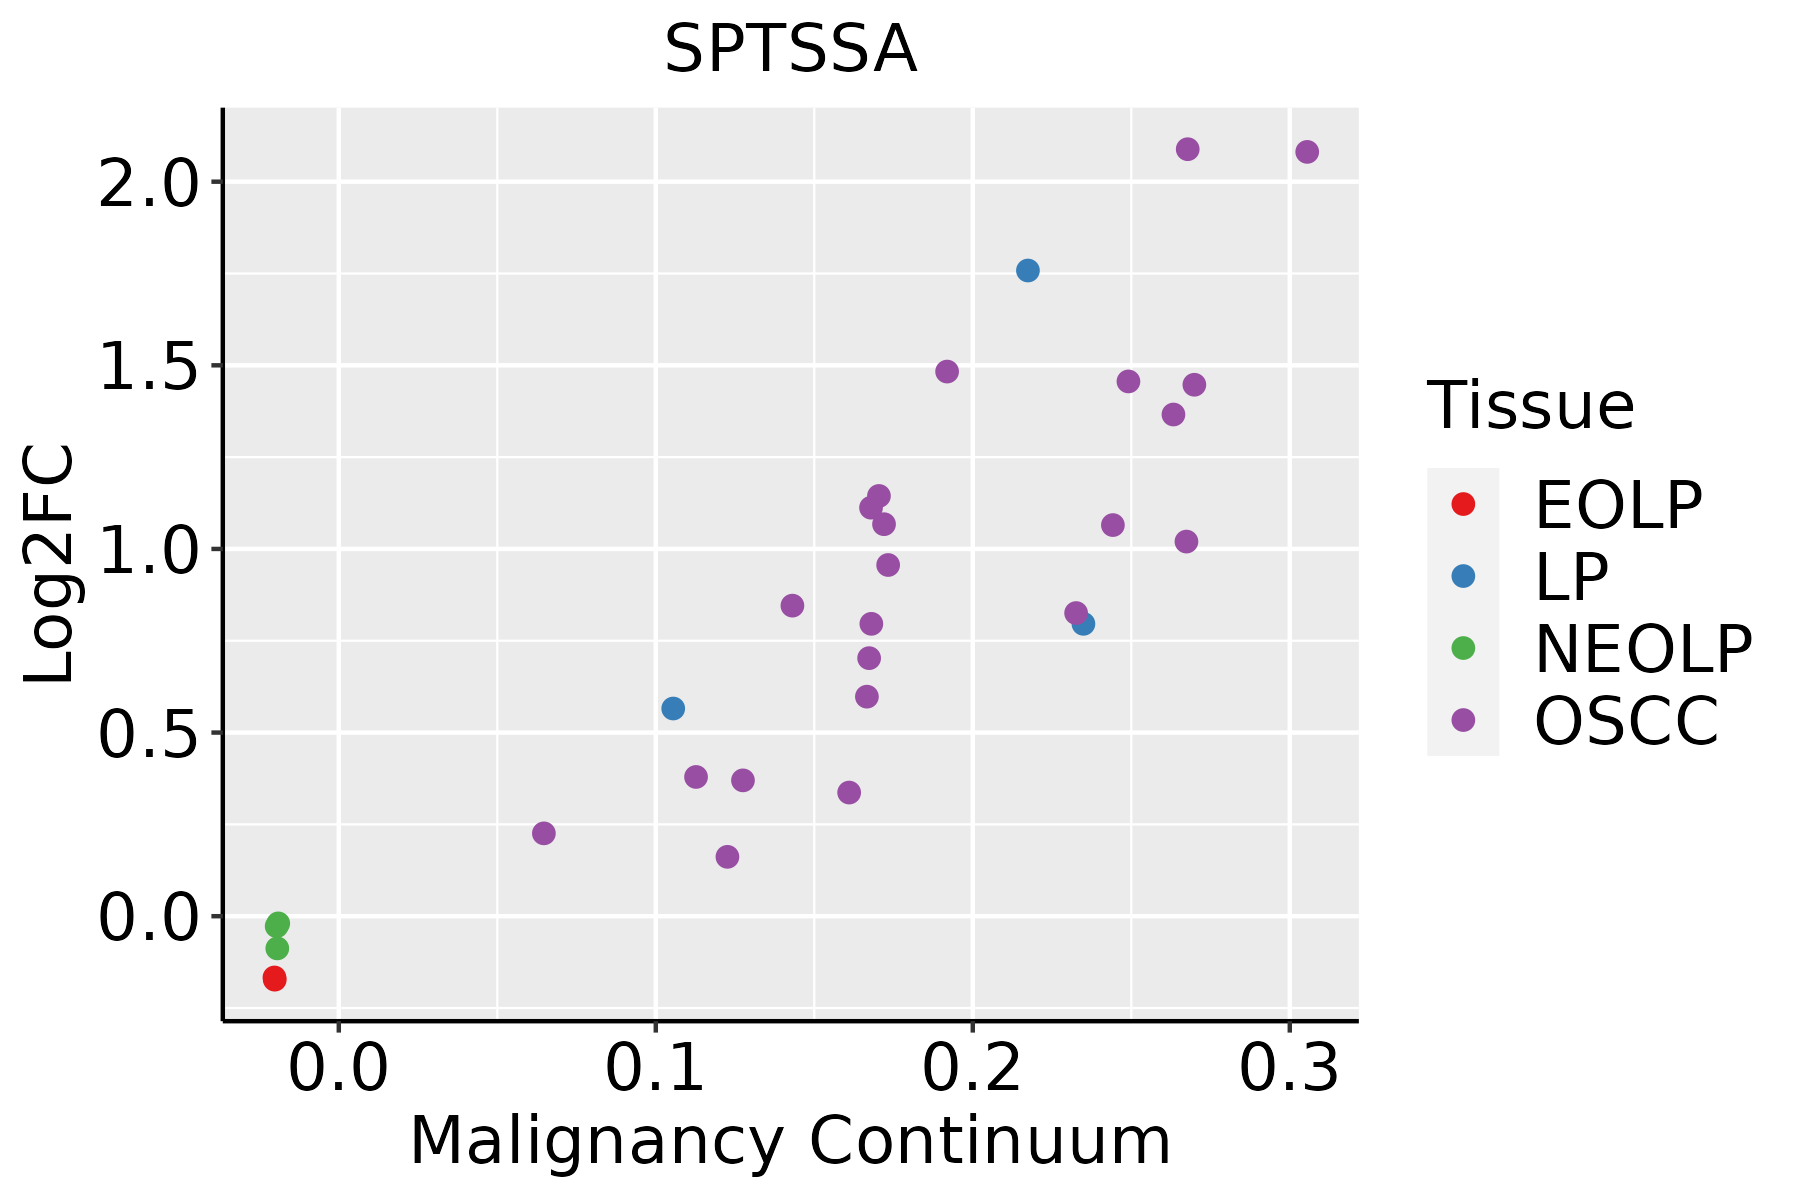 | EOLP: Erosive Oral lichen planus |
| LP: leukoplakia | ||
| NEOLP: Non-erosive oral lichen planus | ||
| OSCC: Oral squamous cell carcinoma | ||
| Skin | 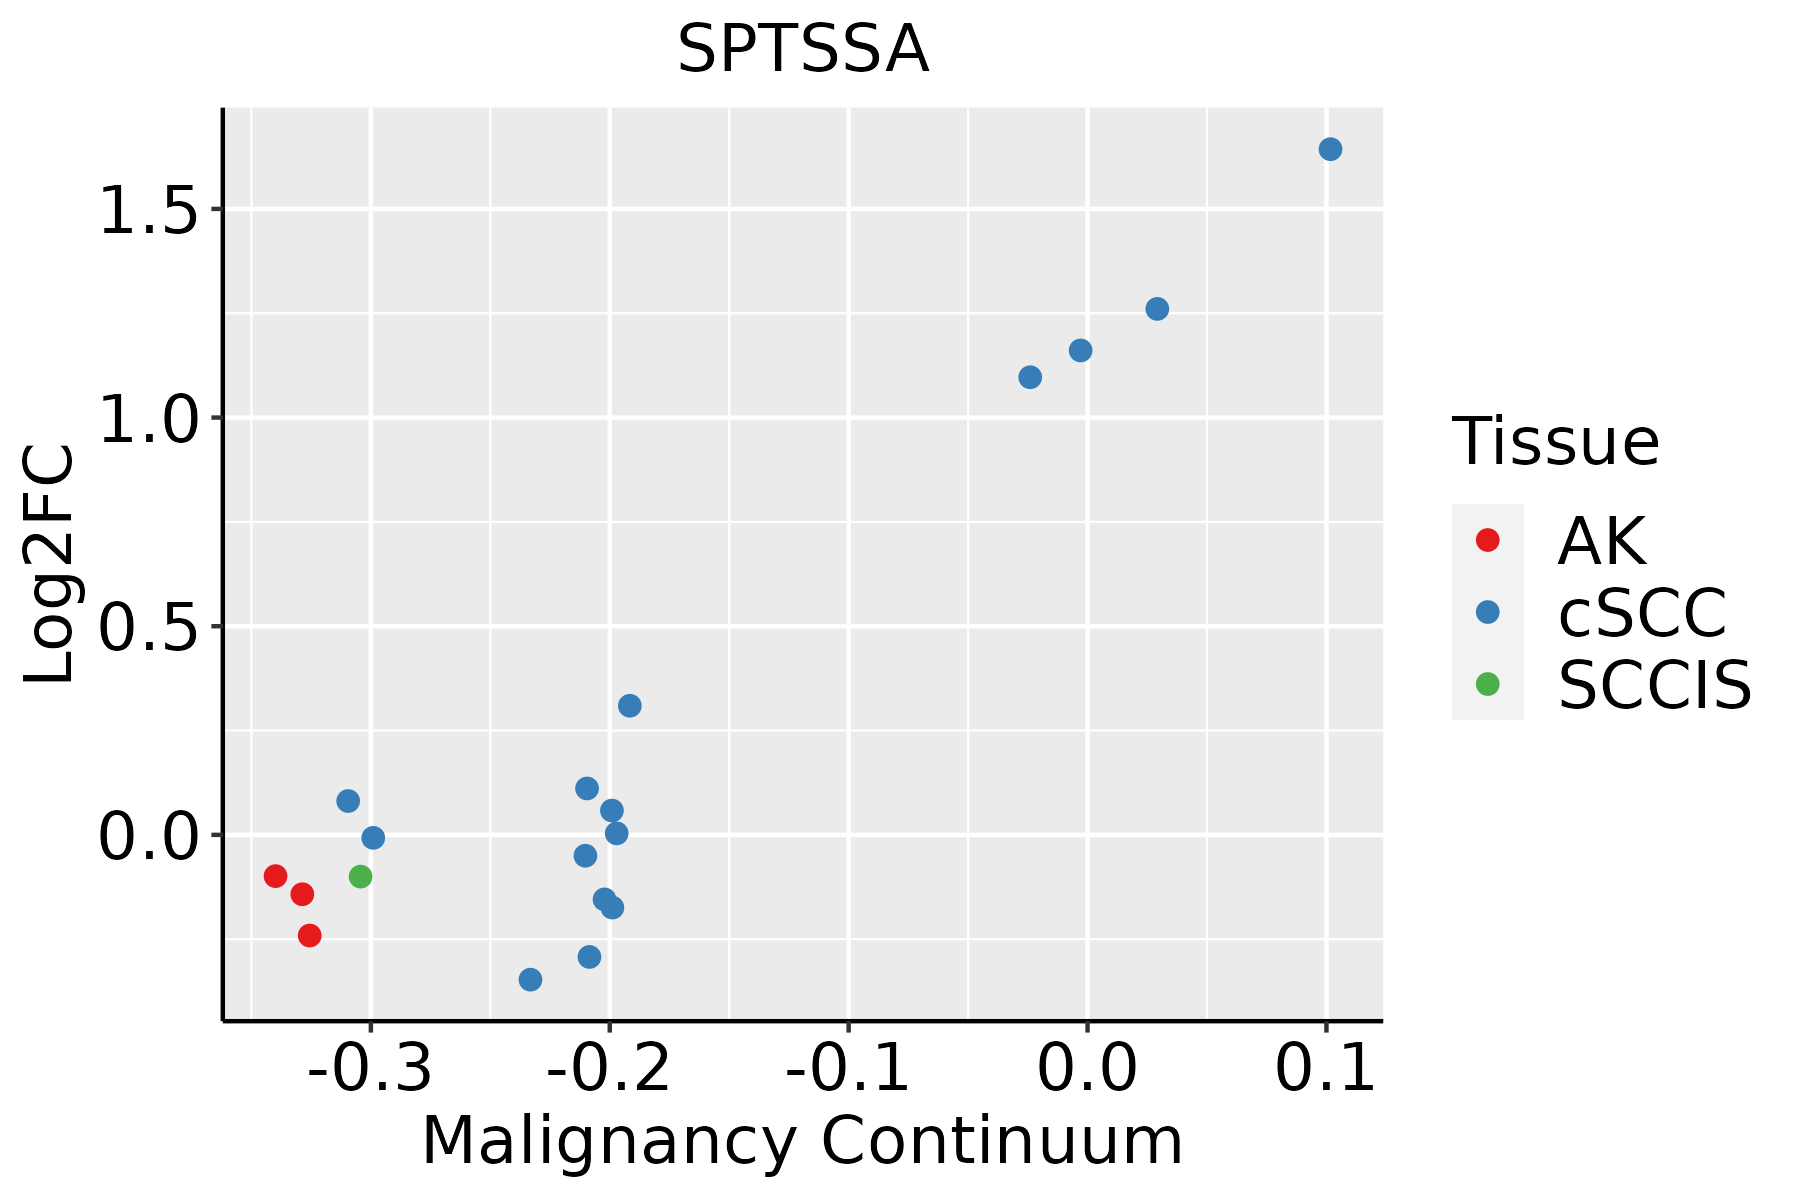 | AK: Actinic keratosis |
| cSCC: Cutaneous squamous cell carcinoma | ||
| SCCIS:squamous cell carcinoma in situ | ||
| Thyroid | 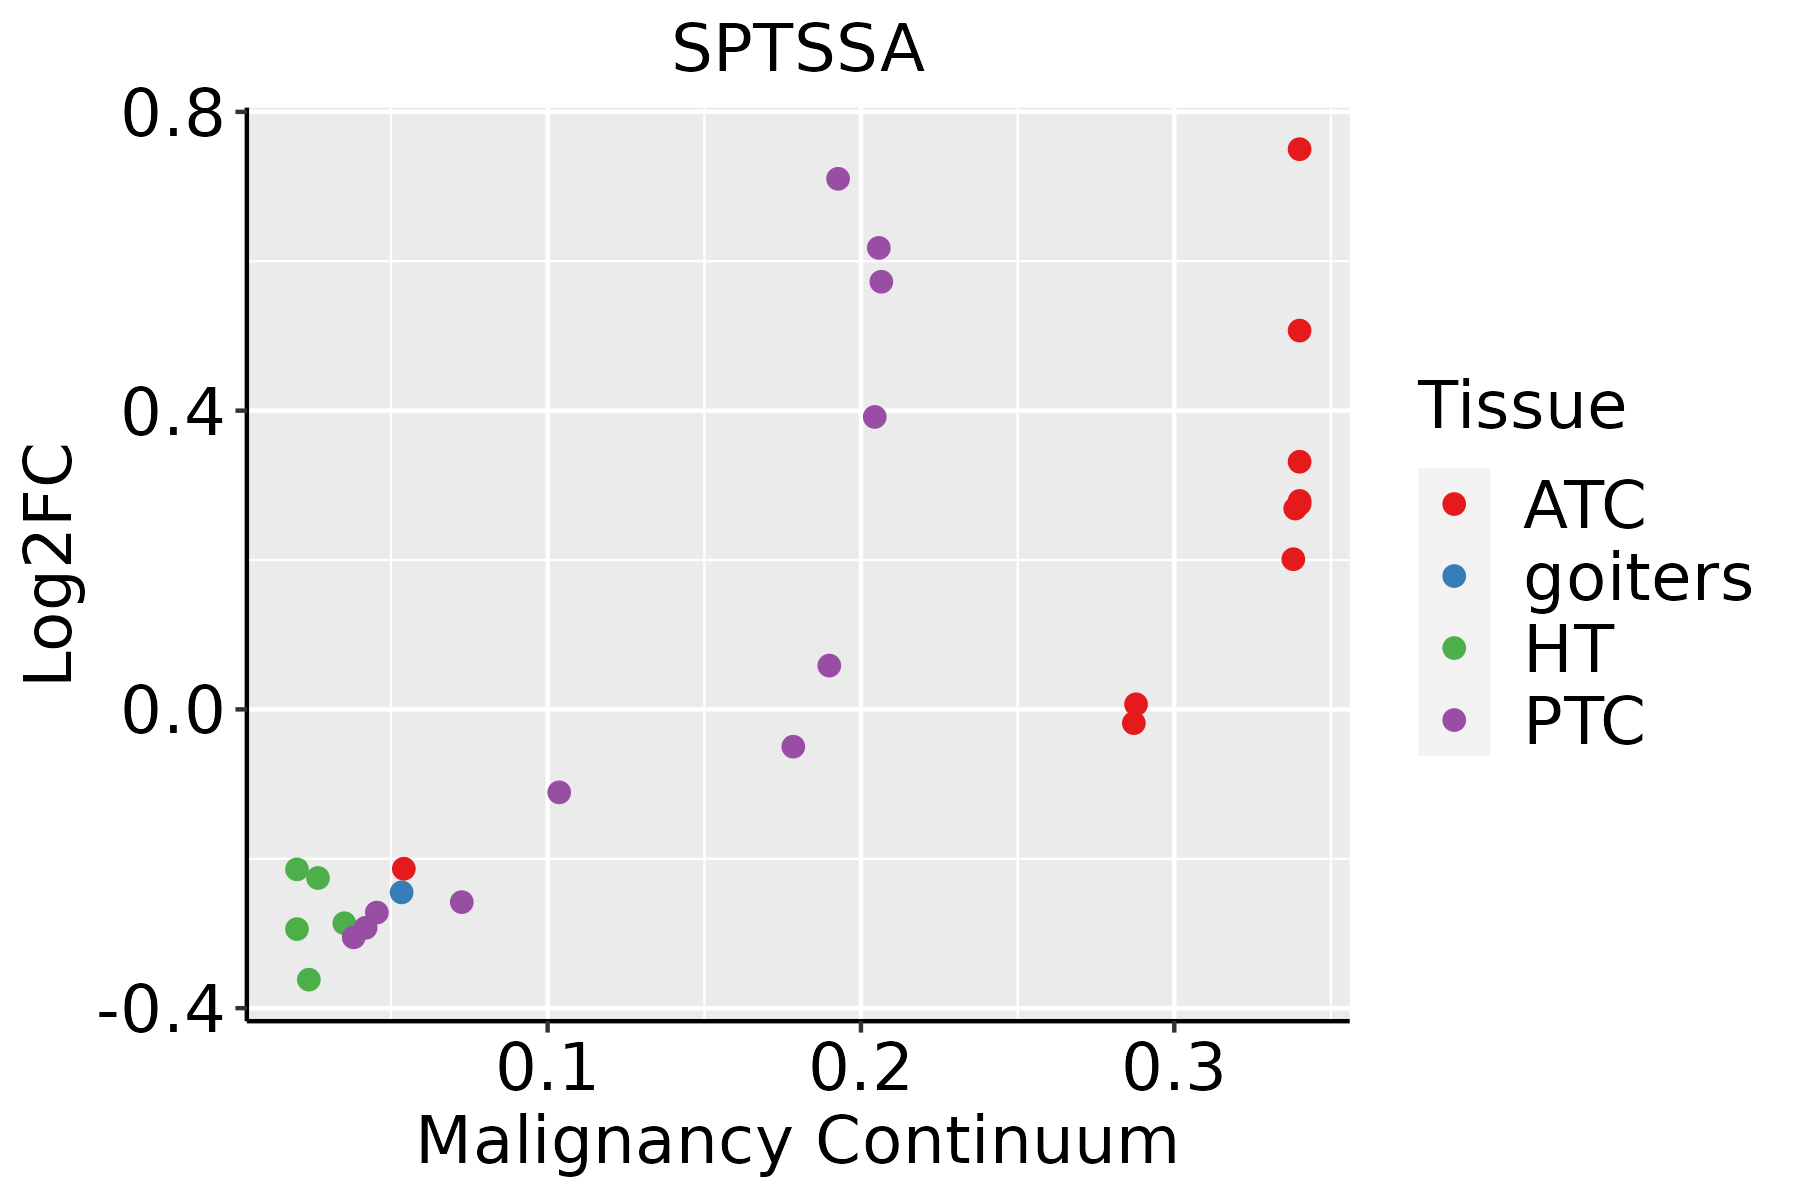 | ATC: Anaplastic thyroid cancer |
| HT: Hashimoto's thyroiditis | ||
| PTC: Papillary thyroid cancer |
| ∗log2FC in expression of this searched gene in stem-like cells from each diseased tissue sample relative to stem-like cells in normal samples in each tissue plotted against the malignancy continuum. Samples are colored based on if they are from different disease stage. |
Top |
Malignant transformation related pathway analysis |
| Find out the enriched GO biological processes and KEGG pathways involved in transition from healthy to precancer to cancer |
| Tissue | Disease Stage | Enriched GO biological Processes |
| Colorectum | AD |  |
| Colorectum | SER |  |
| Colorectum | MSS |  |
| Colorectum | MSI-H |  |
| Colorectum | FAP |  |
| ∗Top 15 enriched GO BP terms are showed in the bar plot of each disease state in each tissue. Each row represents a significant GO biological process which is colored according to the -log10(p.adjust). |
| Page: 1 2 3 4 5 6 7 8 9 |
| GO ID | Tissue | Disease Stage | Description | Gene Ratio | Bg Ratio | pvalue | p.adjust | Count |
| GO:00066433 | Esophagus | ESCC | membrane lipid metabolic process | 130/8552 | 203/18723 | 9.29e-08 | 1.54e-06 | 130 |
| GO:00464673 | Esophagus | ESCC | membrane lipid biosynthetic process | 91/8552 | 142/18723 | 7.19e-06 | 7.19e-05 | 91 |
| GO:00066652 | Esophagus | ESCC | sphingolipid metabolic process | 96/8552 | 155/18723 | 3.21e-05 | 2.66e-04 | 96 |
| GO:00301481 | Esophagus | ESCC | sphingolipid biosynthetic process | 62/8552 | 103/18723 | 2.10e-03 | 9.38e-03 | 62 |
| GO:00066721 | Esophagus | ESCC | ceramide metabolic process | 61/8552 | 102/18723 | 2.82e-03 | 1.19e-02 | 61 |
| GO:0046513 | Esophagus | ESCC | ceramide biosynthetic process | 40/8552 | 65/18723 | 7.25e-03 | 2.63e-02 | 40 |
| GO:0006643 | Liver | Cirrhotic | membrane lipid metabolic process | 69/4634 | 203/18723 | 1.89e-03 | 1.19e-02 | 69 |
| GO:00066431 | Liver | HCC | membrane lipid metabolic process | 115/7958 | 203/18723 | 3.17e-05 | 3.22e-04 | 115 |
| GO:0006665 | Liver | HCC | sphingolipid metabolic process | 85/7958 | 155/18723 | 1.27e-03 | 6.92e-03 | 85 |
| GO:0046467 | Liver | HCC | membrane lipid biosynthetic process | 78/7958 | 142/18723 | 1.85e-03 | 9.46e-03 | 78 |
| GO:00066432 | Oral cavity | OSCC | membrane lipid metabolic process | 111/7305 | 203/18723 | 4.02e-06 | 4.69e-05 | 111 |
| GO:00066651 | Oral cavity | OSCC | sphingolipid metabolic process | 84/7305 | 155/18723 | 8.64e-05 | 6.61e-04 | 84 |
| GO:00464672 | Oral cavity | OSCC | membrane lipid biosynthetic process | 77/7305 | 142/18723 | 1.63e-04 | 1.13e-03 | 77 |
| GO:0006672 | Oral cavity | OSCC | ceramide metabolic process | 53/7305 | 102/18723 | 5.28e-03 | 2.06e-02 | 53 |
| GO:0030148 | Oral cavity | OSCC | sphingolipid biosynthetic process | 53/7305 | 103/18723 | 6.81e-03 | 2.53e-02 | 53 |
| GO:000664311 | Oral cavity | LP | membrane lipid metabolic process | 69/4623 | 203/18723 | 1.77e-03 | 1.34e-02 | 69 |
| GO:00464671 | Oral cavity | LP | membrane lipid biosynthetic process | 49/4623 | 142/18723 | 5.44e-03 | 3.31e-02 | 49 |
| Page: 1 |
| Pathway ID | Tissue | Disease Stage | Description | Gene Ratio | Bg Ratio | pvalue | p.adjust | qvalue | Count |
| hsa04071 | Colorectum | AD | Sphingolipid signaling pathway | 43/2092 | 121/8465 | 4.83e-03 | 2.28e-02 | 1.45e-02 | 43 |
| hsa040711 | Colorectum | AD | Sphingolipid signaling pathway | 43/2092 | 121/8465 | 4.83e-03 | 2.28e-02 | 1.45e-02 | 43 |
| hsa040712 | Colorectum | MSS | Sphingolipid signaling pathway | 40/1875 | 121/8465 | 3.56e-03 | 1.64e-02 | 1.01e-02 | 40 |
| hsa040713 | Colorectum | MSS | Sphingolipid signaling pathway | 40/1875 | 121/8465 | 3.56e-03 | 1.64e-02 | 1.01e-02 | 40 |
| hsa0407116 | Esophagus | ESCC | Sphingolipid signaling pathway | 85/4205 | 121/8465 | 3.04e-06 | 1.73e-05 | 8.84e-06 | 85 |
| hsa0407117 | Esophagus | ESCC | Sphingolipid signaling pathway | 85/4205 | 121/8465 | 3.04e-06 | 1.73e-05 | 8.84e-06 | 85 |
| hsa040718 | Liver | HCC | Sphingolipid signaling pathway | 72/4020 | 121/8465 | 5.01e-03 | 1.47e-02 | 8.18e-03 | 72 |
| hsa0407111 | Liver | HCC | Sphingolipid signaling pathway | 72/4020 | 121/8465 | 5.01e-03 | 1.47e-02 | 8.18e-03 | 72 |
| hsa0407114 | Oral cavity | OSCC | Sphingolipid signaling pathway | 82/3704 | 121/8465 | 6.97e-08 | 5.08e-07 | 2.58e-07 | 82 |
| hsa0407115 | Oral cavity | OSCC | Sphingolipid signaling pathway | 82/3704 | 121/8465 | 6.97e-08 | 5.08e-07 | 2.58e-07 | 82 |
| hsa0407122 | Oral cavity | LP | Sphingolipid signaling pathway | 48/2418 | 121/8465 | 5.30e-03 | 2.15e-02 | 1.39e-02 | 48 |
| hsa0407132 | Oral cavity | LP | Sphingolipid signaling pathway | 48/2418 | 121/8465 | 5.30e-03 | 2.15e-02 | 1.39e-02 | 48 |
| Page: 1 |
Top |
Cell-cell communication analysis |
| Identification of potential cell-cell interactions between two cell types and their ligand-receptor pairs for different disease states |
| Ligand | Receptor | LRpair | Pathway | Tissue | Disease Stage |
| Page: 1 |
Top |
Single-cell gene regulatory network inference analysis |
| Find out the significant the regulons (TFs) and the target genes of each regulon across cell types for different disease states |
| TF | Cell Type | Tissue | Disease Stage | Target Gene | RSS | Regulon Activity |
| ∗The dot plots of a searched regulon are shown for all cell subpopulations in each disease state of each tissue based on the regulon specific score inferred using pySCENIC and by calculating the average expression. |
| Page: 1 |
Top |
Somatic mutation of malignant transformation related genes |
| Annotation of somatic variants for genes involved in malignant transformation |
| Hugo Symbol | Variant Class | Variant Classification | dbSNP RS | HGVSc | HGVSp | HGVSp Short | SWISSPROT | BIOTYPE | SIFT | PolyPhen | Tumor Sample Barcode | Tissue | Histology | Sex | Age | Stage | Therapy Types | Drugs | Outcome |
| SPTSSA | SNV | Missense_Mutation | c.142N>A | p.Ala48Thr | p.A48T | Q969W0 | protein_coding | tolerated(0.31) | probably_damaging(0.946) | TCGA-E9-A1RF-01 | Breast | breast invasive carcinoma | Female | >=65 | III/IV | Hormone Therapy | tamoxiphen | SD | |
| SPTSSA | SNV | Missense_Mutation | c.46T>C | p.Phe16Leu | p.F16L | Q969W0 | protein_coding | tolerated(1) | benign(0) | TCGA-AA-3663-01 | Colorectum | colon adenocarcinoma | Male | <65 | I/II | Unknown | Unknown | SD | |
| SPTSSA | SNV | Missense_Mutation | c.187A>G | p.Ile63Val | p.I63V | Q969W0 | protein_coding | tolerated(0.65) | probably_damaging(0.956) | TCGA-EI-6507-01 | Colorectum | rectum adenocarcinoma | Male | <65 | I/II | Unknown | Unknown | SD | |
| SPTSSA | SNV | Missense_Mutation | novel | c.39N>A | p.Met13Ile | p.M13I | Q969W0 | protein_coding | tolerated(0.39) | benign(0) | TCGA-G3-A3CG-01 | Liver | liver hepatocellular carcinoma | Male | >=65 | I/II | Targeted Molecular therapy | sorafenib | SD |
| SPTSSA | SNV | Missense_Mutation | c.180C>G | p.Ile60Met | p.I60M | Q969W0 | protein_coding | deleterious(0.01) | probably_damaging(0.913) | TCGA-50-5946-01 | Lung | lung adenocarcinoma | Male | <65 | I/II | Unknown | Unknown | PD | |
| SPTSSA | SNV | Missense_Mutation | c.118N>C | p.Met40Leu | p.M40L | Q969W0 | protein_coding | tolerated(0.43) | benign(0) | TCGA-86-8073-01 | Lung | lung adenocarcinoma | Male | <65 | I/II | Unknown | Unknown | SD | |
| SPTSSA | SNV | Missense_Mutation | c.41N>G | p.Ser14Cys | p.S14C | Q969W0 | protein_coding | tolerated(0.1) | probably_damaging(0.996) | TCGA-DJ-A2Q1-01 | Thyroid | thyroid carcinoma | Female | <65 | I/II | Unknown | Unknown | SD |
| Page: 1 |
Top |
Related drugs of malignant transformation related genes |
| Identification of chemicals and drugs interact with genes involved in malignant transfromation |
| (DGIdb 4.0) |
| Entrez ID | Symbol | Category | Interaction Types | Drug Claim Name | Drug Name | PMIDs |
| Page: 1 |

Copyright 2023-Present -The University of Texas Health Science Center at Houston |