
|
|||||
|
 | |
| |
| |
| |
| |
| |
|
Gene: SPTLC3 |
Gene summary for SPTLC3 |
| Gene information | Species | Human | Gene symbol | SPTLC3 | Gene ID | 55304 |
| Gene name | serine palmitoyltransferase long chain base subunit 3 | |
| Gene Alias | C20orf38 | |
| Cytomap | 20p12.1 | |
| Gene Type | protein-coding | GO ID | GO:0006066 | UniProtAcc | Q9NUV7 |
Top |
Malignant transformation analysis |
| Identification of the aberrant gene expression in precancerous and cancerous lesions by comparing the gene expression of stem-like cells in diseased tissues with normal stem cells |
| Entrez ID | Symbol | Replicates | Species | Organ | Tissue | Adj P-value | Log2FC | Malignancy |
| 55304 | SPTLC3 | RNA-P25T1-P25T1-1 | Human | Lung | AIS | 1.44e-06 | 5.85e-01 | -0.2116 |
| 55304 | SPTLC3 | RNA-P25T1-P25T1-3 | Human | Lung | AIS | 1.48e-03 | 6.95e-01 | -0.2107 |
| 55304 | SPTLC3 | RNA-P25T1-P25T1-4 | Human | Lung | AIS | 6.86e-04 | 4.31e-01 | -0.2119 |
| 55304 | SPTLC3 | RNA-P6T2-P6T2-1 | Human | Lung | IAC | 7.89e-03 | 3.12e-01 | -0.0166 |
| 55304 | SPTLC3 | RNA-P6T2-P6T2-2 | Human | Lung | IAC | 1.54e-05 | 2.64e-01 | -0.0132 |
| 55304 | SPTLC3 | RNA-P6T2-P6T2-3 | Human | Lung | IAC | 3.85e-09 | 3.55e-01 | -0.013 |
| 55304 | SPTLC3 | RNA-P6T2-P6T2-4 | Human | Lung | IAC | 5.55e-05 | 3.47e-01 | -0.0121 |
| 55304 | SPTLC3 | RNA-P7T1-P7T1-2 | Human | Lung | AIS | 3.80e-02 | 4.31e-01 | -0.0876 |
| Page: 1 |
| Tissue | Expression Dynamics | Abbreviation |
| Lung | 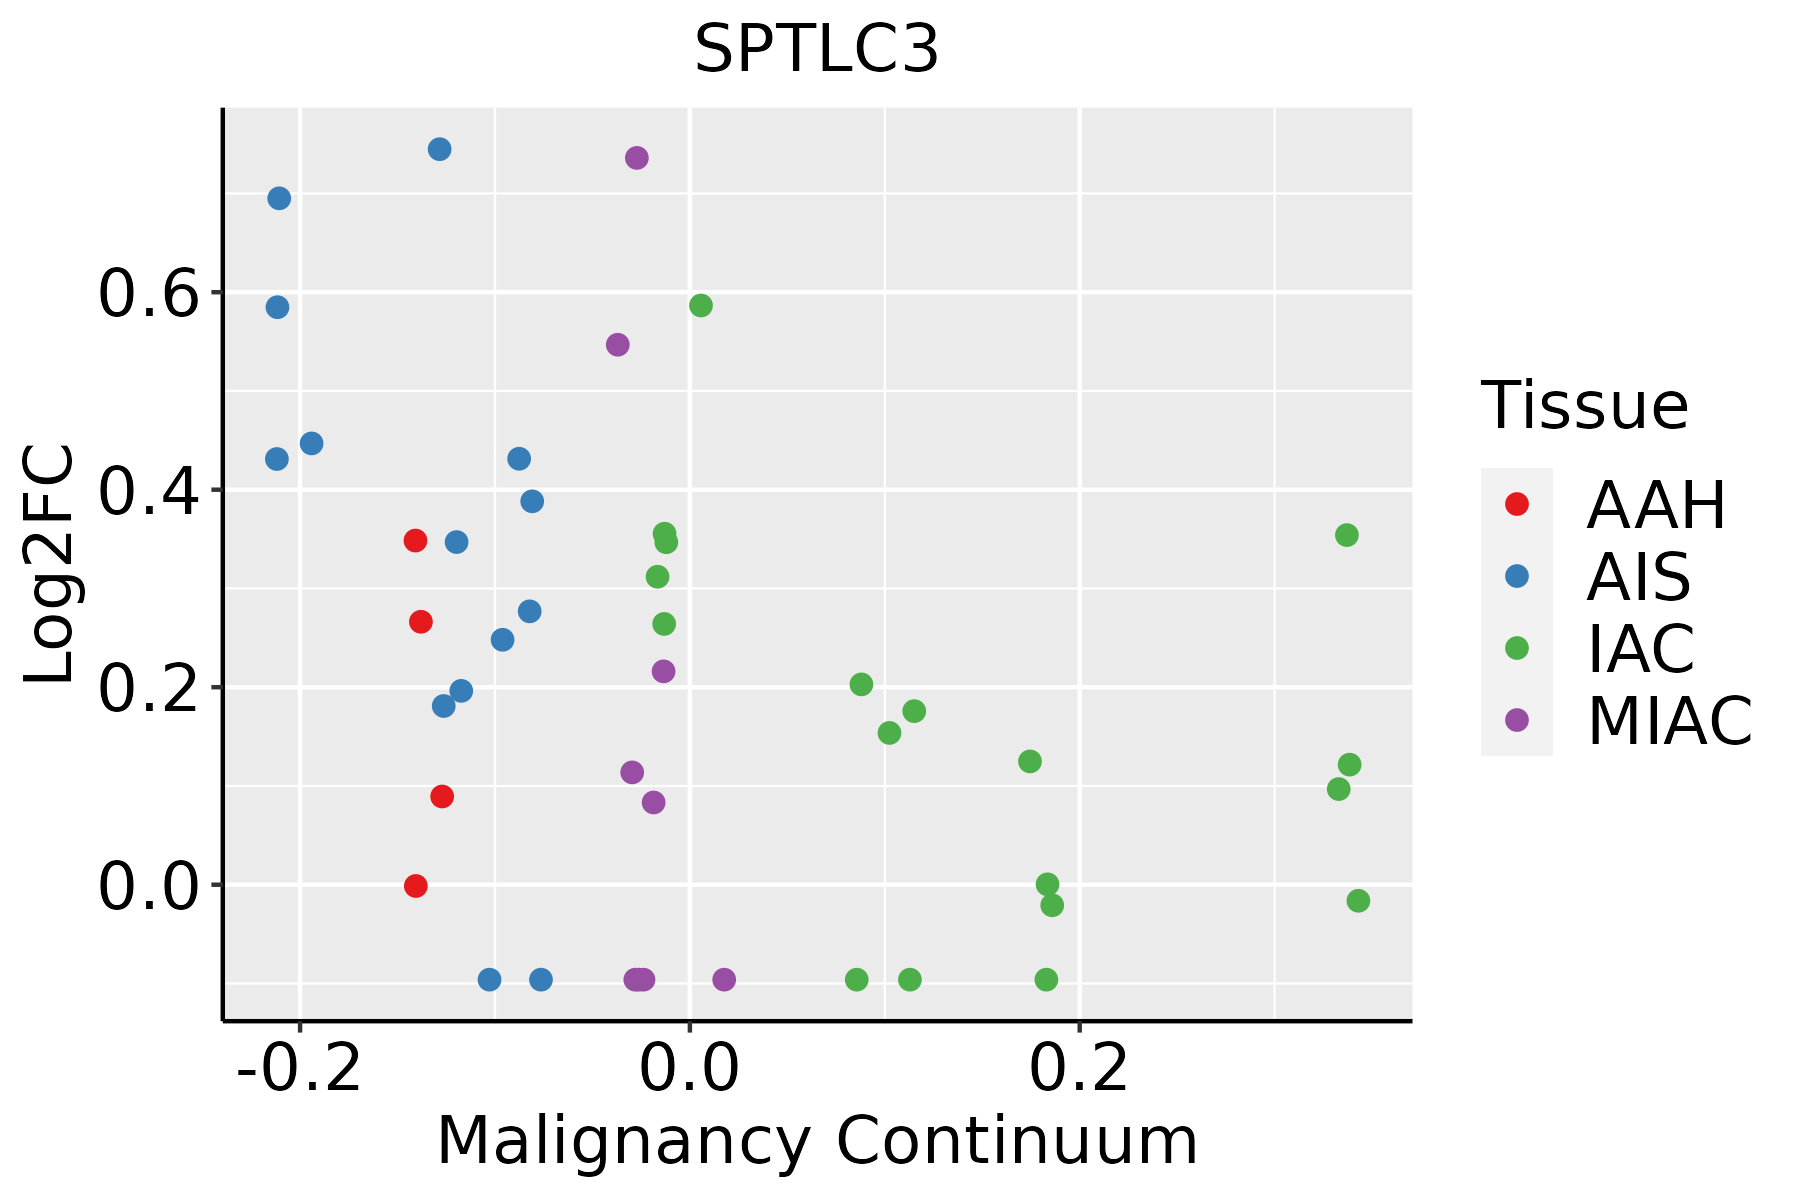 | AAH: Atypical adenomatous hyperplasia |
| AIS: Adenocarcinoma in situ | ||
| IAC: Invasive lung adenocarcinoma | ||
| MIA: Minimally invasive adenocarcinoma |
| ∗log2FC in expression of this searched gene in stem-like cells from each diseased tissue sample relative to stem-like cells in normal samples in each tissue plotted against the malignancy continuum. Samples are colored based on if they are from different disease stage. |
Top |
Malignant transformation related pathway analysis |
| Find out the enriched GO biological processes and KEGG pathways involved in transition from healthy to precancer to cancer |
| Tissue | Disease Stage | Enriched GO biological Processes |
| Colorectum | AD |  |
| Colorectum | SER |  |
| Colorectum | MSS |  |
| Colorectum | MSI-H |  |
| Colorectum | FAP |  |
| ∗Top 15 enriched GO BP terms are showed in the bar plot of each disease state in each tissue. Each row represents a significant GO biological process which is colored according to the -log10(p.adjust). |
| Page: 1 2 3 4 5 6 7 8 9 |
| GO ID | Tissue | Disease Stage | Description | Gene Ratio | Bg Ratio | pvalue | p.adjust | Count |
| Page: 1 |
| Pathway ID | Tissue | Disease Stage | Description | Gene Ratio | Bg Ratio | pvalue | p.adjust | qvalue | Count |
| Page: 1 |
Top |
Cell-cell communication analysis |
| Identification of potential cell-cell interactions between two cell types and their ligand-receptor pairs for different disease states |
| Ligand | Receptor | LRpair | Pathway | Tissue | Disease Stage |
| Page: 1 |
Top |
Single-cell gene regulatory network inference analysis |
| Find out the significant the regulons (TFs) and the target genes of each regulon across cell types for different disease states |
| TF | Cell Type | Tissue | Disease Stage | Target Gene | RSS | Regulon Activity |
| ∗The dot plots of a searched regulon are shown for all cell subpopulations in each disease state of each tissue based on the regulon specific score inferred using pySCENIC and by calculating the average expression. |
| Page: 1 |
Top |
Somatic mutation of malignant transformation related genes |
| Annotation of somatic variants for genes involved in malignant transformation |
| Hugo Symbol | Variant Class | Variant Classification | dbSNP RS | HGVSc | HGVSp | HGVSp Short | SWISSPROT | BIOTYPE | SIFT | PolyPhen | Tumor Sample Barcode | Tissue | Histology | Sex | Age | Stage | Therapy Types | Drugs | Outcome |
| SPTLC3 | SNV | Missense_Mutation | c.181C>T | p.His61Tyr | p.H61Y | Q9NUV7 | protein_coding | tolerated(1) | benign(0) | TCGA-AC-A23H-01 | Breast | breast invasive carcinoma | Female | >=65 | I/II | Unknown | Unknown | PD | |
| SPTLC3 | SNV | Missense_Mutation | c.1489G>A | p.Glu497Lys | p.E497K | Q9NUV7 | protein_coding | tolerated(0.06) | probably_damaging(0.911) | TCGA-AC-A5XS-01 | Breast | breast invasive carcinoma | Female | >=65 | I/II | Hormone Therapy | femara | SD | |
| SPTLC3 | SNV | Missense_Mutation | rs780899594 | c.161N>T | p.Ser54Leu | p.S54L | Q9NUV7 | protein_coding | tolerated(0.06) | benign(0.086) | TCGA-B6-A1KN-01 | Breast | breast invasive carcinoma | Female | <65 | III/IV | Unknown | Unknown | SD |
| SPTLC3 | SNV | Missense_Mutation | c.1569N>T | p.Met523Ile | p.M523I | Q9NUV7 | protein_coding | tolerated(0.56) | benign(0) | TCGA-D8-A1XK-01 | Breast | breast invasive carcinoma | Female | <65 | I/II | Chemotherapy | doxorubicine+cyclophosphamide | SD | |
| SPTLC3 | SNV | Missense_Mutation | rs767292560 | c.1415N>T | p.Ala472Val | p.A472V | Q9NUV7 | protein_coding | tolerated(0.26) | benign(0.06) | TCGA-2W-A8YY-01 | Cervix | cervical & endocervical cancer | Female | <65 | I/II | Chemotherapy | cisplatin | CR |
| SPTLC3 | SNV | Missense_Mutation | c.841G>C | p.Glu281Gln | p.E281Q | Q9NUV7 | protein_coding | deleterious(0.02) | probably_damaging(0.999) | TCGA-C5-A1BQ-01 | Cervix | cervical & endocervical cancer | Female | >=65 | III/IV | Chemotherapy | cisplatin | CR | |
| SPTLC3 | SNV | Missense_Mutation | c.704C>T | p.Ser235Leu | p.S235L | Q9NUV7 | protein_coding | deleterious(0) | benign(0.247) | TCGA-C5-A2LZ-01 | Cervix | cervical & endocervical cancer | Female | >=65 | III/IV | Unknown | Unknown | PD | |
| SPTLC3 | SNV | Missense_Mutation | rs375500511 | c.694N>A | p.Ala232Thr | p.A232T | Q9NUV7 | protein_coding | deleterious(0) | probably_damaging(0.959) | TCGA-EA-A410-01 | Cervix | cervical & endocervical cancer | Female | <65 | I/II | Unknown | Unknown | SD |
| SPTLC3 | SNV | Missense_Mutation | novel | c.603N>C | p.Glu201Asp | p.E201D | Q9NUV7 | protein_coding | tolerated(0.2) | possibly_damaging(0.859) | TCGA-EA-A5ZE-01 | Cervix | cervical & endocervical cancer | Female | <65 | I/II | Unknown | Unknown | PD |
| SPTLC3 | SNV | Missense_Mutation | c.816N>G | p.Phe272Leu | p.F272L | Q9NUV7 | protein_coding | deleterious(0) | probably_damaging(0.938) | TCGA-JW-A5VJ-01 | Cervix | cervical & endocervical cancer | Female | <65 | I/II | Unknown | Unknown | PD |
| Page: 1 2 3 4 5 6 7 8 9 10 |
Top |
Related drugs of malignant transformation related genes |
| Identification of chemicals and drugs interact with genes involved in malignant transfromation |
| (DGIdb 4.0) |
| Entrez ID | Symbol | Category | Interaction Types | Drug Claim Name | Drug Name | PMIDs |
| 55304 | SPTLC3 | ENZYME | inhibitor | 178103276 | MYRIOCIN |
| Page: 1 |

Copyright 2023-Present -The University of Texas Health Science Center at Houston |