| Tissue | Expression Dynamics | Abbreviation |
| Colorectum (GSE201348) |  | FAP: Familial adenomatous polyposis |
| CRC: Colorectal cancer |
| Colorectum (HTA11) |  | AD: Adenomas |
| SER: Sessile serrated lesions |
| MSI-H: Microsatellite-high colorectal cancer |
| MSS: Microsatellite stable colorectal cancer |
| Esophagus |  | ESCC: Esophageal squamous cell carcinoma |
| HGIN: High-grade intraepithelial neoplasias |
| LGIN: Low-grade intraepithelial neoplasias |
| Liver | 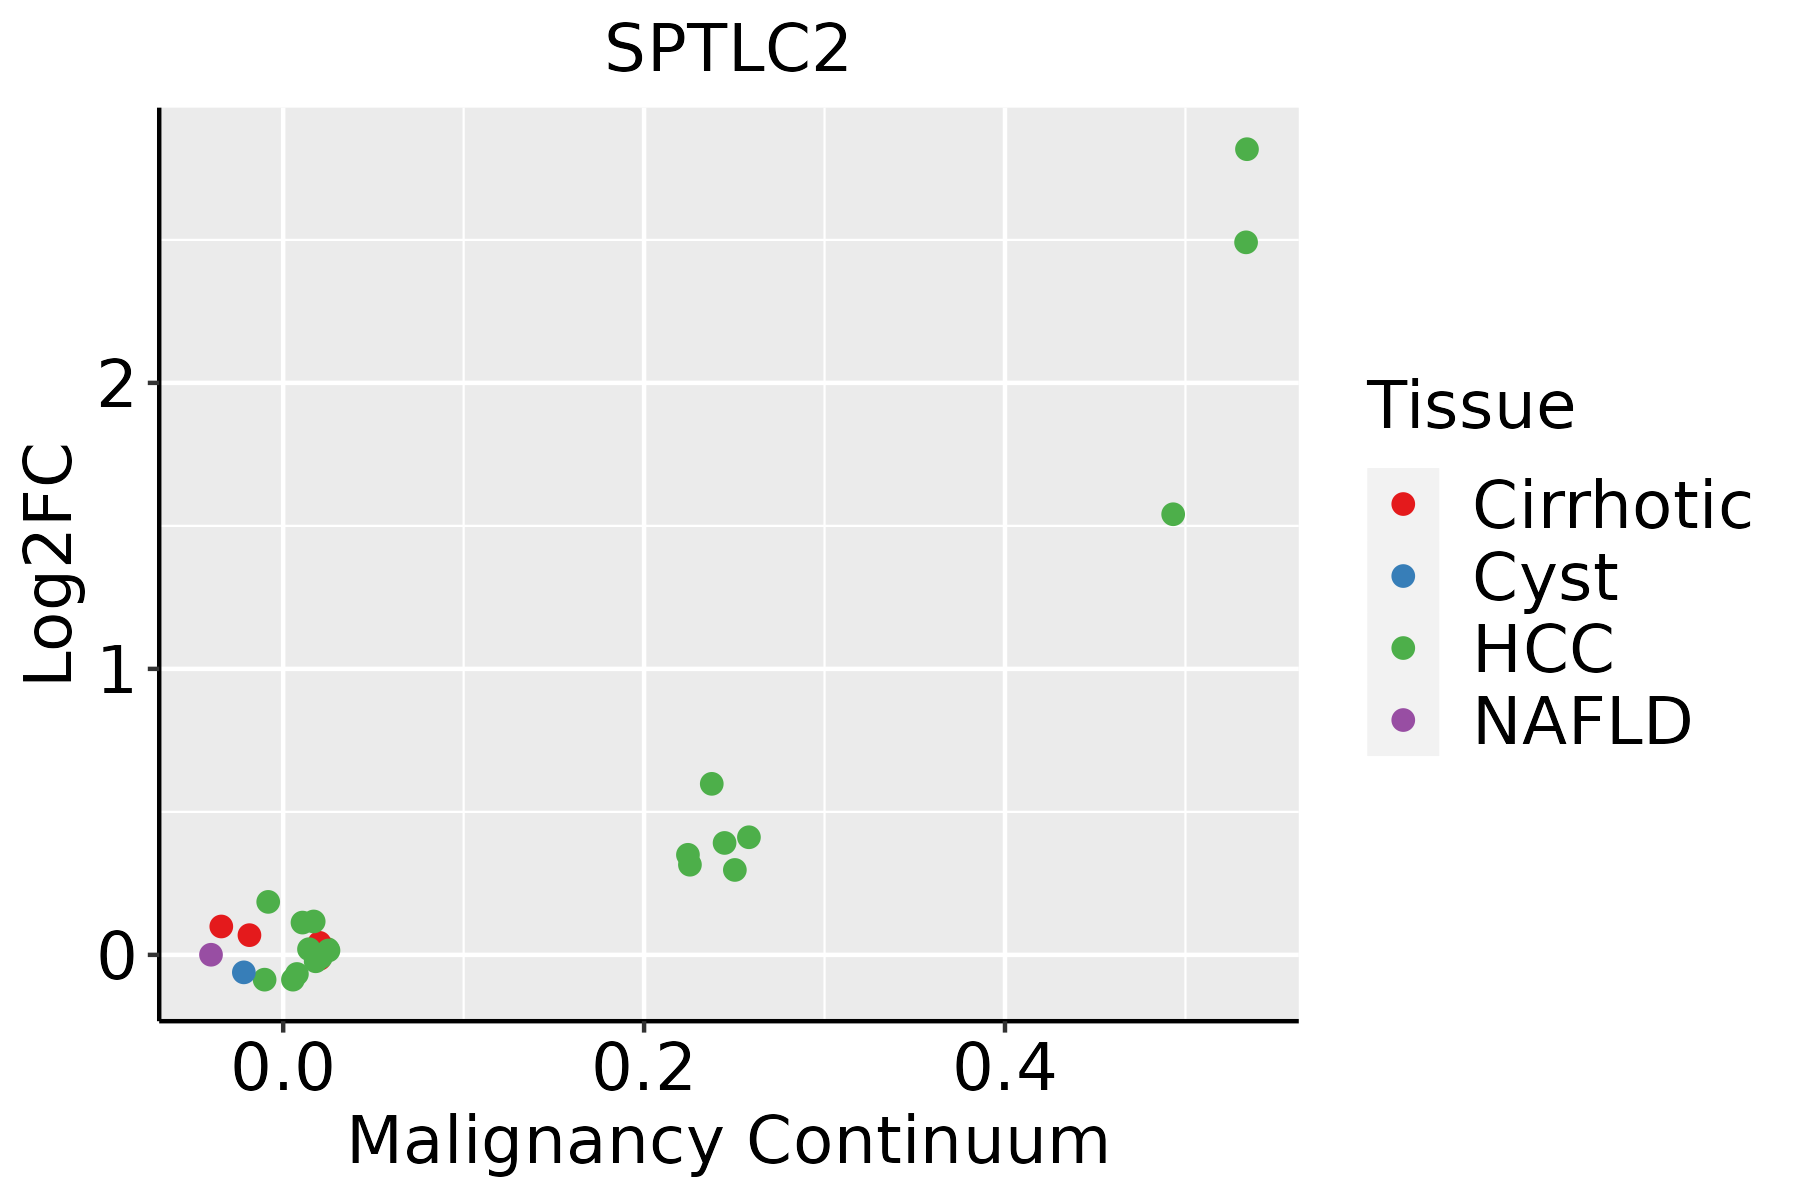 | HCC: Hepatocellular carcinoma |
| NAFLD: Non-alcoholic fatty liver disease |
| Lung | 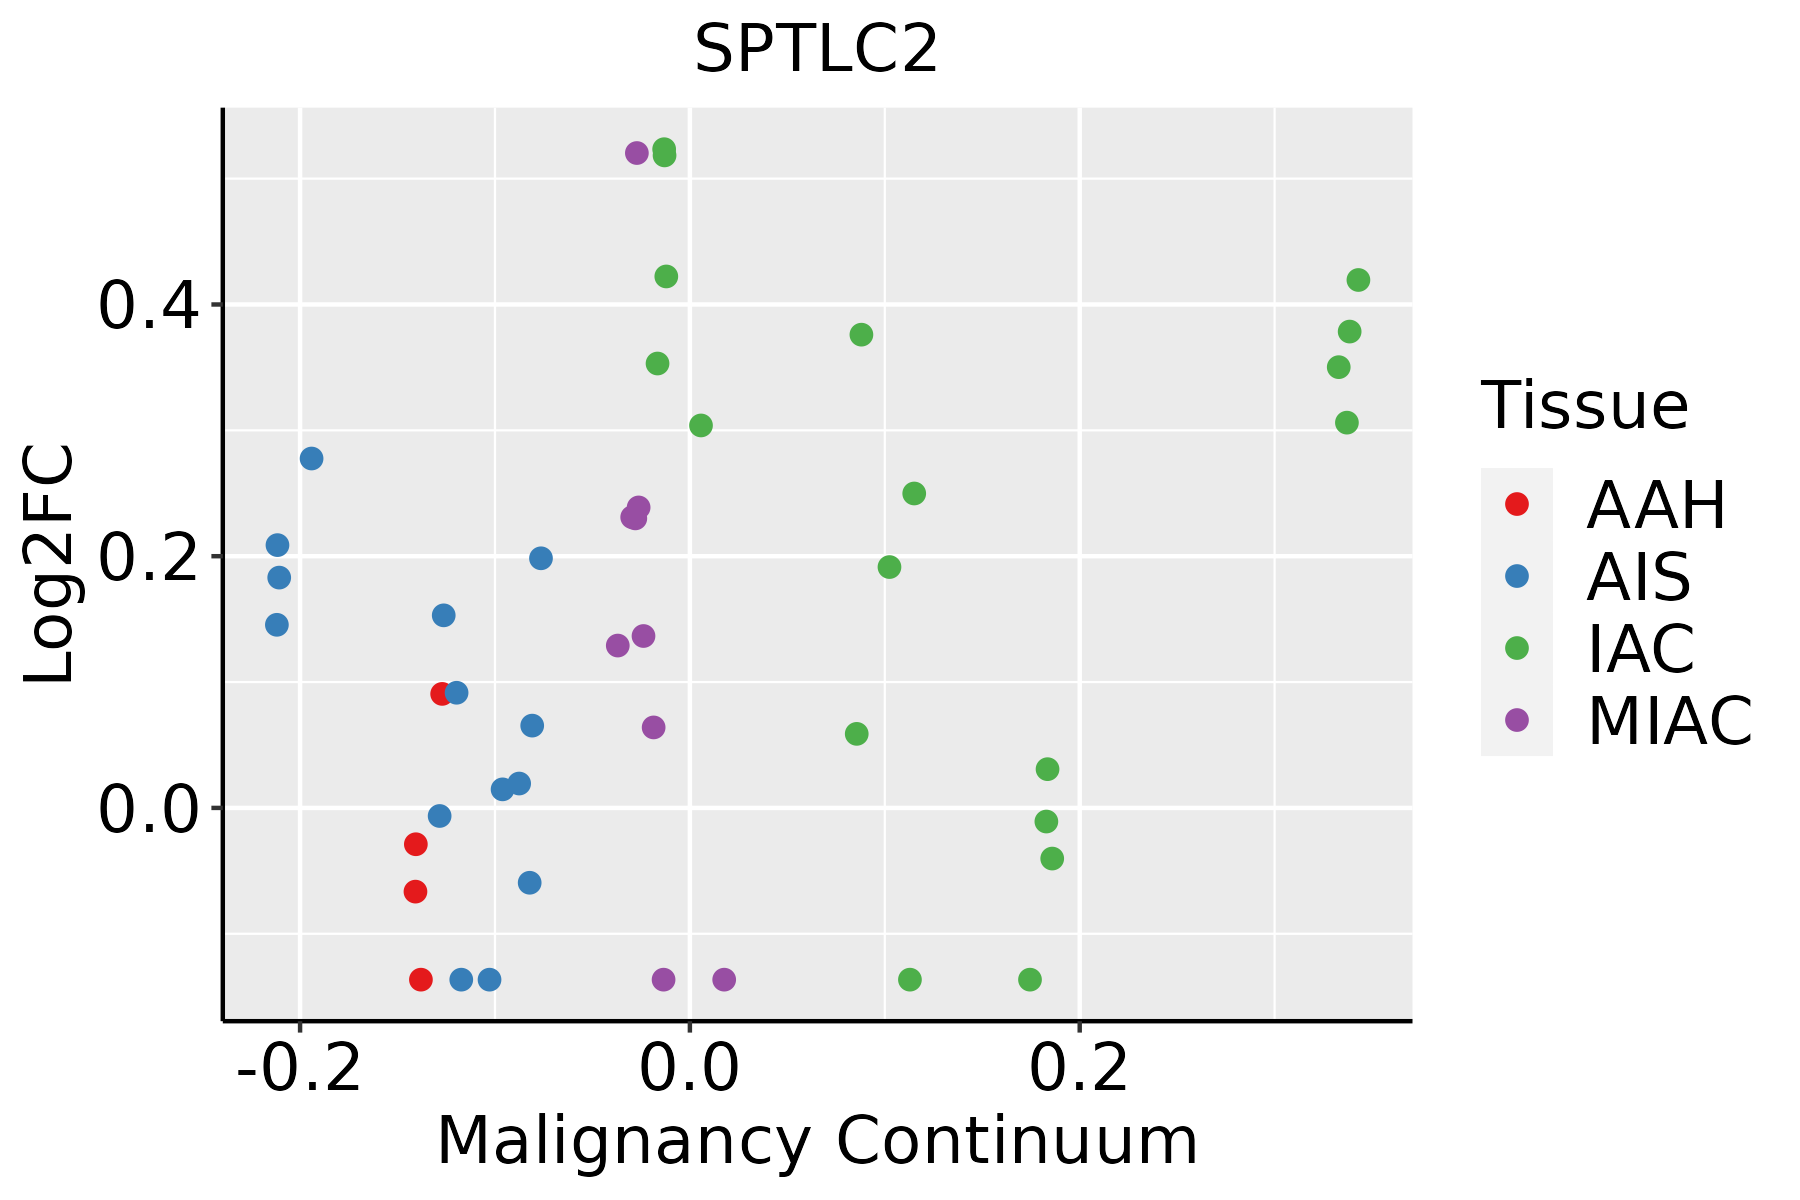 | AAH: Atypical adenomatous hyperplasia |
| AIS: Adenocarcinoma in situ |
| IAC: Invasive lung adenocarcinoma |
| MIA: Minimally invasive adenocarcinoma |
| Oral Cavity | 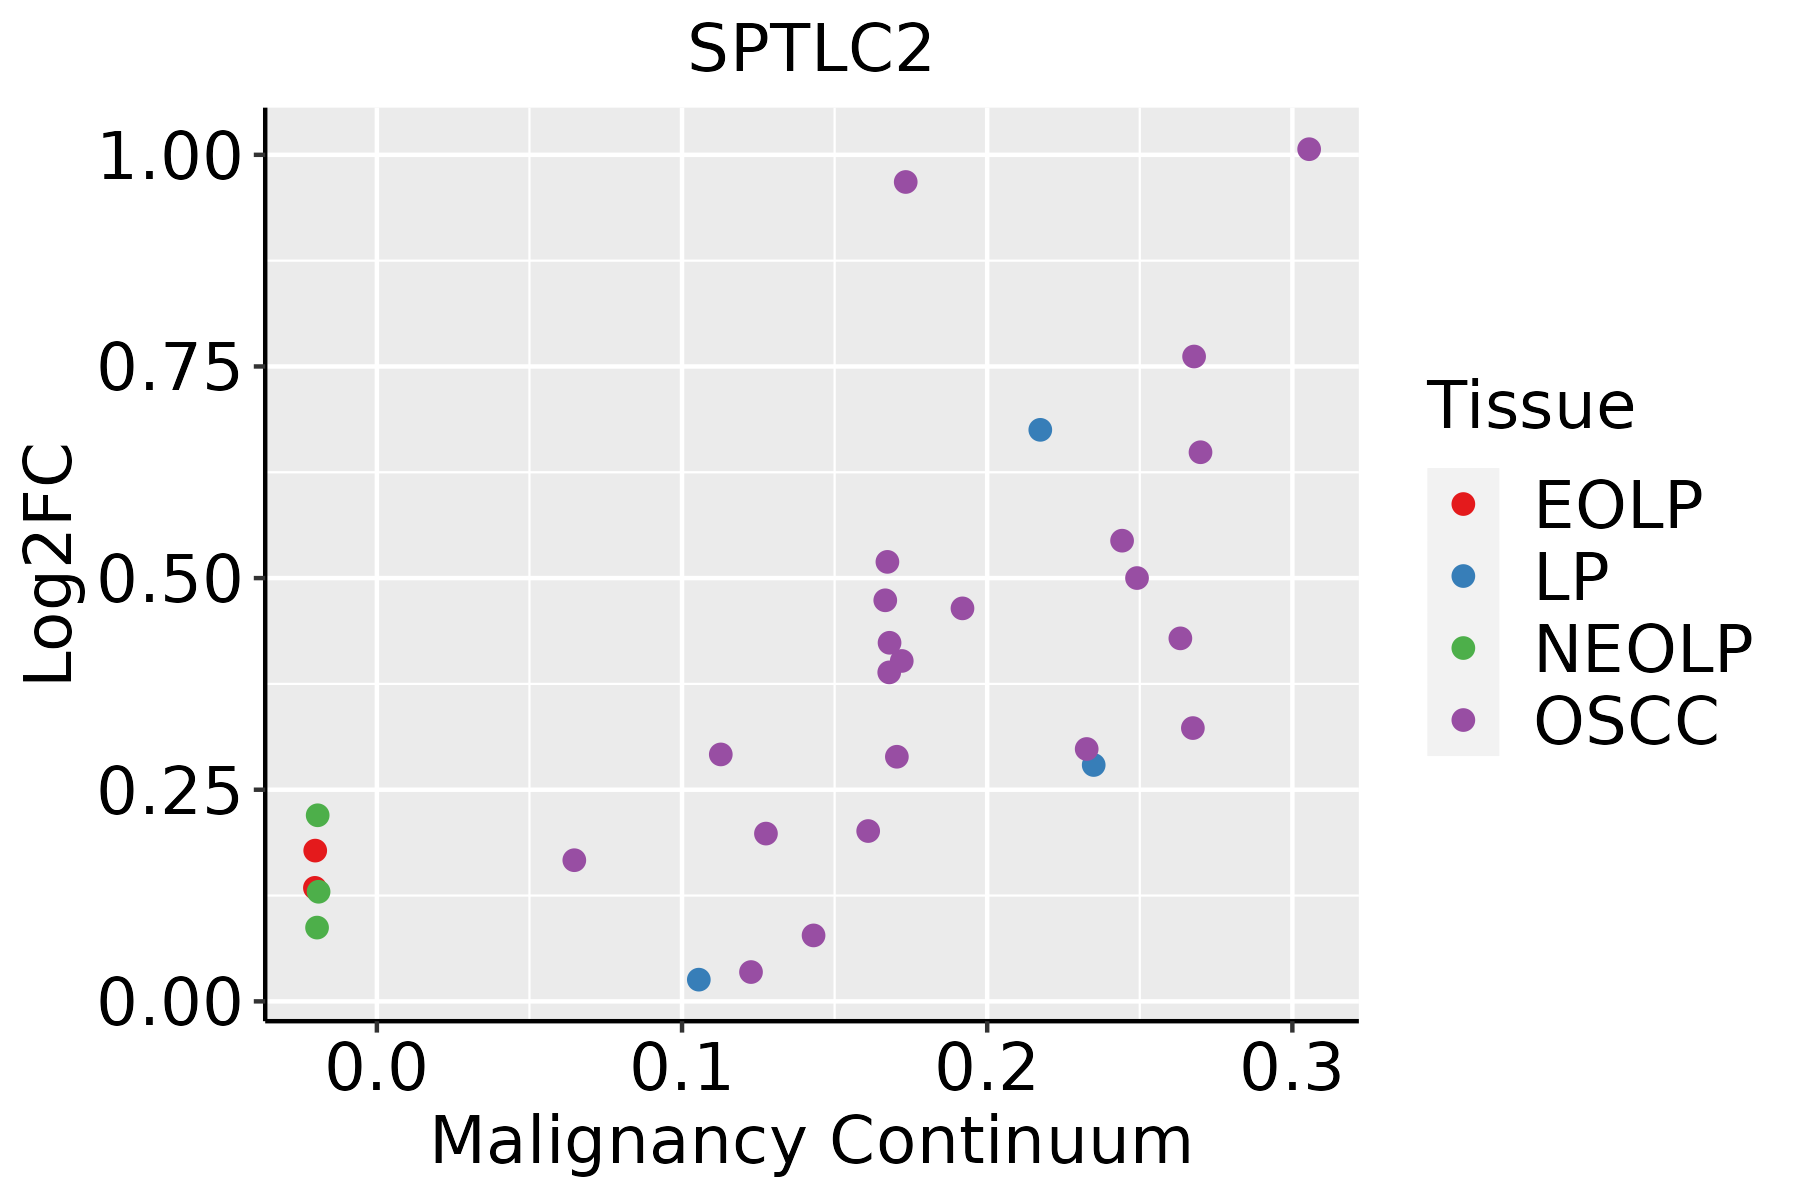 | EOLP: Erosive Oral lichen planus |
| LP: leukoplakia |
| NEOLP: Non-erosive oral lichen planus |
| OSCC: Oral squamous cell carcinoma |
| Prostate | 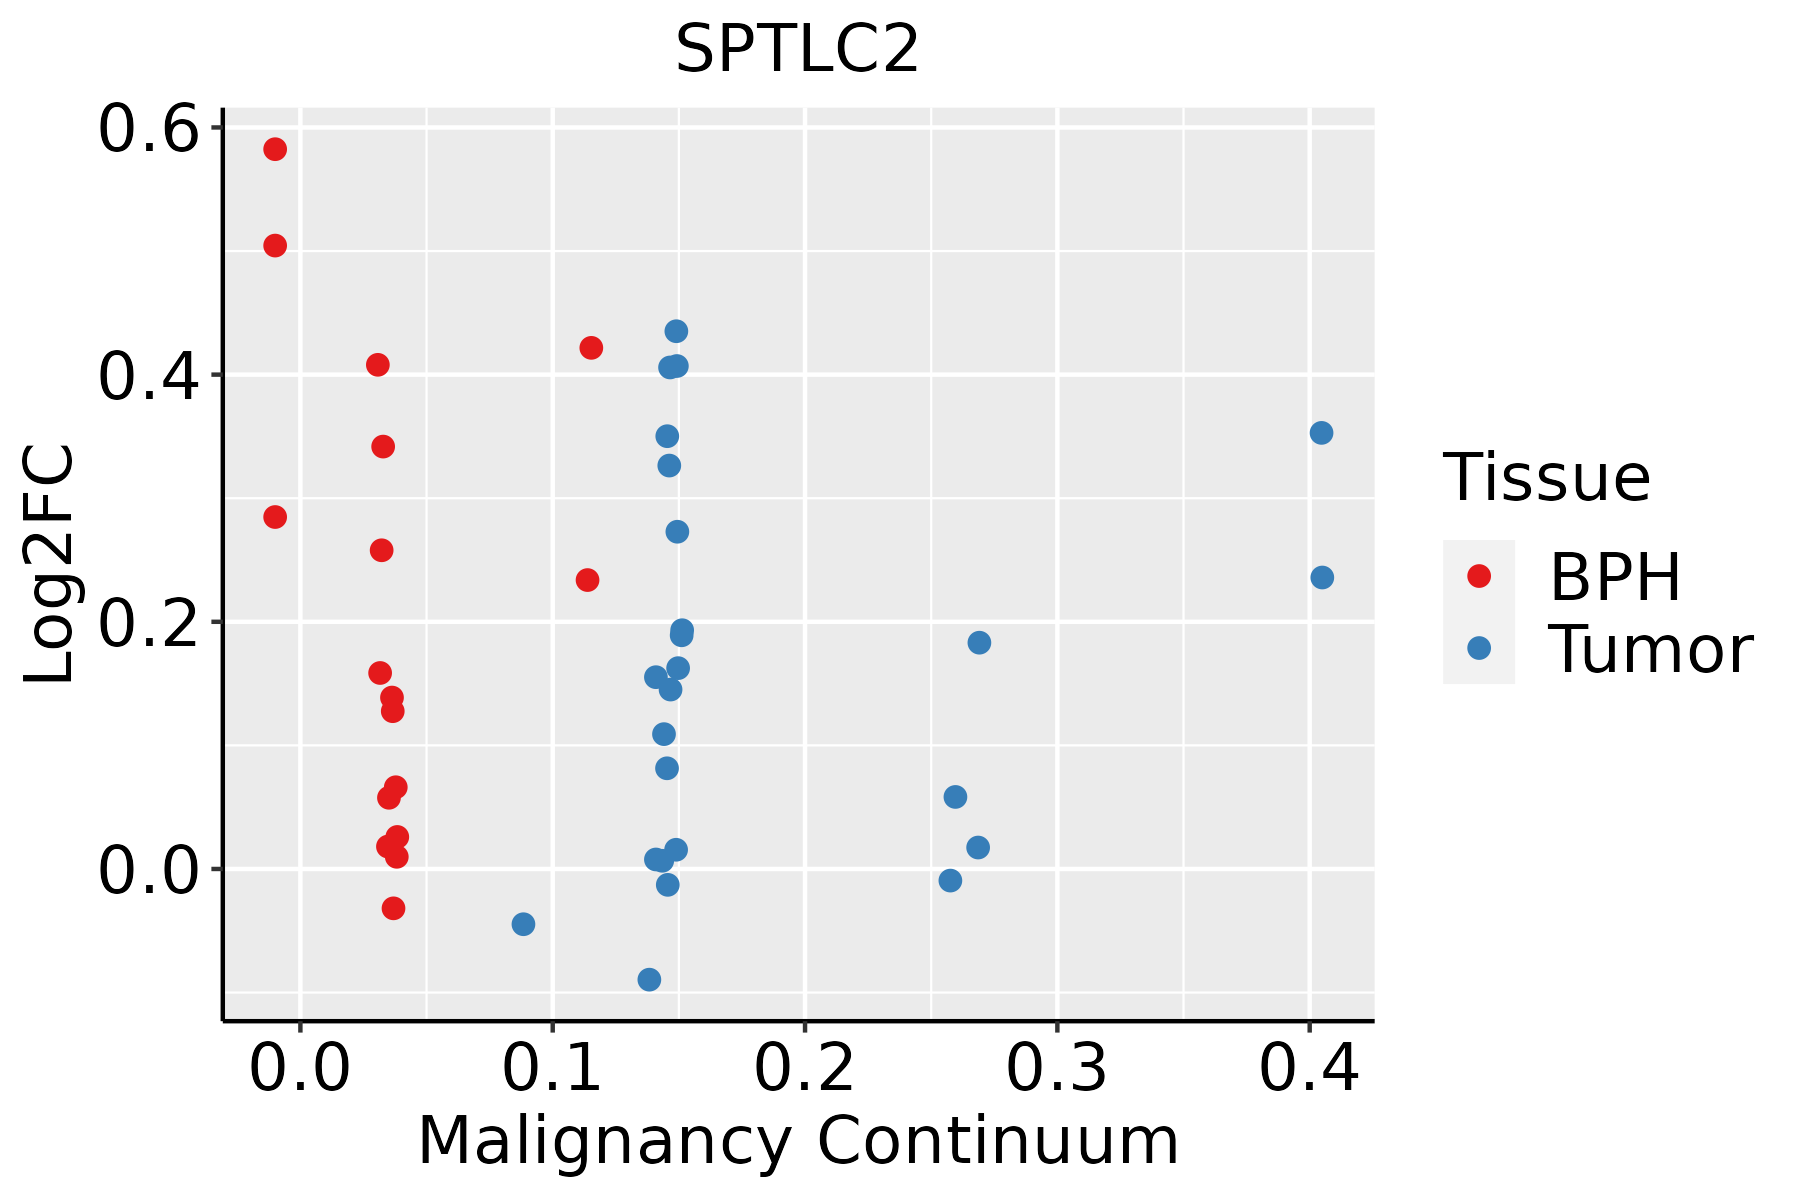 | BPH: Benign Prostatic Hyperplasia |
| Thyroid | 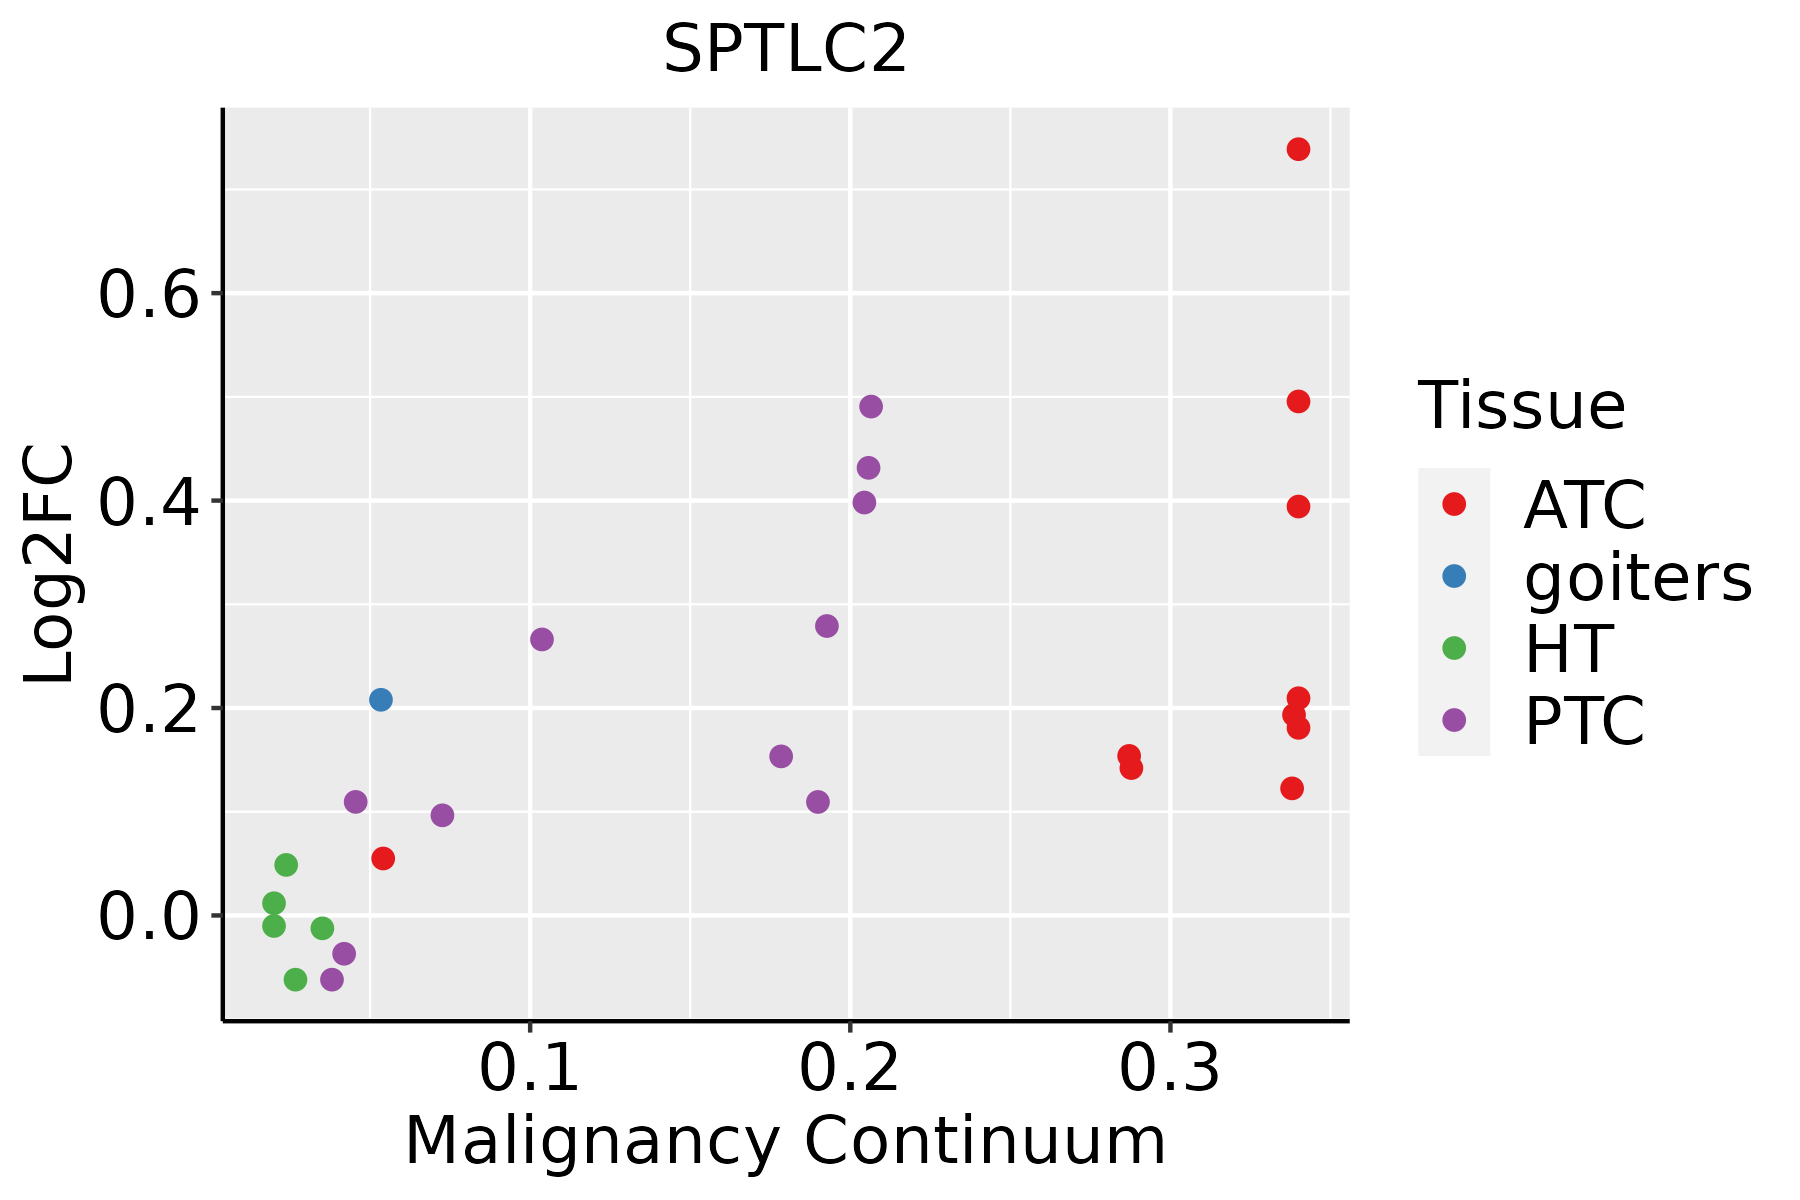 | ATC: Anaplastic thyroid cancer |
| HT: Hashimoto's thyroiditis |
| PTC: Papillary thyroid cancer |
| GO ID | Tissue | Disease Stage | Description | Gene Ratio | Bg Ratio | pvalue | p.adjust | Count |
| GO:0009896 | Colorectum | AD | positive regulation of catabolic process | 180/3918 | 492/18723 | 4.33e-16 | 1.94e-13 | 180 |
| GO:0031331 | Colorectum | AD | positive regulation of cellular catabolic process | 156/3918 | 427/18723 | 4.68e-14 | 1.05e-11 | 156 |
| GO:0010506 | Colorectum | AD | regulation of autophagy | 111/3918 | 317/18723 | 3.57e-09 | 2.35e-07 | 111 |
| GO:0016236 | Colorectum | AD | macroautophagy | 103/3918 | 291/18723 | 6.76e-09 | 4.15e-07 | 103 |
| GO:0006066 | Colorectum | AD | alcohol metabolic process | 106/3918 | 353/18723 | 3.02e-05 | 5.57e-04 | 106 |
| GO:0061912 | Colorectum | AD | selective autophagy | 29/3918 | 68/18723 | 4.20e-05 | 7.39e-04 | 29 |
| GO:0016241 | Colorectum | AD | regulation of macroautophagy | 50/3918 | 141/18723 | 4.55e-05 | 7.92e-04 | 50 |
| GO:0010508 | Colorectum | AD | positive regulation of autophagy | 43/3918 | 124/18723 | 2.64e-04 | 3.27e-03 | 43 |
| GO:0006644 | Colorectum | AD | phospholipid metabolic process | 101/3918 | 383/18723 | 5.80e-03 | 3.67e-02 | 101 |
| GO:00098962 | Colorectum | MSS | positive regulation of catabolic process | 163/3467 | 492/18723 | 3.10e-15 | 9.22e-13 | 163 |
| GO:00313312 | Colorectum | MSS | positive regulation of cellular catabolic process | 140/3467 | 427/18723 | 7.02e-13 | 1.33e-10 | 140 |
| GO:00162362 | Colorectum | MSS | macroautophagy | 93/3467 | 291/18723 | 2.08e-08 | 1.17e-06 | 93 |
| GO:00105062 | Colorectum | MSS | regulation of autophagy | 95/3467 | 317/18723 | 4.36e-07 | 1.71e-05 | 95 |
| GO:00619122 | Colorectum | MSS | selective autophagy | 27/3467 | 68/18723 | 3.68e-05 | 7.09e-04 | 27 |
| GO:00162412 | Colorectum | MSS | regulation of macroautophagy | 44/3467 | 141/18723 | 1.88e-04 | 2.64e-03 | 44 |
| GO:00060662 | Colorectum | MSS | alcohol metabolic process | 92/3467 | 353/18723 | 2.57e-04 | 3.46e-03 | 92 |
| GO:00098964 | Colorectum | FAP | positive regulation of catabolic process | 126/2622 | 492/18723 | 3.76e-12 | 2.56e-09 | 126 |
| GO:00313314 | Colorectum | FAP | positive regulation of cellular catabolic process | 110/2622 | 427/18723 | 6.09e-11 | 2.19e-08 | 110 |
| GO:00105063 | Colorectum | FAP | regulation of autophagy | 80/2622 | 317/18723 | 6.43e-08 | 4.54e-06 | 80 |
| GO:00162363 | Colorectum | FAP | macroautophagy | 70/2622 | 291/18723 | 2.73e-06 | 1.02e-04 | 70 |
| Pathway ID | Tissue | Disease Stage | Description | Gene Ratio | Bg Ratio | pvalue | p.adjust | qvalue | Count |
| hsa04071 | Colorectum | AD | Sphingolipid signaling pathway | 43/2092 | 121/8465 | 4.83e-03 | 2.28e-02 | 1.45e-02 | 43 |
| hsa040711 | Colorectum | AD | Sphingolipid signaling pathway | 43/2092 | 121/8465 | 4.83e-03 | 2.28e-02 | 1.45e-02 | 43 |
| hsa040714 | Colorectum | FAP | Sphingolipid signaling pathway | 34/1404 | 121/8465 | 9.53e-04 | 5.22e-03 | 3.17e-03 | 34 |
| hsa040715 | Colorectum | FAP | Sphingolipid signaling pathway | 34/1404 | 121/8465 | 9.53e-04 | 5.22e-03 | 3.17e-03 | 34 |
| hsa040716 | Colorectum | CRC | Sphingolipid signaling pathway | 30/1091 | 121/8465 | 2.49e-04 | 3.09e-03 | 2.09e-03 | 30 |
| hsa040717 | Colorectum | CRC | Sphingolipid signaling pathway | 30/1091 | 121/8465 | 2.49e-04 | 3.09e-03 | 2.09e-03 | 30 |
| hsa0407116 | Esophagus | ESCC | Sphingolipid signaling pathway | 85/4205 | 121/8465 | 3.04e-06 | 1.73e-05 | 8.84e-06 | 85 |
| hsa006003 | Esophagus | ESCC | Sphingolipid metabolism | 36/4205 | 53/8465 | 5.41e-03 | 1.36e-02 | 6.99e-03 | 36 |
| hsa0407117 | Esophagus | ESCC | Sphingolipid signaling pathway | 85/4205 | 121/8465 | 3.04e-06 | 1.73e-05 | 8.84e-06 | 85 |
| hsa0060012 | Esophagus | ESCC | Sphingolipid metabolism | 36/4205 | 53/8465 | 5.41e-03 | 1.36e-02 | 6.99e-03 | 36 |
| hsa040718 | Liver | HCC | Sphingolipid signaling pathway | 72/4020 | 121/8465 | 5.01e-03 | 1.47e-02 | 8.18e-03 | 72 |
| hsa00600 | Liver | HCC | Sphingolipid metabolism | 34/4020 | 53/8465 | 1.06e-02 | 2.71e-02 | 1.51e-02 | 34 |
| hsa0407111 | Liver | HCC | Sphingolipid signaling pathway | 72/4020 | 121/8465 | 5.01e-03 | 1.47e-02 | 8.18e-03 | 72 |
| hsa006001 | Liver | HCC | Sphingolipid metabolism | 34/4020 | 53/8465 | 1.06e-02 | 2.71e-02 | 1.51e-02 | 34 |
| hsa040719 | Lung | IAC | Sphingolipid signaling pathway | 28/1053 | 121/8465 | 7.30e-04 | 6.08e-03 | 4.04e-03 | 28 |
| hsa0407112 | Lung | IAC | Sphingolipid signaling pathway | 28/1053 | 121/8465 | 7.30e-04 | 6.08e-03 | 4.04e-03 | 28 |
| hsa0407114 | Oral cavity | OSCC | Sphingolipid signaling pathway | 82/3704 | 121/8465 | 6.97e-08 | 5.08e-07 | 2.58e-07 | 82 |
| hsa006002 | Oral cavity | OSCC | Sphingolipid metabolism | 33/3704 | 53/8465 | 5.00e-03 | 1.20e-02 | 6.13e-03 | 33 |
| hsa0407115 | Oral cavity | OSCC | Sphingolipid signaling pathway | 82/3704 | 121/8465 | 6.97e-08 | 5.08e-07 | 2.58e-07 | 82 |
| hsa0060011 | Oral cavity | OSCC | Sphingolipid metabolism | 33/3704 | 53/8465 | 5.00e-03 | 1.20e-02 | 6.13e-03 | 33 |
| Hugo Symbol | Variant Class | Variant Classification | dbSNP RS | HGVSc | HGVSp | HGVSp Short | SWISSPROT | BIOTYPE | SIFT | PolyPhen | Tumor Sample Barcode | Tissue | Histology | Sex | Age | Stage | Therapy Types | Drugs | Outcome |
| SPTLC2 | SNV | Missense_Mutation | novel | c.637N>A | p.Leu213Met | p.L213M | O15270 | protein_coding | tolerated(0.11) | benign(0.213) | TCGA-A1-A0SI-01 | Breast | breast invasive carcinoma | Female | <65 | I/II | Unknown | Unknown | SD |
| SPTLC2 | SNV | Missense_Mutation | | c.1627N>T | p.Arg543Trp | p.R543W | O15270 | protein_coding | deleterious(0) | possibly_damaging(0.634) | TCGA-AN-A046-01 | Breast | breast invasive carcinoma | Female | >=65 | I/II | Unknown | Unknown | SD |
| SPTLC2 | SNV | Missense_Mutation | novel | c.841A>G | p.Lys281Glu | p.K281E | O15270 | protein_coding | deleterious(0.03) | possibly_damaging(0.479) | TCGA-AR-A5QQ-01 | Breast | breast invasive carcinoma | Female | >=65 | III/IV | Chemotherapy | carboplatin | PD |
| SPTLC2 | SNV | Missense_Mutation | | c.509N>G | p.Val170Gly | p.V170G | O15270 | protein_coding | deleterious(0) | possibly_damaging(0.71) | TCGA-BH-A0DL-01 | Breast | breast invasive carcinoma | Female | <65 | I/II | Chemotherapy | cytoxan | CR |
| SPTLC2 | SNV | Missense_Mutation | | c.1363N>C | p.Glu455Gln | p.E455Q | O15270 | protein_coding | tolerated(0.5) | benign(0.129) | TCGA-BH-A0DZ-01 | Breast | breast invasive carcinoma | Female | <65 | I/II | Chemotherapy | docetaxel | SD |
| SPTLC2 | SNV | Missense_Mutation | | c.1588G>A | p.Glu530Lys | p.E530K | O15270 | protein_coding | tolerated(0.12) | benign(0.077) | TCGA-D8-A27G-01 | Breast | breast invasive carcinoma | Female | >=65 | I/II | Unknown | Unknown | SD |
| SPTLC2 | SNV | Missense_Mutation | novel | c.1489N>A | p.Gly497Arg | p.G497R | O15270 | protein_coding | deleterious(0) | probably_damaging(0.999) | TCGA-2W-A8YY-01 | Cervix | cervical & endocervical cancer | Female | <65 | I/II | Chemotherapy | cisplatin | CR |
| SPTLC2 | SNV | Missense_Mutation | rs763898397 | c.1628N>A | p.Arg543Gln | p.R543Q | O15270 | protein_coding | deleterious(0.04) | benign(0.086) | TCGA-C5-A1BM-01 | Cervix | cervical & endocervical cancer | Female | >=65 | I/II | Unknown | Unknown | SD |
| SPTLC2 | deletion | Frame_Shift_Del | novel | c.395_407delACAACTGGAATCG | p.Asp132GlyfsTer31 | p.D132Gfs*31 | O15270 | protein_coding | | | TCGA-FU-A23L-01 | Cervix | cervical & endocervical cancer | Female | <65 | I/II | Chemotherapy | cisplatin | CR |
| SPTLC2 | SNV | Missense_Mutation | | c.331T>G | p.Phe111Val | p.F111V | O15270 | protein_coding | deleterious(0) | probably_damaging(0.945) | TCGA-A6-3809-01 | Colorectum | colon adenocarcinoma | Female | >=65 | I/II | Unknown | Unknown | SD |


