
|
|||||
|
 | |
| |
| |
| |
| |
| |
|
Gene: SPTLC1 |
Gene summary for SPTLC1 |
| Gene information | Species | Human | Gene symbol | SPTLC1 | Gene ID | 10558 |
| Gene name | serine palmitoyltransferase long chain base subunit 1 | |
| Gene Alias | HSAN1 | |
| Cytomap | 9q22.31 | |
| Gene Type | protein-coding | GO ID | GO:0006066 | UniProtAcc | O15269 |
Top |
Malignant transformation analysis |
| Identification of the aberrant gene expression in precancerous and cancerous lesions by comparing the gene expression of stem-like cells in diseased tissues with normal stem cells |
| Entrez ID | Symbol | Replicates | Species | Organ | Tissue | Adj P-value | Log2FC | Malignancy |
| 10558 | SPTLC1 | CCI_2 | Human | Cervix | CC | 6.60e-05 | 7.48e-01 | 0.5249 |
| 10558 | SPTLC1 | CCI_3 | Human | Cervix | CC | 7.48e-09 | 6.87e-01 | 0.516 |
| 10558 | SPTLC1 | sample3 | Human | Cervix | CC | 3.99e-08 | 2.84e-01 | 0.1387 |
| 10558 | SPTLC1 | T3 | Human | Cervix | CC | 2.50e-08 | 3.11e-01 | 0.1389 |
| 10558 | SPTLC1 | LZE2T | Human | Esophagus | ESCC | 7.41e-06 | 6.16e-01 | 0.082 |
| 10558 | SPTLC1 | LZE4T | Human | Esophagus | ESCC | 7.27e-20 | 5.49e-01 | 0.0811 |
| 10558 | SPTLC1 | LZE5T | Human | Esophagus | ESCC | 8.29e-07 | 4.54e-01 | 0.0514 |
| 10558 | SPTLC1 | LZE7T | Human | Esophagus | ESCC | 1.02e-12 | 5.70e-01 | 0.0667 |
| 10558 | SPTLC1 | LZE8T | Human | Esophagus | ESCC | 1.50e-10 | 3.69e-01 | 0.067 |
| 10558 | SPTLC1 | LZE20T | Human | Esophagus | ESCC | 1.86e-09 | 3.06e-01 | 0.0662 |
| 10558 | SPTLC1 | LZE22D1 | Human | Esophagus | HGIN | 7.43e-03 | 2.38e-01 | 0.0595 |
| 10558 | SPTLC1 | LZE22T | Human | Esophagus | ESCC | 2.12e-03 | 2.72e-01 | 0.068 |
| 10558 | SPTLC1 | LZE24T | Human | Esophagus | ESCC | 2.24e-27 | 5.93e-01 | 0.0596 |
| 10558 | SPTLC1 | LZE21T | Human | Esophagus | ESCC | 4.50e-08 | 5.67e-01 | 0.0655 |
| 10558 | SPTLC1 | LZE6T | Human | Esophagus | ESCC | 8.50e-13 | 6.83e-01 | 0.0845 |
| 10558 | SPTLC1 | P1T-E | Human | Esophagus | ESCC | 7.99e-06 | 3.63e-01 | 0.0875 |
| 10558 | SPTLC1 | P2T-E | Human | Esophagus | ESCC | 1.39e-39 | 6.61e-01 | 0.1177 |
| 10558 | SPTLC1 | P4T-E | Human | Esophagus | ESCC | 1.41e-24 | 5.39e-01 | 0.1323 |
| 10558 | SPTLC1 | P5T-E | Human | Esophagus | ESCC | 1.29e-15 | 3.78e-01 | 0.1327 |
| 10558 | SPTLC1 | P8T-E | Human | Esophagus | ESCC | 4.39e-32 | 5.34e-01 | 0.0889 |
| Page: 1 2 3 4 5 6 |
| Tissue | Expression Dynamics | Abbreviation |
| Cervix |  | CC: Cervix cancer |
| HSIL_HPV: HPV-infected high-grade squamous intraepithelial lesions | ||
| N_HPV: HPV-infected normal cervix | ||
| Esophagus |  | ESCC: Esophageal squamous cell carcinoma |
| HGIN: High-grade intraepithelial neoplasias | ||
| LGIN: Low-grade intraepithelial neoplasias | ||
| Liver | 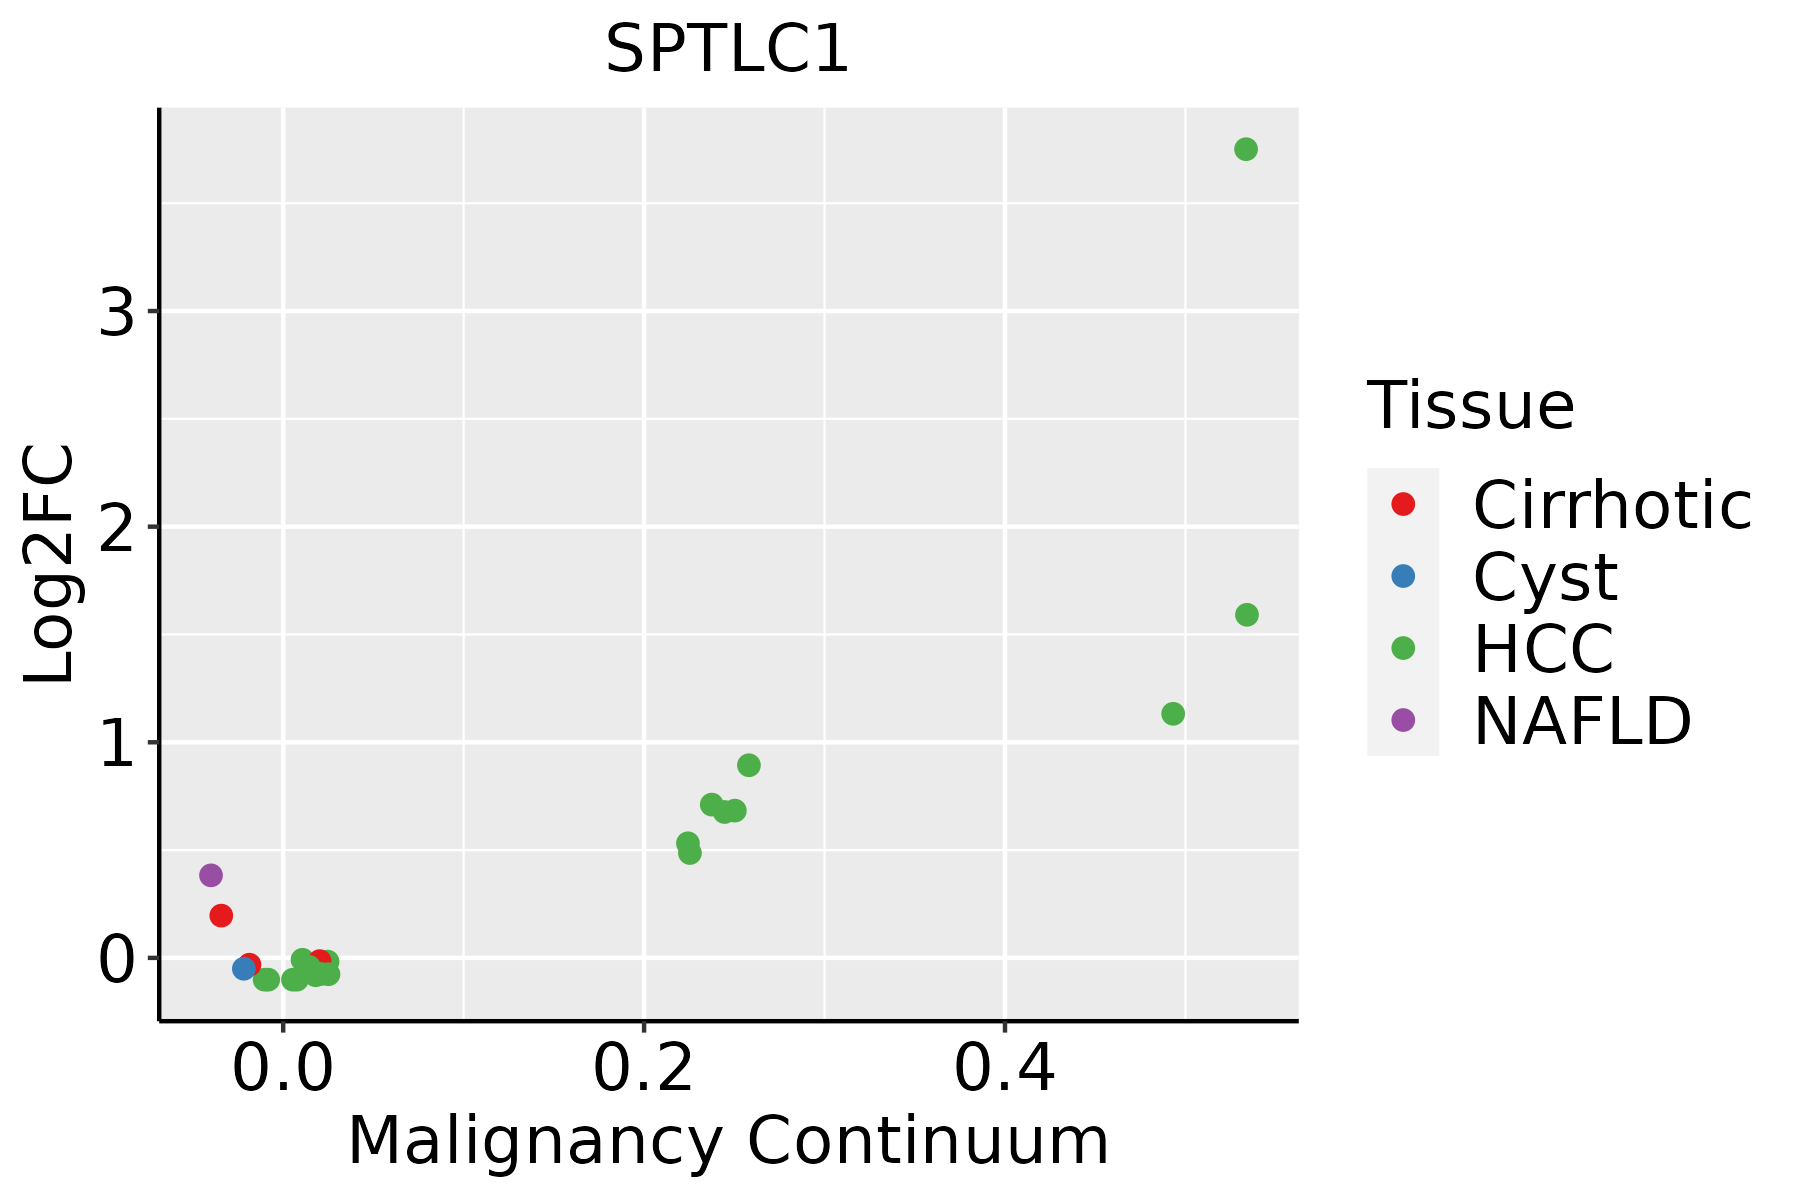 | HCC: Hepatocellular carcinoma |
| NAFLD: Non-alcoholic fatty liver disease | ||
| Oral Cavity |  | EOLP: Erosive Oral lichen planus |
| LP: leukoplakia | ||
| NEOLP: Non-erosive oral lichen planus | ||
| OSCC: Oral squamous cell carcinoma | ||
| Thyroid |  | ATC: Anaplastic thyroid cancer |
| HT: Hashimoto's thyroiditis | ||
| PTC: Papillary thyroid cancer |
| ∗log2FC in expression of this searched gene in stem-like cells from each diseased tissue sample relative to stem-like cells in normal samples in each tissue plotted against the malignancy continuum. Samples are colored based on if they are from different disease stage. |
Top |
Malignant transformation related pathway analysis |
| Find out the enriched GO biological processes and KEGG pathways involved in transition from healthy to precancer to cancer |
| Tissue | Disease Stage | Enriched GO biological Processes |
| Colorectum | AD |  |
| Colorectum | SER |  |
| Colorectum | MSS |  |
| Colorectum | MSI-H |  |
| Colorectum | FAP |  |
| ∗Top 15 enriched GO BP terms are showed in the bar plot of each disease state in each tissue. Each row represents a significant GO biological process which is colored according to the -log10(p.adjust). |
| Page: 1 2 3 4 5 6 7 8 9 |
| GO ID | Tissue | Disease Stage | Description | Gene Ratio | Bg Ratio | pvalue | p.adjust | Count |
| GO:000989610 | Cervix | CC | positive regulation of catabolic process | 109/2311 | 492/18723 | 5.26e-10 | 6.99e-08 | 109 |
| GO:003133110 | Cervix | CC | positive regulation of cellular catabolic process | 91/2311 | 427/18723 | 9.64e-08 | 5.25e-06 | 91 |
| GO:00162367 | Cervix | CC | macroautophagy | 58/2311 | 291/18723 | 1.40e-04 | 1.70e-03 | 58 |
| GO:00105067 | Cervix | CC | regulation of autophagy | 61/2311 | 317/18723 | 2.61e-04 | 2.87e-03 | 61 |
| GO:000989626 | Esophagus | HGIN | positive regulation of catabolic process | 126/2587 | 492/18723 | 1.46e-12 | 2.09e-10 | 126 |
| GO:003133126 | Esophagus | HGIN | positive regulation of cellular catabolic process | 112/2587 | 427/18723 | 5.15e-12 | 6.72e-10 | 112 |
| GO:001050616 | Esophagus | HGIN | regulation of autophagy | 84/2587 | 317/18723 | 1.39e-09 | 1.08e-07 | 84 |
| GO:001623616 | Esophagus | HGIN | macroautophagy | 77/2587 | 291/18723 | 7.15e-09 | 4.61e-07 | 77 |
| GO:00162418 | Esophagus | HGIN | regulation of macroautophagy | 38/2587 | 141/18723 | 2.80e-05 | 7.21e-04 | 38 |
| GO:00619128 | Esophagus | HGIN | selective autophagy | 19/2587 | 68/18723 | 1.68e-03 | 1.85e-02 | 19 |
| GO:00105088 | Esophagus | HGIN | positive regulation of autophagy | 28/2587 | 124/18723 | 5.34e-03 | 4.39e-02 | 28 |
| GO:001623617 | Esophagus | ESCC | macroautophagy | 216/8552 | 291/18723 | 1.94e-23 | 4.57e-21 | 216 |
| GO:0009896111 | Esophagus | ESCC | positive regulation of catabolic process | 332/8552 | 492/18723 | 4.36e-23 | 9.22e-21 | 332 |
| GO:0031331111 | Esophagus | ESCC | positive regulation of cellular catabolic process | 292/8552 | 427/18723 | 8.67e-22 | 1.53e-19 | 292 |
| GO:001050617 | Esophagus | ESCC | regulation of autophagy | 220/8552 | 317/18723 | 6.72e-18 | 6.36e-16 | 220 |
| GO:001624114 | Esophagus | ESCC | regulation of macroautophagy | 102/8552 | 141/18723 | 1.09e-10 | 3.27e-09 | 102 |
| GO:00066433 | Esophagus | ESCC | membrane lipid metabolic process | 130/8552 | 203/18723 | 9.29e-08 | 1.54e-06 | 130 |
| GO:00464673 | Esophagus | ESCC | membrane lipid biosynthetic process | 91/8552 | 142/18723 | 7.19e-06 | 7.19e-05 | 91 |
| GO:00060668 | Esophagus | ESCC | alcohol metabolic process | 202/8552 | 353/18723 | 7.32e-06 | 7.26e-05 | 202 |
| GO:001050816 | Esophagus | ESCC | positive regulation of autophagy | 81/8552 | 124/18723 | 7.74e-06 | 7.65e-05 | 81 |
| Page: 1 2 3 4 5 |
| Pathway ID | Tissue | Disease Stage | Description | Gene Ratio | Bg Ratio | pvalue | p.adjust | qvalue | Count |
| hsa0407110 | Cervix | CC | Sphingolipid signaling pathway | 35/1267 | 121/8465 | 5.70e-05 | 3.93e-04 | 2.32e-04 | 35 |
| hsa0407113 | Cervix | CC | Sphingolipid signaling pathway | 35/1267 | 121/8465 | 5.70e-05 | 3.93e-04 | 2.32e-04 | 35 |
| hsa0407116 | Esophagus | ESCC | Sphingolipid signaling pathway | 85/4205 | 121/8465 | 3.04e-06 | 1.73e-05 | 8.84e-06 | 85 |
| hsa006003 | Esophagus | ESCC | Sphingolipid metabolism | 36/4205 | 53/8465 | 5.41e-03 | 1.36e-02 | 6.99e-03 | 36 |
| hsa0407117 | Esophagus | ESCC | Sphingolipid signaling pathway | 85/4205 | 121/8465 | 3.04e-06 | 1.73e-05 | 8.84e-06 | 85 |
| hsa0060012 | Esophagus | ESCC | Sphingolipid metabolism | 36/4205 | 53/8465 | 5.41e-03 | 1.36e-02 | 6.99e-03 | 36 |
| hsa040718 | Liver | HCC | Sphingolipid signaling pathway | 72/4020 | 121/8465 | 5.01e-03 | 1.47e-02 | 8.18e-03 | 72 |
| hsa00600 | Liver | HCC | Sphingolipid metabolism | 34/4020 | 53/8465 | 1.06e-02 | 2.71e-02 | 1.51e-02 | 34 |
| hsa0407111 | Liver | HCC | Sphingolipid signaling pathway | 72/4020 | 121/8465 | 5.01e-03 | 1.47e-02 | 8.18e-03 | 72 |
| hsa006001 | Liver | HCC | Sphingolipid metabolism | 34/4020 | 53/8465 | 1.06e-02 | 2.71e-02 | 1.51e-02 | 34 |
| hsa0407114 | Oral cavity | OSCC | Sphingolipid signaling pathway | 82/3704 | 121/8465 | 6.97e-08 | 5.08e-07 | 2.58e-07 | 82 |
| hsa006002 | Oral cavity | OSCC | Sphingolipid metabolism | 33/3704 | 53/8465 | 5.00e-03 | 1.20e-02 | 6.13e-03 | 33 |
| hsa0407115 | Oral cavity | OSCC | Sphingolipid signaling pathway | 82/3704 | 121/8465 | 6.97e-08 | 5.08e-07 | 2.58e-07 | 82 |
| hsa0060011 | Oral cavity | OSCC | Sphingolipid metabolism | 33/3704 | 53/8465 | 5.00e-03 | 1.20e-02 | 6.13e-03 | 33 |
| hsa0407161 | Oral cavity | NEOLP | Sphingolipid signaling pathway | 36/1112 | 121/8465 | 1.11e-06 | 1.21e-05 | 7.64e-06 | 36 |
| hsa0407171 | Oral cavity | NEOLP | Sphingolipid signaling pathway | 36/1112 | 121/8465 | 1.11e-06 | 1.21e-05 | 7.64e-06 | 36 |
| Page: 1 |
Top |
Cell-cell communication analysis |
| Identification of potential cell-cell interactions between two cell types and their ligand-receptor pairs for different disease states |
| Ligand | Receptor | LRpair | Pathway | Tissue | Disease Stage |
| Page: 1 |
Top |
Single-cell gene regulatory network inference analysis |
| Find out the significant the regulons (TFs) and the target genes of each regulon across cell types for different disease states |
| TF | Cell Type | Tissue | Disease Stage | Target Gene | RSS | Regulon Activity |
| ∗The dot plots of a searched regulon are shown for all cell subpopulations in each disease state of each tissue based on the regulon specific score inferred using pySCENIC and by calculating the average expression. |
| Page: 1 |
Top |
Somatic mutation of malignant transformation related genes |
| Annotation of somatic variants for genes involved in malignant transformation |
| Hugo Symbol | Variant Class | Variant Classification | dbSNP RS | HGVSc | HGVSp | HGVSp Short | SWISSPROT | BIOTYPE | SIFT | PolyPhen | Tumor Sample Barcode | Tissue | Histology | Sex | Age | Stage | Therapy Types | Drugs | Outcome |
| SPTLC1 | SNV | Missense_Mutation | novel | c.386N>T | p.Gly129Val | p.G129V | O15269 | protein_coding | deleterious(0) | probably_damaging(1) | TCGA-A8-A09B-01 | Breast | breast invasive carcinoma | Female | <65 | III/IV | Chemotherapy | 5-fluorouracil | SD |
| SPTLC1 | SNV | Missense_Mutation | novel | c.764N>T | p.Cys255Phe | p.C255F | O15269 | protein_coding | deleterious(0) | probably_damaging(0.924) | TCGA-BH-A0BR-01 | Breast | breast invasive carcinoma | Female | <65 | I/II | Unknown | Unknown | SD |
| SPTLC1 | SNV | Missense_Mutation | c.887N>T | p.Asn296Ile | p.N296I | O15269 | protein_coding | deleterious(0.03) | benign(0.062) | TCGA-D8-A1XK-01 | Breast | breast invasive carcinoma | Female | <65 | I/II | Chemotherapy | doxorubicine+cyclophosphamide | SD | |
| SPTLC1 | SNV | Missense_Mutation | novel | c.359C>T | p.Ala120Val | p.A120V | O15269 | protein_coding | tolerated(0.23) | benign(0.015) | TCGA-Z7-A8R5-01 | Breast | breast invasive carcinoma | Female | <65 | III/IV | Chemotherapy | adriamycin | PD |
| SPTLC1 | SNV | Missense_Mutation | c.605C>T | p.Ser202Phe | p.S202F | O15269 | protein_coding | deleterious(0) | possibly_damaging(0.869) | TCGA-FU-A2QG-01 | Cervix | cervical & endocervical cancer | Female | <65 | I/II | Unknown | Unknown | SD | |
| SPTLC1 | SNV | Missense_Mutation | c.28N>A | p.Leu10Met | p.L10M | O15269 | protein_coding | tolerated(0.19) | benign(0.005) | TCGA-AA-3712-01 | Colorectum | colon adenocarcinoma | Male | >=65 | III/IV | Unknown | Unknown | SD | |
| SPTLC1 | SNV | Missense_Mutation | c.914N>T | p.Ala305Val | p.A305V | O15269 | protein_coding | tolerated(0.09) | benign(0.192) | TCGA-AA-3864-01 | Colorectum | colon adenocarcinoma | Male | >=65 | I/II | Unknown | Unknown | SD | |
| SPTLC1 | SNV | Missense_Mutation | novel | c.690G>T | p.Lys230Asn | p.K230N | O15269 | protein_coding | deleterious(0.02) | benign(0.292) | TCGA-AA-3984-01 | Colorectum | colon adenocarcinoma | Female | <65 | I/II | Unknown | Unknown | SD |
| SPTLC1 | SNV | Missense_Mutation | rs772769983 | c.1074G>T | p.Glu358Asp | p.E358D | O15269 | protein_coding | tolerated(0.33) | benign(0.014) | TCGA-AA-A010-01 | Colorectum | colon adenocarcinoma | Female | <65 | I/II | Chemotherapy | folinic | CR |
| SPTLC1 | SNV | Missense_Mutation | c.883A>C | p.Ile295Leu | p.I295L | O15269 | protein_coding | tolerated(0.11) | benign(0.042) | TCGA-AA-A010-01 | Colorectum | colon adenocarcinoma | Female | <65 | I/II | Chemotherapy | folinic | CR |
| Page: 1 2 3 4 5 |
Top |
Related drugs of malignant transformation related genes |
| Identification of chemicals and drugs interact with genes involved in malignant transfromation |
| (DGIdb 4.0) |
| Entrez ID | Symbol | Category | Interaction Types | Drug Claim Name | Drug Name | PMIDs |
| Page: 1 |

Copyright 2023-Present -The University of Texas Health Science Center at Houston |