
|
|||||
|
 | |
| |
| |
| |
| |
| |
|
Gene: SPTBN2 |
Gene summary for SPTBN2 |
| Gene information | Species | Human | Gene symbol | SPTBN2 | Gene ID | 6712 |
| Gene name | spectrin beta, non-erythrocytic 2 | |
| Gene Alias | GTRAP41 | |
| Cytomap | 11q13.2 | |
| Gene Type | protein-coding | GO ID | GO:0006810 | UniProtAcc | O15020 |
Top |
Malignant transformation analysis |
| Identification of the aberrant gene expression in precancerous and cancerous lesions by comparing the gene expression of stem-like cells in diseased tissues with normal stem cells |
| Entrez ID | Symbol | Replicates | Species | Organ | Tissue | Adj P-value | Log2FC | Malignancy |
| 6712 | SPTBN2 | LZE2T | Human | Esophagus | ESCC | 2.09e-03 | 3.46e-01 | 0.082 |
| 6712 | SPTBN2 | LZE20T | Human | Esophagus | ESCC | 1.17e-04 | 1.81e-01 | 0.0662 |
| 6712 | SPTBN2 | LZE24T | Human | Esophagus | ESCC | 5.93e-05 | 1.41e-01 | 0.0596 |
| 6712 | SPTBN2 | P2T-E | Human | Esophagus | ESCC | 1.41e-07 | 9.96e-02 | 0.1177 |
| 6712 | SPTBN2 | P4T-E | Human | Esophagus | ESCC | 7.68e-05 | 1.47e-01 | 0.1323 |
| 6712 | SPTBN2 | P5T-E | Human | Esophagus | ESCC | 8.28e-08 | 7.07e-02 | 0.1327 |
| 6712 | SPTBN2 | P8T-E | Human | Esophagus | ESCC | 9.49e-23 | 4.37e-01 | 0.0889 |
| 6712 | SPTBN2 | P10T-E | Human | Esophagus | ESCC | 1.69e-03 | 4.64e-02 | 0.116 |
| 6712 | SPTBN2 | P12T-E | Human | Esophagus | ESCC | 1.71e-05 | 1.23e-01 | 0.1122 |
| 6712 | SPTBN2 | P15T-E | Human | Esophagus | ESCC | 2.74e-08 | 2.03e-01 | 0.1149 |
| 6712 | SPTBN2 | P16T-E | Human | Esophagus | ESCC | 2.65e-02 | 6.05e-02 | 0.1153 |
| 6712 | SPTBN2 | P20T-E | Human | Esophagus | ESCC | 2.38e-05 | 9.18e-02 | 0.1124 |
| 6712 | SPTBN2 | P21T-E | Human | Esophagus | ESCC | 3.89e-07 | 1.20e-01 | 0.1617 |
| 6712 | SPTBN2 | P22T-E | Human | Esophagus | ESCC | 4.41e-04 | 6.02e-02 | 0.1236 |
| 6712 | SPTBN2 | P26T-E | Human | Esophagus | ESCC | 4.08e-04 | 5.28e-02 | 0.1276 |
| 6712 | SPTBN2 | P27T-E | Human | Esophagus | ESCC | 5.56e-03 | 3.79e-02 | 0.1055 |
| 6712 | SPTBN2 | P28T-E | Human | Esophagus | ESCC | 1.19e-12 | 2.40e-01 | 0.1149 |
| 6712 | SPTBN2 | P30T-E | Human | Esophagus | ESCC | 2.96e-12 | 3.27e-01 | 0.137 |
| 6712 | SPTBN2 | P31T-E | Human | Esophagus | ESCC | 1.86e-12 | 2.02e-01 | 0.1251 |
| 6712 | SPTBN2 | P36T-E | Human | Esophagus | ESCC | 3.94e-07 | 2.21e-01 | 0.1187 |
| Page: 1 2 3 |
| Tissue | Expression Dynamics | Abbreviation |
| Esophagus | 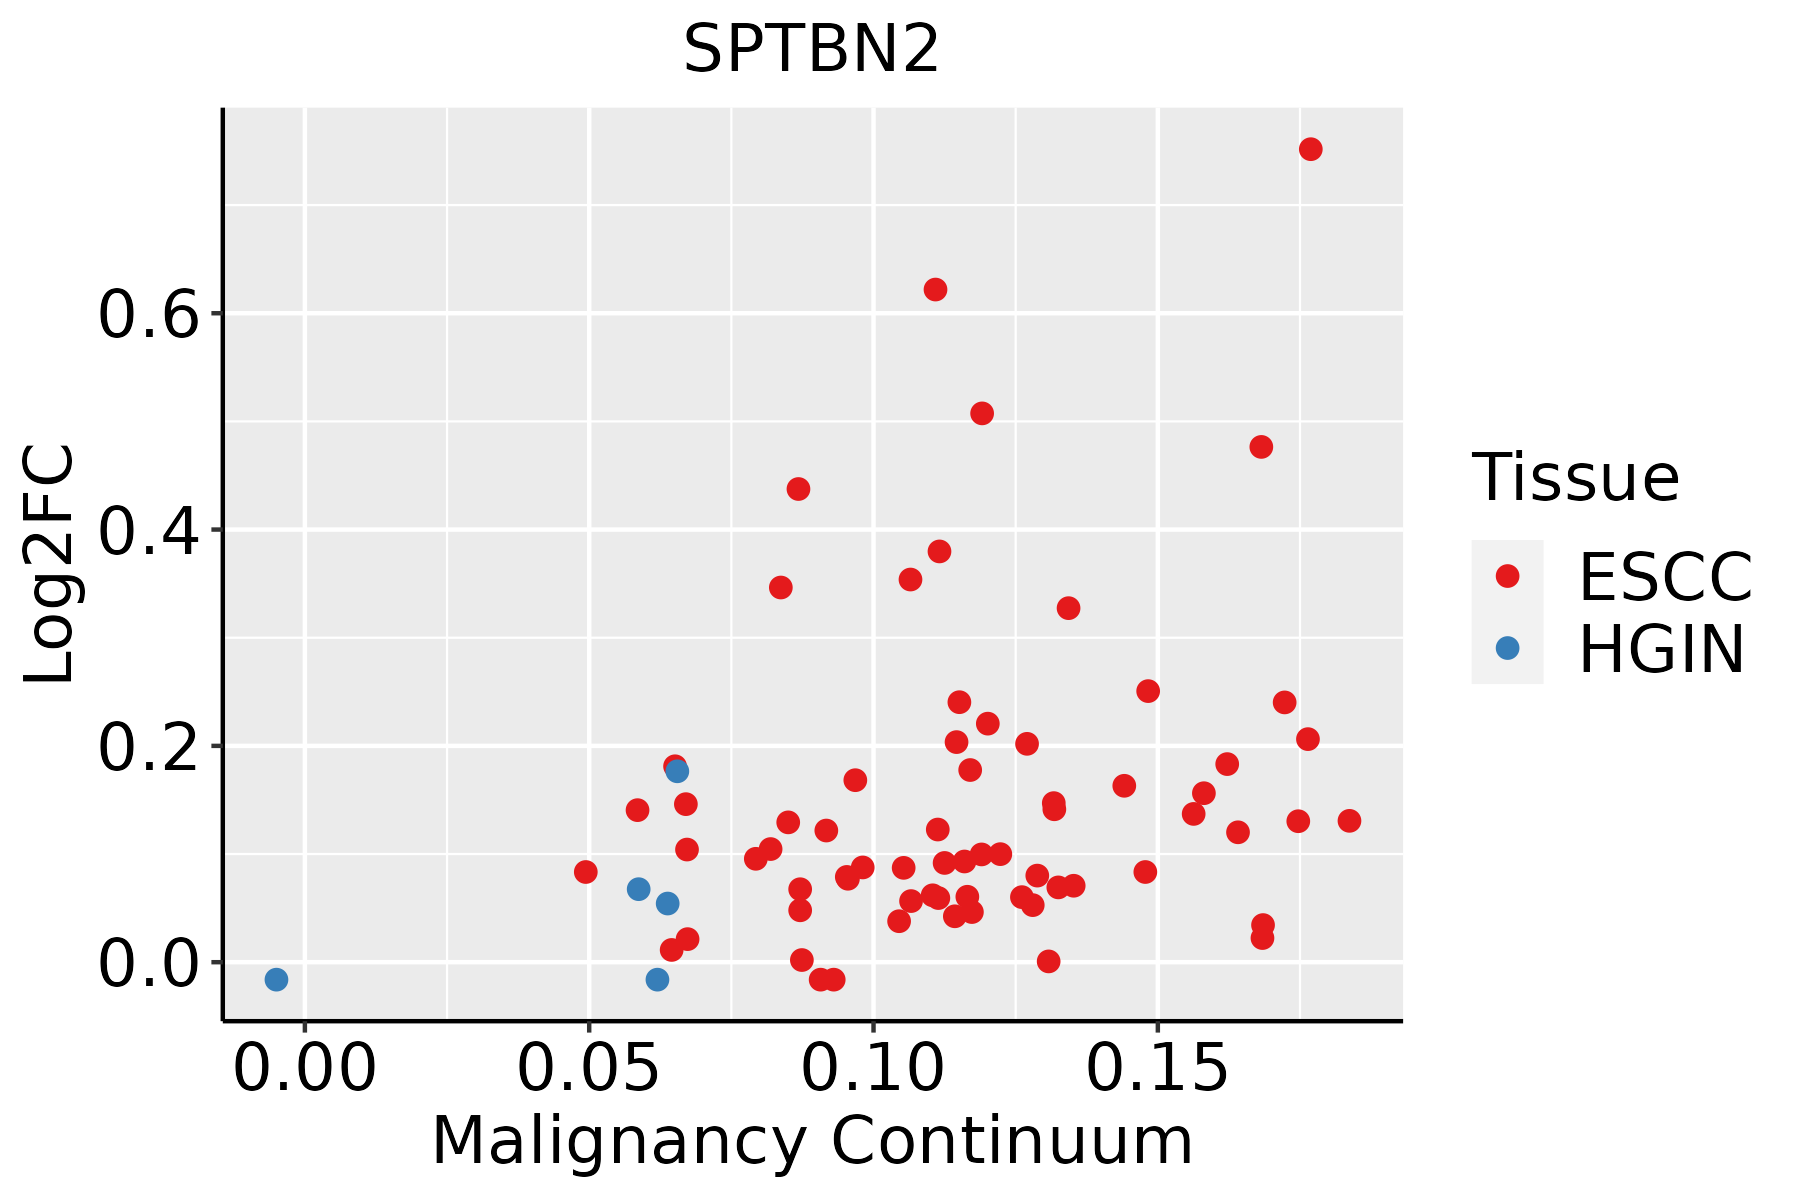 | ESCC: Esophageal squamous cell carcinoma |
| HGIN: High-grade intraepithelial neoplasias | ||
| LGIN: Low-grade intraepithelial neoplasias |
| ∗log2FC in expression of this searched gene in stem-like cells from each diseased tissue sample relative to stem-like cells in normal samples in each tissue plotted against the malignancy continuum. Samples are colored based on if they are from different disease stage. |
Top |
Malignant transformation related pathway analysis |
| Find out the enriched GO biological processes and KEGG pathways involved in transition from healthy to precancer to cancer |
| Tissue | Disease Stage | Enriched GO biological Processes |
| Colorectum | AD |  |
| Colorectum | SER |  |
| Colorectum | MSS |  |
| Colorectum | MSI-H |  |
| Colorectum | FAP |  |
| ∗Top 15 enriched GO BP terms are showed in the bar plot of each disease state in each tissue. Each row represents a significant GO biological process which is colored according to the -log10(p.adjust). |
| Page: 1 2 3 4 5 6 7 8 9 |
| GO ID | Tissue | Disease Stage | Description | Gene Ratio | Bg Ratio | pvalue | p.adjust | Count |
| GO:0022411111 | Esophagus | ESCC | cellular component disassembly | 305/8552 | 443/18723 | 1.94e-23 | 4.57e-21 | 305 |
| GO:0043254111 | Esophagus | ESCC | regulation of protein-containing complex assembly | 278/8552 | 428/18723 | 3.81e-16 | 2.77e-14 | 278 |
| GO:003298416 | Esophagus | ESCC | protein-containing complex disassembly | 151/8552 | 224/18723 | 3.45e-11 | 1.15e-09 | 151 |
| GO:1902903111 | Esophagus | ESCC | regulation of supramolecular fiber organization | 237/8552 | 383/18723 | 9.06e-11 | 2.75e-09 | 237 |
| GO:0010639110 | Esophagus | ESCC | negative regulation of organelle organization | 215/8552 | 348/18723 | 8.20e-10 | 2.01e-08 | 215 |
| GO:0051258111 | Esophagus | ESCC | protein polymerization | 183/8552 | 297/18723 | 1.94e-08 | 3.75e-07 | 183 |
| GO:000701527 | Esophagus | ESCC | actin filament organization | 259/8552 | 442/18723 | 2.37e-08 | 4.50e-07 | 259 |
| GO:003253520 | Esophagus | ESCC | regulation of cellular component size | 227/8552 | 383/18723 | 4.77e-08 | 8.60e-07 | 227 |
| GO:0032970111 | Esophagus | ESCC | regulation of actin filament-based process | 231/8552 | 397/18723 | 2.91e-07 | 4.20e-06 | 231 |
| GO:0032956111 | Esophagus | ESCC | regulation of actin cytoskeleton organization | 210/8552 | 358/18723 | 4.40e-07 | 6.00e-06 | 210 |
| GO:0032271111 | Esophagus | ESCC | regulation of protein polymerization | 143/8552 | 233/18723 | 9.21e-07 | 1.17e-05 | 143 |
| GO:011005327 | Esophagus | ESCC | regulation of actin filament organization | 166/8552 | 278/18723 | 1.54e-06 | 1.85e-05 | 166 |
| GO:000815420 | Esophagus | ESCC | actin polymerization or depolymerization | 130/8552 | 218/18723 | 2.19e-05 | 1.88e-04 | 130 |
| GO:0030041110 | Esophagus | ESCC | actin filament polymerization | 114/8552 | 191/18723 | 6.46e-05 | 4.92e-04 | 114 |
| GO:000806419 | Esophagus | ESCC | regulation of actin polymerization or depolymerization | 112/8552 | 188/18723 | 8.31e-05 | 6.06e-04 | 112 |
| GO:003083218 | Esophagus | ESCC | regulation of actin filament length | 112/8552 | 189/18723 | 1.13e-04 | 7.85e-04 | 112 |
| GO:003083320 | Esophagus | ESCC | regulation of actin filament polymerization | 103/8552 | 172/18723 | 1.19e-04 | 8.15e-04 | 103 |
| GO:0031333110 | Esophagus | ESCC | negative regulation of protein-containing complex assembly | 86/8552 | 141/18723 | 1.74e-04 | 1.14e-03 | 86 |
| GO:00432446 | Esophagus | ESCC | regulation of protein-containing complex disassembly | 75/8552 | 121/18723 | 2.17e-04 | 1.36e-03 | 75 |
| GO:003432918 | Esophagus | ESCC | cell junction assembly | 227/8552 | 420/18723 | 3.06e-04 | 1.83e-03 | 227 |
| Page: 1 2 |
| Pathway ID | Tissue | Disease Stage | Description | Gene Ratio | Bg Ratio | pvalue | p.adjust | qvalue | Count |
| hsa05022210 | Esophagus | ESCC | Pathways of neurodegeneration - multiple diseases | 318/4205 | 476/8465 | 6.10e-15 | 2.04e-13 | 1.05e-13 | 318 |
| hsa0501728 | Esophagus | ESCC | Spinocerebellar ataxia | 94/4205 | 143/8465 | 6.77e-05 | 2.90e-04 | 1.48e-04 | 94 |
| hsa0502238 | Esophagus | ESCC | Pathways of neurodegeneration - multiple diseases | 318/4205 | 476/8465 | 6.10e-15 | 2.04e-13 | 1.05e-13 | 318 |
| hsa0501736 | Esophagus | ESCC | Spinocerebellar ataxia | 94/4205 | 143/8465 | 6.77e-05 | 2.90e-04 | 1.48e-04 | 94 |
| Page: 1 |
Top |
Cell-cell communication analysis |
| Identification of potential cell-cell interactions between two cell types and their ligand-receptor pairs for different disease states |
| Ligand | Receptor | LRpair | Pathway | Tissue | Disease Stage |
| Page: 1 |
Top |
Single-cell gene regulatory network inference analysis |
| Find out the significant the regulons (TFs) and the target genes of each regulon across cell types for different disease states |
| TF | Cell Type | Tissue | Disease Stage | Target Gene | RSS | Regulon Activity |
| ∗The dot plots of a searched regulon are shown for all cell subpopulations in each disease state of each tissue based on the regulon specific score inferred using pySCENIC and by calculating the average expression. |
| Page: 1 |
Top |
Somatic mutation of malignant transformation related genes |
| Annotation of somatic variants for genes involved in malignant transformation |
| Hugo Symbol | Variant Class | Variant Classification | dbSNP RS | HGVSc | HGVSp | HGVSp Short | SWISSPROT | BIOTYPE | SIFT | PolyPhen | Tumor Sample Barcode | Tissue | Histology | Sex | Age | Stage | Therapy Types | Drugs | Outcome |
| SPTBN2 | SNV | Missense_Mutation | novel | c.3797N>A | p.Ala1266Glu | p.A1266E | O15020 | protein_coding | tolerated(0.45) | possibly_damaging(0.506) | TCGA-A2-A4S2-01 | Breast | breast invasive carcinoma | Female | <65 | III/IV | Chemotherapy | adriamycin | CR |
| SPTBN2 | SNV | Missense_Mutation | novel | c.6376A>C | p.Thr2126Pro | p.T2126P | O15020 | protein_coding | tolerated(0.27) | benign(0.007) | TCGA-A7-A26G-01 | Breast | breast invasive carcinoma | Female | <65 | I/II | Chemotherapy | taxotere | SD |
| SPTBN2 | SNV | Missense_Mutation | c.6588N>C | p.Gln2196His | p.Q2196H | O15020 | protein_coding | tolerated(0.12) | benign(0.37) | TCGA-A8-A085-01 | Breast | breast invasive carcinoma | Male | <65 | I/II | Hormone Therapy | tamoxiphen | SD | |
| SPTBN2 | SNV | Missense_Mutation | novel | c.769N>A | p.Glu257Lys | p.E257K | O15020 | protein_coding | deleterious(0) | probably_damaging(0.997) | TCGA-AN-A046-01 | Breast | breast invasive carcinoma | Female | >=65 | I/II | Unknown | Unknown | SD |
| SPTBN2 | SNV | Missense_Mutation | rs754630453 | c.4525N>G | p.Pro1509Ala | p.P1509A | O15020 | protein_coding | tolerated(0.11) | possibly_damaging(0.768) | TCGA-AO-A0J8-01 | Breast | breast invasive carcinoma | Female | <65 | I/II | Chemotherapy | cyclophosphamide | SD |
| SPTBN2 | SNV | Missense_Mutation | rs757828246 | c.6592N>G | p.Arg2198Gly | p.R2198G | O15020 | protein_coding | tolerated(0.19) | benign(0.017) | TCGA-AO-A1KO-01 | Breast | breast invasive carcinoma | Female | <65 | I/II | Chemotherapy | paclitaxel | SD |
| SPTBN2 | SNV | Missense_Mutation | rs754011198 | c.5926N>G | p.Arg1976Gly | p.R1976G | O15020 | protein_coding | deleterious(0.03) | benign(0.368) | TCGA-AO-A1KT-01 | Breast | breast invasive carcinoma | Female | >=65 | I/II | Chemotherapy | fluorouracil | SD |
| SPTBN2 | SNV | Missense_Mutation | rs147422843 | c.1336N>T | p.Arg446Cys | p.R446C | O15020 | protein_coding | deleterious(0) | probably_damaging(0.996) | TCGA-AR-A24H-01 | Breast | breast invasive carcinoma | Female | >=65 | I/II | Hormone Therapy | tamoxiphen | SD |
| SPTBN2 | SNV | Missense_Mutation | rs763501939 | c.4784G>A | p.Arg1595His | p.R1595H | O15020 | protein_coding | deleterious(0.05) | benign(0.013) | TCGA-AR-A24K-01 | Breast | breast invasive carcinoma | Female | <65 | I/II | Unspecific | Paclitaxel | SD |
| SPTBN2 | SNV | Missense_Mutation | novel | c.5954N>T | p.Ser1985Leu | p.S1985L | O15020 | protein_coding | deleterious(0.02) | benign(0.098) | TCGA-B6-A0RE-01 | Breast | breast invasive carcinoma | Female | <65 | I/II | Unknown | Unknown | SD |
| Page: 1 2 3 4 5 6 7 8 9 10 11 12 13 14 15 16 17 18 19 20 21 22 23 24 25 |
Top |
Related drugs of malignant transformation related genes |
| Identification of chemicals and drugs interact with genes involved in malignant transfromation |
| (DGIdb 4.0) |
| Entrez ID | Symbol | Category | Interaction Types | Drug Claim Name | Drug Name | PMIDs |
| Page: 1 |

Copyright 2023-Present -The University of Texas Health Science Center at Houston |