Schematic overview of the cellular and molecular mechanisms involved in the cancer progression, including the proposed cellular and molecular mechanisms in cancer cells trajectory. AT1: alveolar type 1 cells; AT2: alveolar type 2 cells; AAH: atypical adenomatous hyperplasia; AIS: adenocarcinoma in situ; MIA: minimally invasive adenocarcinoma; IA: invasive adenocarcinoma; EMT: epithelial-mesenchymal transition

Home

Download

Statistics

Help

Contact

Center for Computational Systems Medicine
leaf

Gene summary

leaf

Malignant transformation analysis

leaf

Malignant transformation related pathway analysis

leaf

Cell-cell communication analysis

leaf

Single-cell gene regulatory network inference analysis

leaf

Somatic mutation of malignant transformation related genes

leaf

Related drugs of malignant transformation related genes

Gene: SPSB3

Gene summary for SPSB3

check button Gene summary.

Gene informationSpeciesHuman
Gene symbol

SPSB3

Gene ID

90864

Gene namesplA/ryanodine receptor domain and SOCS box containing 3
Gene AliasC16orf31
Cytomap16p13.3
Gene Typeprotein-coding
GO ID

GO:0006464

UniProtAcc

Q6PJ21


Top

Malignant transformation analysis

check button Identification of the aberrant gene expression in precancerous and cancerous lesions by comparing the gene expression of stem-like cells in diseased tissues with normal stem cells
check button Malignant transformation involving gene list.
Entrez IDSymbolReplicatesSpeciesOrganTissueAdj P-valueLog2FCMalignancy
90864SPSB3LZE4THumanEsophagusESCC8.90e-173.34e-010.0811
90864SPSB3LZE7THumanEsophagusESCC2.13e-181.12e+000.0667
90864SPSB3LZE8THumanEsophagusESCC1.90e-144.21e-010.067
90864SPSB3LZE20THumanEsophagusESCC5.90e-145.55e-010.0662
90864SPSB3LZE22D1HumanEsophagusHGIN3.44e-065.94e-010.0595
90864SPSB3LZE22THumanEsophagusESCC1.09e-047.57e-010.068
90864SPSB3LZE24THumanEsophagusESCC5.48e-351.14e+000.0596
90864SPSB3LZE21THumanEsophagusESCC3.25e-043.94e-010.0655
90864SPSB3LZE6THumanEsophagusESCC1.59e-072.79e-010.0845
90864SPSB3P1T-EHumanEsophagusESCC8.74e-251.21e+000.0875
90864SPSB3P2T-EHumanEsophagusESCC1.07e-661.20e+000.1177
90864SPSB3P4T-EHumanEsophagusESCC4.60e-358.79e-010.1323
90864SPSB3P5T-EHumanEsophagusESCC3.58e-183.05e-010.1327
90864SPSB3P8T-EHumanEsophagusESCC6.68e-539.60e-010.0889
90864SPSB3P9T-EHumanEsophagusESCC8.73e-143.80e-010.1131
90864SPSB3P10T-EHumanEsophagusESCC1.97e-346.91e-010.116
90864SPSB3P11T-EHumanEsophagusESCC5.16e-259.67e-010.1426
90864SPSB3P12T-EHumanEsophagusESCC1.37e-591.26e+000.1122
90864SPSB3P15T-EHumanEsophagusESCC2.88e-388.47e-010.1149
90864SPSB3P16T-EHumanEsophagusESCC5.25e-285.55e-010.1153
Page: 1 2 3 4 5 6 7 

check button Transcriptomic changes along malignancy continuum.
TissueExpression DynamicsAbbreviation
EsophagusThe image shows the transcriptomic changes along malignancy continuum.log2FC in expression of this searched gene in stem-like cells from each diseased tissue sample relative to stem-like cells in normal samples in each tissue plotted against the malignancy continuum. Samples are colored based on if they are from different disease stage.ESCC: Esophageal squamous cell carcinoma
HGIN: High-grade intraepithelial neoplasias
LGIN: Low-grade intraepithelial neoplasias
LiverThe image shows the transcriptomic changes along malignancy continuum.log2FC in expression of this searched gene in stem-like cells from each diseased tissue sample relative to stem-like cells in normal samples in each tissue plotted against the malignancy continuum. Samples are colored based on if they are from different disease stage.
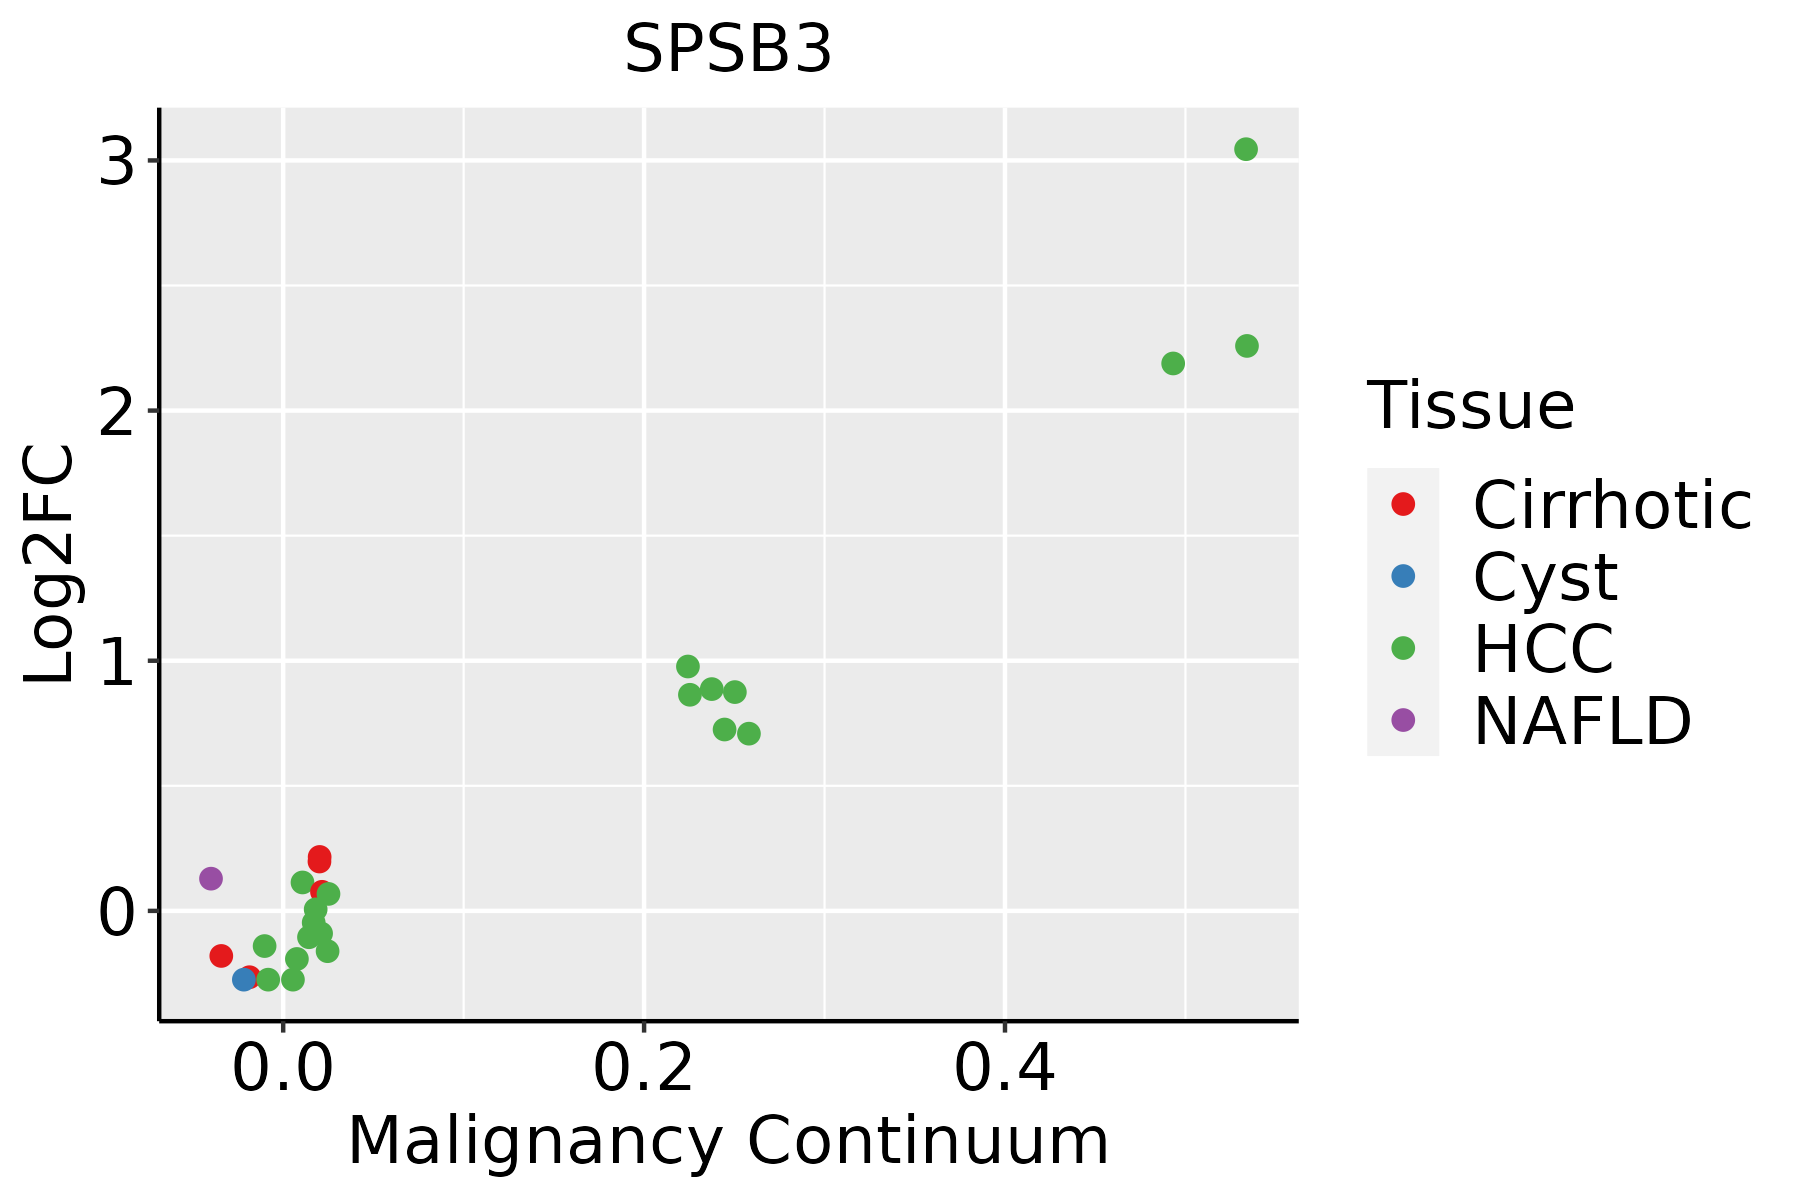
HCC: Hepatocellular carcinoma
NAFLD: Non-alcoholic fatty liver disease
Oral CavityThe image shows the transcriptomic changes along malignancy continuum.log2FC in expression of this searched gene in stem-like cells from each diseased tissue sample relative to stem-like cells in normal samples in each tissue plotted against the malignancy continuum. Samples are colored based on if they are from different disease stage.
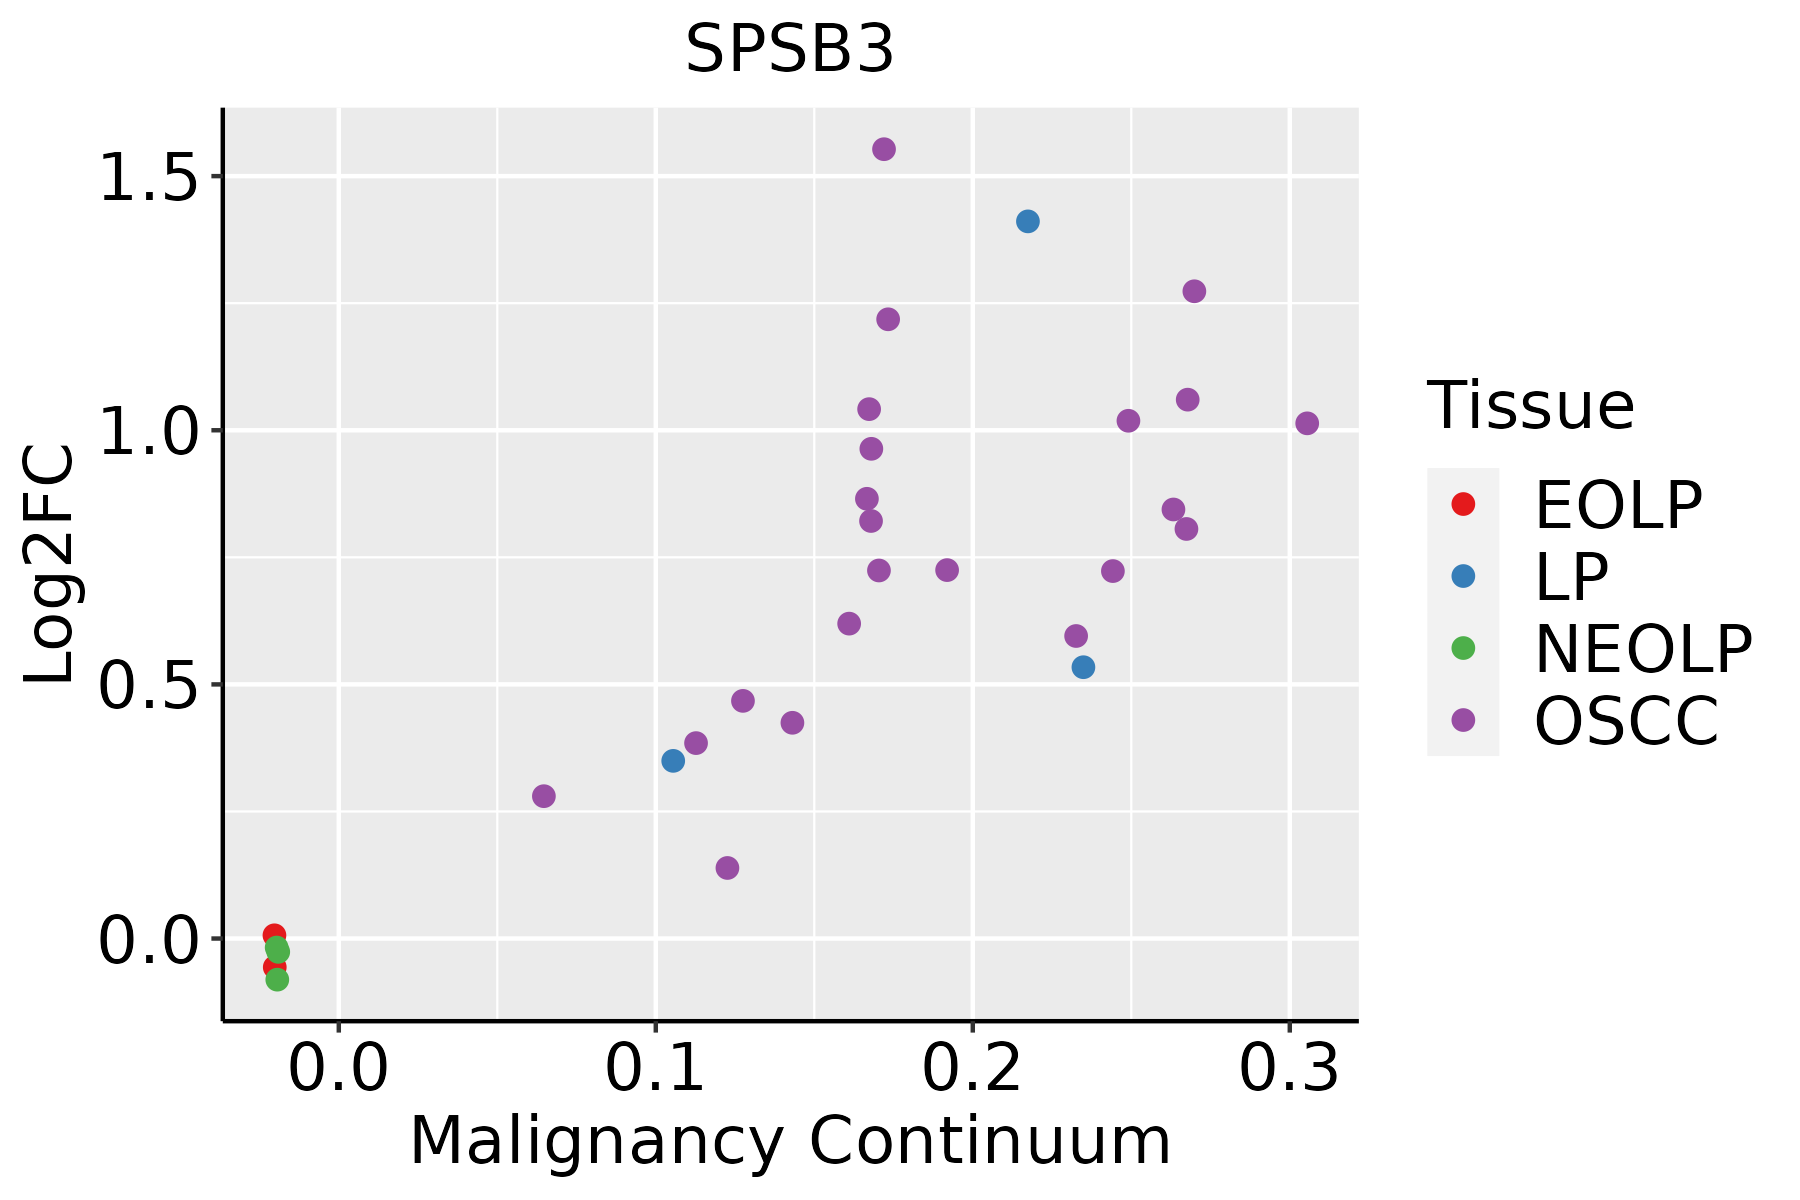
EOLP: Erosive Oral lichen planus
LP: leukoplakia
NEOLP: Non-erosive oral lichen planus
OSCC: Oral squamous cell carcinoma
SkinThe image shows the transcriptomic changes along malignancy continuum.log2FC in expression of this searched gene in stem-like cells from each diseased tissue sample relative to stem-like cells in normal samples in each tissue plotted against the malignancy continuum. Samples are colored based on if they are from different disease stage.
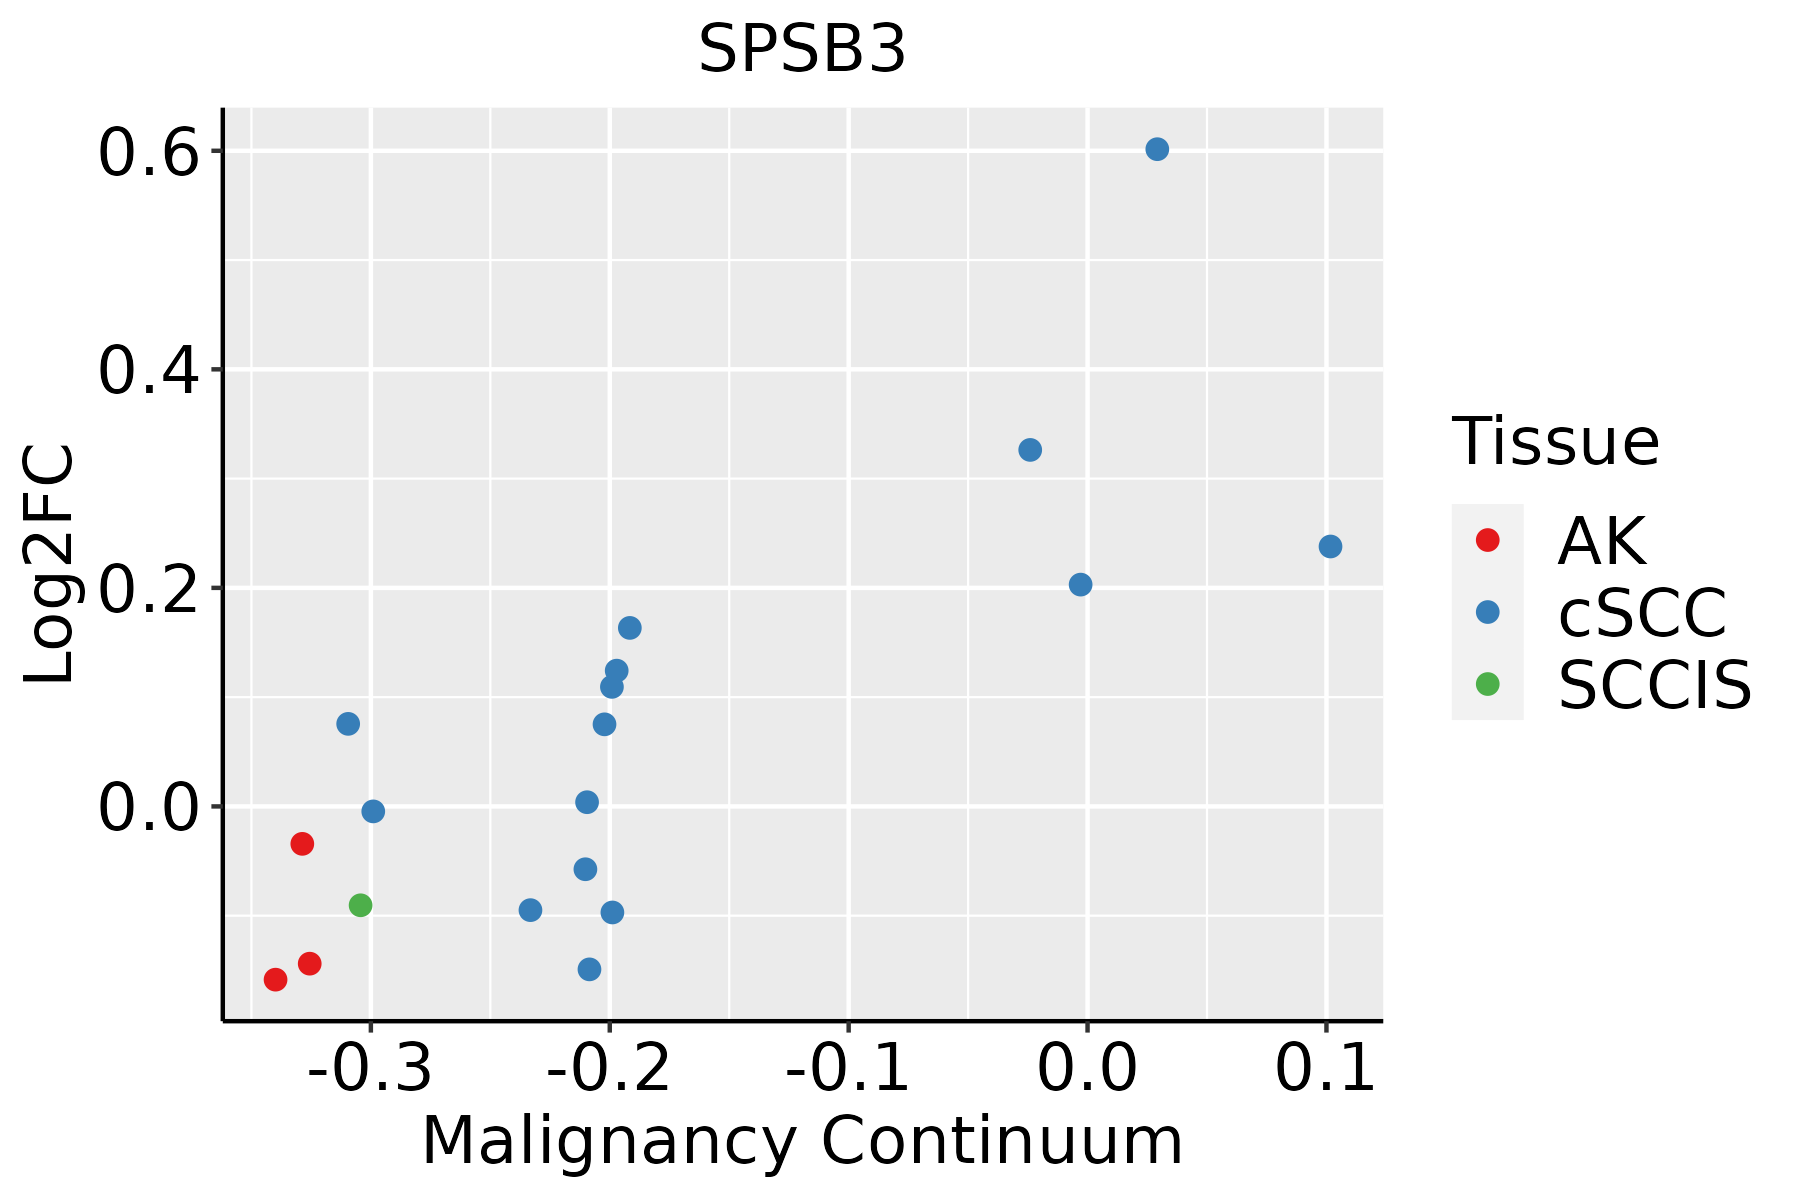
AK: Actinic keratosis
cSCC: Cutaneous squamous cell carcinoma
SCCIS:squamous cell carcinoma in situ
ThyroidThe image shows the transcriptomic changes along malignancy continuum.log2FC in expression of this searched gene in stem-like cells from each diseased tissue sample relative to stem-like cells in normal samples in each tissue plotted against the malignancy continuum. Samples are colored based on if they are from different disease stage.
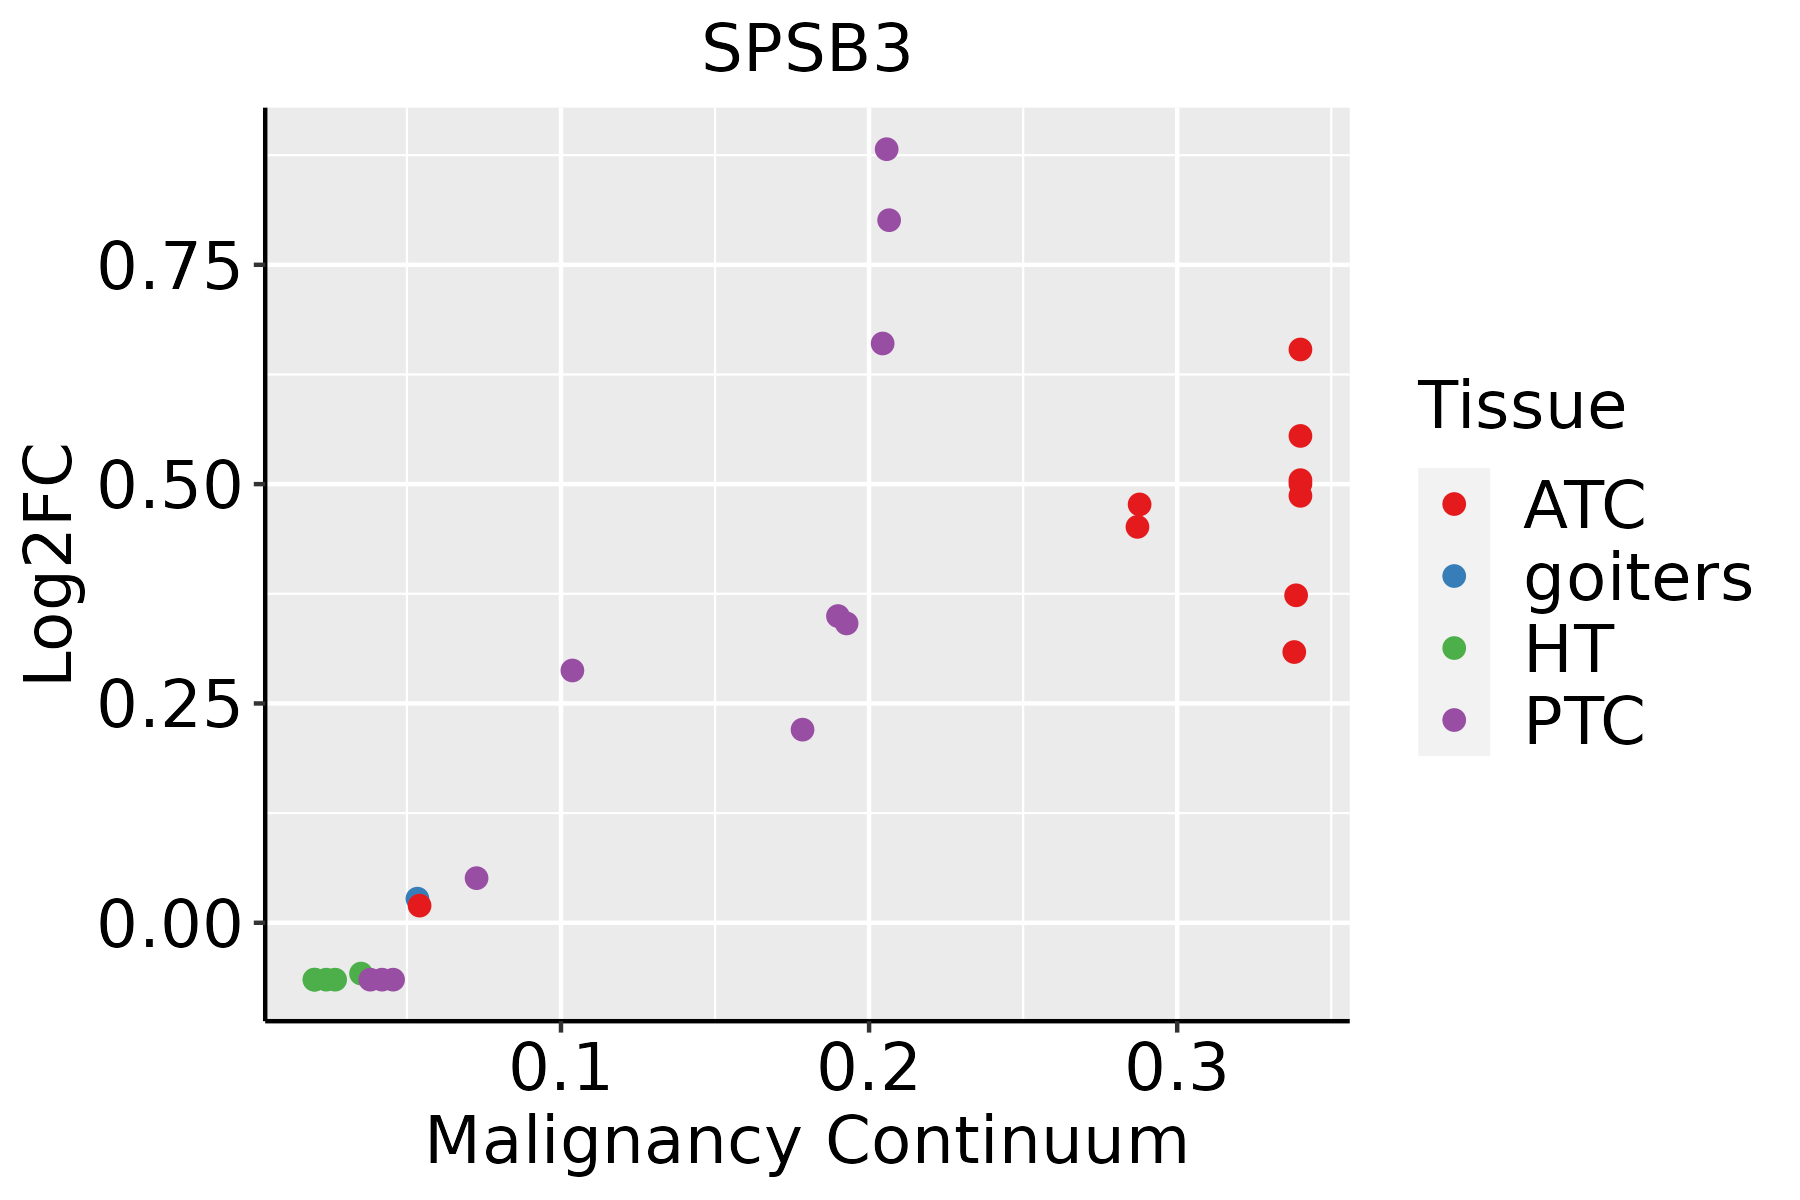
ATC: Anaplastic thyroid cancer
HT: Hashimoto's thyroiditis
PTC: Papillary thyroid cancer
∗log2FC in expression of this searched gene in stem-like cells from each diseased tissue sample relative to stem-like cells in normal samples in each tissue plotted against the malignancy continuum. Samples are colored based on if they are from different disease stage.

Top

Malignant transformation related pathway analysis

check buttonFind out the enriched GO biological processes and KEGG pathways involved in transition from healthy to precancer to cancer
check button Figure of enriched GO biological processes.
TissueDisease StageEnriched GO biological Processes
ColorectumADGO analysis - Figure of enriched GO biological processes: Top 15 enriched GO BP terms are showed in the bar plot of each disease state in each tissue. Each row represents a significant GO biological process which is colored according to the -log10(p.adjust).
ColorectumSERGO analysis - Figure of enriched GO biological processes: Top 15 enriched GO BP terms are showed in the bar plot of each disease state in each tissue. Each row represents a significant GO biological process which is colored according to the -log10(p.adjust).
ColorectumMSSGO analysis - Figure of enriched GO biological processes: Top 15 enriched GO BP terms are showed in the bar plot of each disease state in each tissue. Each row represents a significant GO biological process which is colored according to the -log10(p.adjust).
ColorectumMSI-HGO analysis - Figure of enriched GO biological processes: Top 15 enriched GO BP terms are showed in the bar plot of each disease state in each tissue. Each row represents a significant GO biological process which is colored according to the -log10(p.adjust).
ColorectumFAPGO analysis - Figure of enriched GO biological processes: Top 15 enriched GO BP terms are showed in the bar plot of each disease state in each tissue. Each row represents a significant GO biological process which is colored according to the -log10(p.adjust).
∗Top 15 enriched GO BP terms are showed in the bar plot of each disease state in each tissue. Each row represents a significant GO biological process which is colored according to the -log10(p.adjust).
Page: 1 2 3 4 5 6 7 8 9 

check button Enriched GO biological processes.
GO IDTissueDisease StageDescriptionGene RatioBg Ratiopvaluep.adjustCount
GO:001049826EsophagusHGINproteasomal protein catabolic process139/2587490/187231.20e-173.41e-15139
GO:004316126EsophagusHGINproteasome-mediated ubiquitin-dependent protein catabolic process114/2587412/187237.00e-141.20e-11114
GO:0010498111EsophagusESCCproteasomal protein catabolic process369/8552490/187231.13e-411.80e-38369
GO:0043161111EsophagusESCCproteasome-mediated ubiquitin-dependent protein catabolic process312/8552412/187233.53e-364.48e-33312
GO:001049812LiverCirrhoticproteasomal protein catabolic process216/4634490/187232.52e-219.29e-19216
GO:004316112LiverCirrhoticproteasome-mediated ubiquitin-dependent protein catabolic process184/4634412/187234.52e-198.85e-17184
GO:001049822LiverHCCproteasomal protein catabolic process351/7958490/187236.92e-401.46e-36351
GO:004316122LiverHCCproteasome-mediated ubiquitin-dependent protein catabolic process299/7958412/187237.82e-368.27e-33299
GO:001049820Oral cavityOSCCproteasomal protein catabolic process336/7305490/187235.45e-418.63e-38336
GO:004316120Oral cavityOSCCproteasome-mediated ubiquitin-dependent protein catabolic process285/7305412/187235.68e-365.99e-33285
GO:0010498110Oral cavityLPproteasomal protein catabolic process224/4623490/187239.57e-254.00e-22224
GO:0043161110Oral cavityLPproteasome-mediated ubiquitin-dependent protein catabolic process190/4623412/187231.08e-212.93e-19190
GO:001049828SkincSCCproteasomal protein catabolic process243/4864490/187237.85e-304.10e-27243
GO:004316128SkincSCCproteasome-mediated ubiquitin-dependent protein catabolic process205/4864412/187231.46e-254.16e-23205
GO:0010498113ThyroidPTCproteasomal protein catabolic process297/5968490/187234.58e-409.63e-37297
GO:0043161113ThyroidPTCproteasome-mediated ubiquitin-dependent protein catabolic process254/5968412/187233.91e-364.54e-33254
GO:001049832ThyroidATCproteasomal protein catabolic process309/6293490/187231.78e-411.13e-37309
GO:0043161210ThyroidATCproteasome-mediated ubiquitin-dependent protein catabolic process265/6293412/187237.09e-381.49e-34265
Page: 1 

check button Enriched KEGG pathways.
Pathway IDTissueDisease StageDescriptionGene RatioBg Ratiopvaluep.adjustqvalueCount
Page: 1 

Top

Cell-cell communication analysis

check buttonIdentification of potential cell-cell interactions between two cell types and their ligand-receptor pairs for different disease states
LigandReceptorLRpairPathwayTissueDisease Stage
Page: 1 

Top

Single-cell gene regulatory network inference analysis

check buttonFind out the significant the regulons (TFs) and the target genes of each regulon across cell types for different disease states
TFCell TypeTissueDisease StageTarget GeneRSSRegulon Activity
∗The dot plots of a searched regulon are shown for all cell subpopulations in each disease state of each tissue based on the regulon specific score inferred using pySCENIC and by calculating the average expression.
Page: 1 

Top

Somatic mutation of malignant transformation related genes

check buttonAnnotation of somatic variants for genes involved in malignant transformation
Hugo SymbolVariant ClassVariant ClassificationdbSNP RSHGVScHGVSpHGVSp ShortSWISSPROTBIOTYPESIFTPolyPhenTumor Sample BarcodeTissueHistologySexAgeStageTherapy TypesDrugsOutcome
SPSB3SNVMissense_Mutationnovelc.992C>Tp.Pro331Leup.P331LQ6PJ21protein_codingdeleterious(0.03)benign(0.003)TCGA-A7-A0DB-01Breastbreast invasive carcinomaFemale<65I/IIHormone TherapyarimidexSD
SPSB3SNVMissense_Mutationc.103T>Ap.Trp35Argp.W35RQ6PJ21protein_codingdeleterious_low_confidence(0.04)probably_damaging(0.997)TCGA-AR-A24X-01Breastbreast invasive carcinomaFemale<65I/IIHormone TherapytamoxiphenSD
SPSB3SNVMissense_Mutationrs767649831c.637N>Tp.Arg213Trpp.R213WQ6PJ21protein_codingdeleterious(0)probably_damaging(0.996)TCGA-E9-A5UP-01Breastbreast invasive carcinomaFemale<65I/IIHormone TherapytamoxiphenSD
SPSB3SNVMissense_Mutationnovelc.95N>Ap.Ser32Tyrp.S32YQ6PJ21protein_codingdeleterious_low_confidence(0.02)benign(0.133)TCGA-S3-AA11-01Breastbreast invasive carcinomaFemale>=65I/IIHormone TherapyletrozoleCR
SPSB3SNVMissense_Mutationnovelc.74N>Tp.Arg25Leup.R25LQ6PJ21protein_codingtolerated_low_confidence(0.23)benign(0.253)TCGA-C5-A1MH-01Cervixcervical & endocervical cancerFemale>=65III/IVChemotherapycisplatinPD
SPSB3SNVMissense_Mutationnovelc.391N>Cp.Tyr131Hisp.Y131HQ6PJ21protein_codingdeleterious(0.04)probably_damaging(0.999)TCGA-AA-3663-01Colorectumcolon adenocarcinomaMale<65I/IIUnknownUnknownSD
SPSB3SNVMissense_Mutationrs771186190c.1034N>Ap.Arg345Glnp.R345QQ6PJ21protein_codingtolerated_low_confidence(0.24)benign(0.017)TCGA-A5-A1OF-01Endometriumuterine corpus endometrioid carcinomaFemale<65I/IIUnknownUnknownSD
SPSB3SNVMissense_Mutationrs756665663c.64G>Ap.Ala22Thrp.A22TQ6PJ21protein_codingtolerated_low_confidence(0.46)benign(0.003)TCGA-AP-A1DK-01Endometriumuterine corpus endometrioid carcinomaFemale<65I/IIUnknownUnknownSD
SPSB3SNVMissense_Mutationnovelc.560G>Ap.Gly187Aspp.G187DQ6PJ21protein_codingdeleterious(0)probably_damaging(1)TCGA-AP-A1DR-01Endometriumuterine corpus endometrioid carcinomaFemale<65III/IVChemotherapycisplatinSD
SPSB3SNVMissense_Mutationrs530459268c.269N>Ap.Arg90Glnp.R90QQ6PJ21protein_codingtolerated(0.36)benign(0.007)TCGA-AX-A2HD-01Endometriumuterine corpus endometrioid carcinomaFemale>=65III/IVUnknownUnknownSD
Page: 1 2 3 4 

Top

Related drugs of malignant transformation related genes

check buttonIdentification of chemicals and drugs interact with genes involved in malignant transfromation
(DGIdb 4.0)
Entrez IDSymbolCategoryInteraction TypesDrug Claim NameDrug NamePMIDs
Page: 1