
|
|||||
|
 | |
| |
| |
| |
| |
| |
|
Gene: SPSB2 |
Gene summary for SPSB2 |
| Gene information | Species | Human | Gene symbol | SPSB2 | Gene ID | 84727 |
| Gene name | splA/ryanodine receptor domain and SOCS box containing 2 | |
| Gene Alias | GRCC9 | |
| Cytomap | 12p13.31 | |
| Gene Type | protein-coding | GO ID | GO:0006464 | UniProtAcc | Q99619 |
Top |
Malignant transformation analysis |
| Identification of the aberrant gene expression in precancerous and cancerous lesions by comparing the gene expression of stem-like cells in diseased tissues with normal stem cells |
| Entrez ID | Symbol | Replicates | Species | Organ | Tissue | Adj P-value | Log2FC | Malignancy |
| 84727 | SPSB2 | HCC1_Meng | Human | Liver | HCC | 7.88e-18 | 4.88e-02 | 0.0246 |
| 84727 | SPSB2 | HCC2_Meng | Human | Liver | HCC | 3.94e-18 | 1.63e-01 | 0.0107 |
| 84727 | SPSB2 | S014 | Human | Liver | HCC | 1.18e-16 | 5.68e-01 | 0.2254 |
| 84727 | SPSB2 | S015 | Human | Liver | HCC | 8.80e-16 | 5.76e-01 | 0.2375 |
| 84727 | SPSB2 | S016 | Human | Liver | HCC | 6.60e-11 | 3.78e-01 | 0.2243 |
| 84727 | SPSB2 | S028 | Human | Liver | HCC | 1.36e-02 | 2.26e-01 | 0.2503 |
| 84727 | SPSB2 | S029 | Human | Liver | HCC | 2.14e-03 | 2.78e-01 | 0.2581 |
| 84727 | SPSB2 | C04 | Human | Oral cavity | OSCC | 1.16e-03 | 3.15e-01 | 0.2633 |
| 84727 | SPSB2 | C21 | Human | Oral cavity | OSCC | 2.37e-20 | 5.84e-01 | 0.2678 |
| 84727 | SPSB2 | C30 | Human | Oral cavity | OSCC | 3.87e-24 | 1.01e+00 | 0.3055 |
| 84727 | SPSB2 | C38 | Human | Oral cavity | OSCC | 1.66e-08 | 6.72e-01 | 0.172 |
| 84727 | SPSB2 | C46 | Human | Oral cavity | OSCC | 2.37e-11 | 3.23e-01 | 0.1673 |
| 84727 | SPSB2 | C08 | Human | Oral cavity | OSCC | 2.06e-32 | 6.67e-01 | 0.1919 |
| 84727 | SPSB2 | LN38 | Human | Oral cavity | OSCC | 4.65e-06 | 7.69e-01 | 0.168 |
| 84727 | SPSB2 | LP15 | Human | Oral cavity | LP | 4.71e-06 | 5.83e-01 | 0.2174 |
| 84727 | SPSB2 | SYSMH2 | Human | Oral cavity | OSCC | 3.81e-04 | 2.22e-01 | 0.2326 |
| 84727 | SPSB2 | SYSMH6 | Human | Oral cavity | OSCC | 4.83e-02 | 1.36e-01 | 0.1275 |
| Page: 1 |
| Tissue | Expression Dynamics | Abbreviation |
| Liver |  | HCC: Hepatocellular carcinoma |
| NAFLD: Non-alcoholic fatty liver disease | ||
| Oral Cavity | 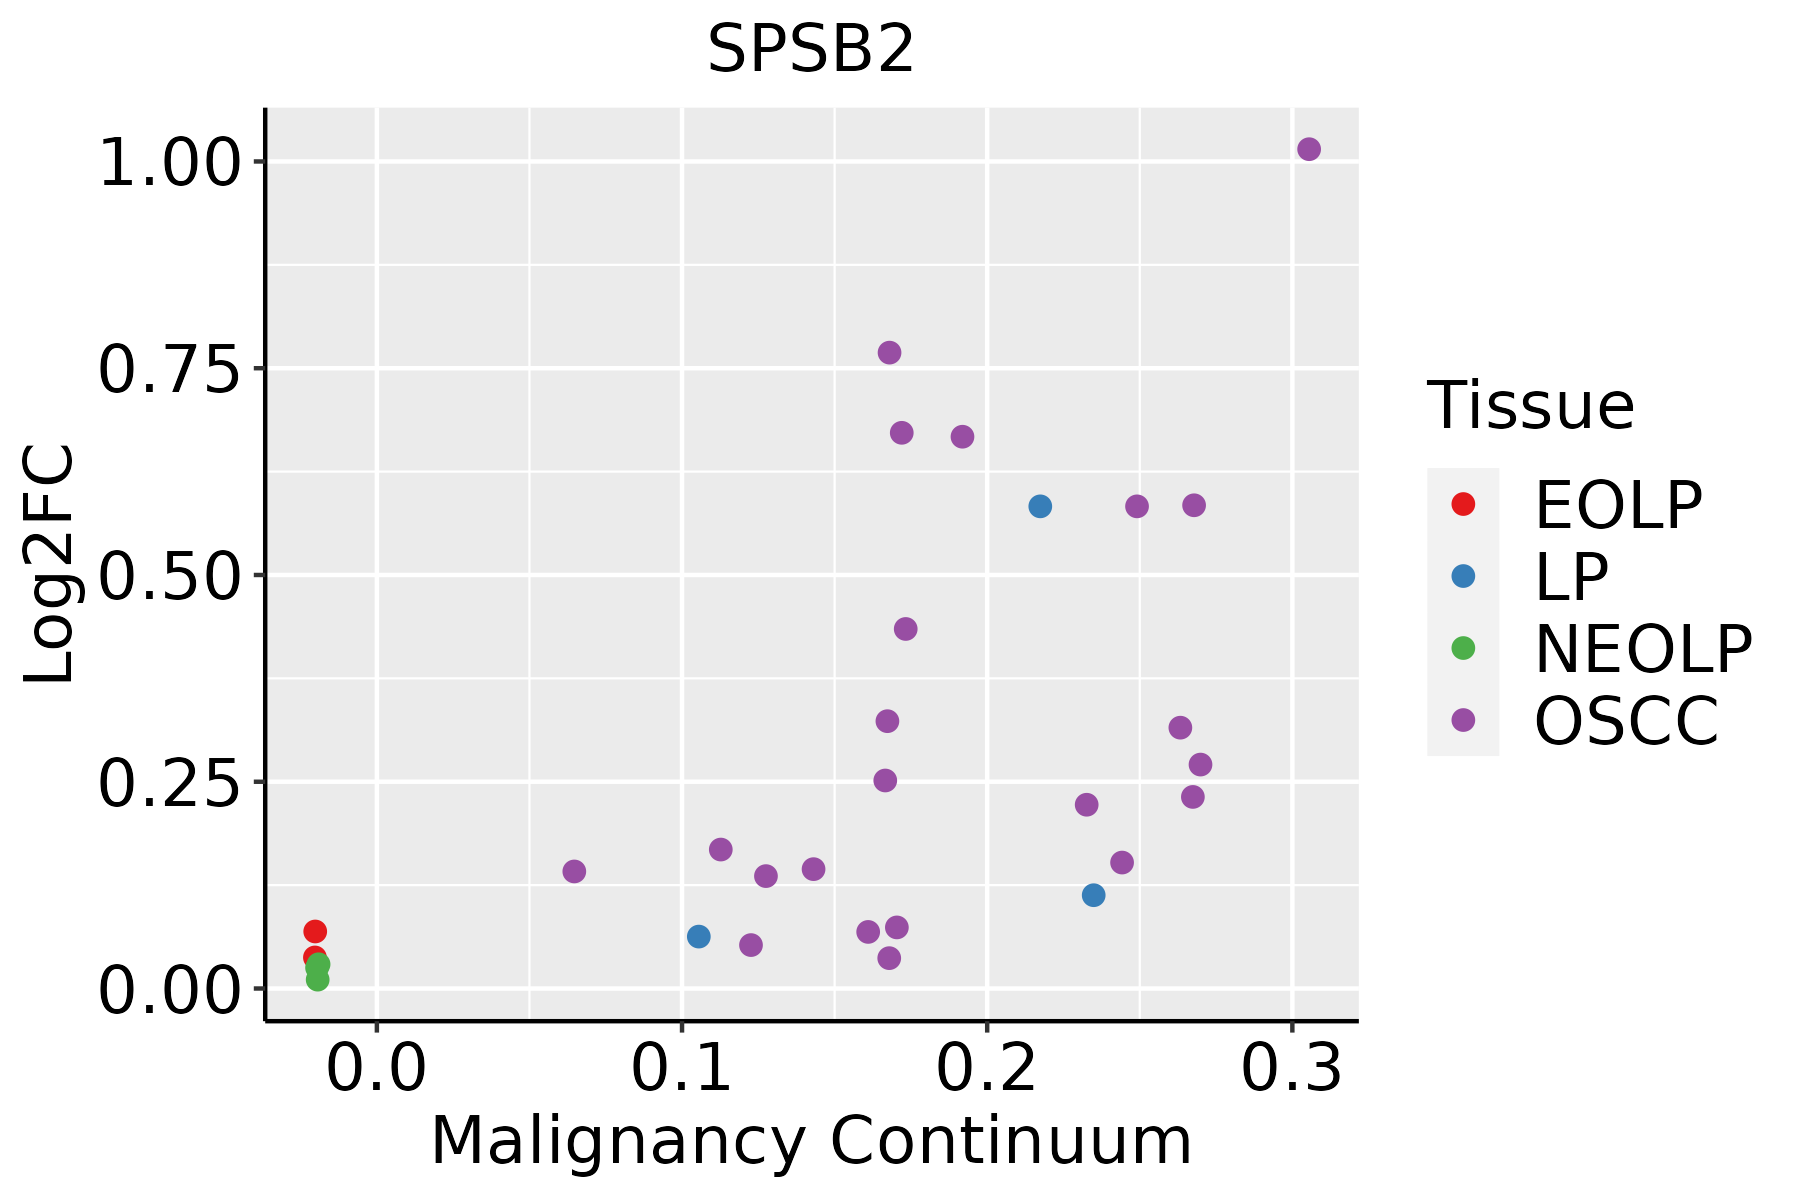 | EOLP: Erosive Oral lichen planus |
| LP: leukoplakia | ||
| NEOLP: Non-erosive oral lichen planus | ||
| OSCC: Oral squamous cell carcinoma |
| ∗log2FC in expression of this searched gene in stem-like cells from each diseased tissue sample relative to stem-like cells in normal samples in each tissue plotted against the malignancy continuum. Samples are colored based on if they are from different disease stage. |
Top |
Malignant transformation related pathway analysis |
| Find out the enriched GO biological processes and KEGG pathways involved in transition from healthy to precancer to cancer |
| Tissue | Disease Stage | Enriched GO biological Processes |
| Colorectum | AD |  |
| Colorectum | SER |  |
| Colorectum | MSS |  |
| Colorectum | MSI-H |  |
| Colorectum | FAP |  |
| ∗Top 15 enriched GO BP terms are showed in the bar plot of each disease state in each tissue. Each row represents a significant GO biological process which is colored according to the -log10(p.adjust). |
| Page: 1 2 3 4 5 6 7 8 9 |
| GO ID | Tissue | Disease Stage | Description | Gene Ratio | Bg Ratio | pvalue | p.adjust | Count |
| GO:001049822 | Liver | HCC | proteasomal protein catabolic process | 351/7958 | 490/18723 | 6.92e-40 | 1.46e-36 | 351 |
| GO:004316122 | Liver | HCC | proteasome-mediated ubiquitin-dependent protein catabolic process | 299/7958 | 412/18723 | 7.82e-36 | 8.27e-33 | 299 |
| GO:001049820 | Oral cavity | OSCC | proteasomal protein catabolic process | 336/7305 | 490/18723 | 5.45e-41 | 8.63e-38 | 336 |
| GO:004316120 | Oral cavity | OSCC | proteasome-mediated ubiquitin-dependent protein catabolic process | 285/7305 | 412/18723 | 5.68e-36 | 5.99e-33 | 285 |
| GO:0010498110 | Oral cavity | LP | proteasomal protein catabolic process | 224/4623 | 490/18723 | 9.57e-25 | 4.00e-22 | 224 |
| GO:0043161110 | Oral cavity | LP | proteasome-mediated ubiquitin-dependent protein catabolic process | 190/4623 | 412/18723 | 1.08e-21 | 2.93e-19 | 190 |
| Page: 1 |
| Pathway ID | Tissue | Disease Stage | Description | Gene Ratio | Bg Ratio | pvalue | p.adjust | qvalue | Count |
| Page: 1 |
Top |
Cell-cell communication analysis |
| Identification of potential cell-cell interactions between two cell types and their ligand-receptor pairs for different disease states |
| Ligand | Receptor | LRpair | Pathway | Tissue | Disease Stage |
| Page: 1 |
Top |
Single-cell gene regulatory network inference analysis |
| Find out the significant the regulons (TFs) and the target genes of each regulon across cell types for different disease states |
| TF | Cell Type | Tissue | Disease Stage | Target Gene | RSS | Regulon Activity |
| ∗The dot plots of a searched regulon are shown for all cell subpopulations in each disease state of each tissue based on the regulon specific score inferred using pySCENIC and by calculating the average expression. |
| Page: 1 |
Top |
Somatic mutation of malignant transformation related genes |
| Annotation of somatic variants for genes involved in malignant transformation |
| Hugo Symbol | Variant Class | Variant Classification | dbSNP RS | HGVSc | HGVSp | HGVSp Short | SWISSPROT | BIOTYPE | SIFT | PolyPhen | Tumor Sample Barcode | Tissue | Histology | Sex | Age | Stage | Therapy Types | Drugs | Outcome |
| SPSB2 | SNV | Missense_Mutation | c.491C>G | p.Pro164Arg | p.P164R | Q99619 | protein_coding | deleterious(0) | probably_damaging(0.962) | TCGA-A2-A0T5-01 | Breast | breast invasive carcinoma | Female | <65 | I/II | Unspecific | Taxotere | SD | |
| SPSB2 | SNV | Missense_Mutation | novel | c.613N>A | p.Ala205Thr | p.A205T | Q99619 | protein_coding | tolerated(0.09) | probably_damaging(0.997) | TCGA-2W-A8YY-01 | Cervix | cervical & endocervical cancer | Female | <65 | I/II | Chemotherapy | cisplatin | CR |
| SPSB2 | SNV | Missense_Mutation | c.660N>C | p.Arg220Ser | p.R220S | Q99619 | protein_coding | deleterious(0.01) | possibly_damaging(0.654) | TCGA-EK-A2PG-01 | Cervix | cervical & endocervical cancer | Female | >=65 | I/II | Unknown | Unknown | SD | |
| SPSB2 | SNV | Missense_Mutation | rs369645281 | c.322N>A | p.Val108Met | p.V108M | Q99619 | protein_coding | deleterious(0) | probably_damaging(0.999) | TCGA-EK-A2PG-01 | Cervix | cervical & endocervical cancer | Female | >=65 | I/II | Unknown | Unknown | SD |
| SPSB2 | SNV | Missense_Mutation | c.385N>A | p.Glu129Lys | p.E129K | Q99619 | protein_coding | deleterious(0.05) | benign(0.122) | TCGA-IR-A3LI-01 | Cervix | cervical & endocervical cancer | Female | <65 | I/II | Chemotherapy | cisplatin | CR | |
| SPSB2 | SNV | Missense_Mutation | c.385N>A | p.Glu129Lys | p.E129K | Q99619 | protein_coding | deleterious(0.05) | benign(0.122) | TCGA-VS-A8EC-01 | Cervix | cervical & endocervical cancer | Female | <65 | III/IV | Chemotherapy | carboplatin | CR | |
| SPSB2 | SNV | Missense_Mutation | novel | c.532N>A | p.Leu178Met | p.L178M | Q99619 | protein_coding | tolerated(0.13) | probably_damaging(0.981) | TCGA-AJ-A8CW-01 | Endometrium | uterine corpus endometrioid carcinoma | Female | <65 | I/II | Unknown | Unknown | SD |
| SPSB2 | SNV | Missense_Mutation | rs781906850 | c.773N>A | p.Arg258His | p.R258H | Q99619 | protein_coding | tolerated(0.19) | benign(0.001) | TCGA-B5-A11H-01 | Endometrium | uterine corpus endometrioid carcinoma | Female | >=65 | III/IV | Hormone Therapy | megace | SD |
| SPSB2 | SNV | Missense_Mutation | novel | c.307N>T | p.His103Tyr | p.H103Y | Q99619 | protein_coding | deleterious(0.03) | benign(0.007) | TCGA-B5-A3FC-01 | Endometrium | uterine corpus endometrioid carcinoma | Female | <65 | I/II | Unknown | Unknown | SD |
| SPSB2 | SNV | Missense_Mutation | novel | c.563N>A | p.Gly188Glu | p.G188E | Q99619 | protein_coding | deleterious(0) | probably_damaging(1) | TCGA-EO-A22U-01 | Endometrium | uterine corpus endometrioid carcinoma | Female | >=65 | I/II | Unknown | Unknown | SD |
| Page: 1 2 |
Top |
Related drugs of malignant transformation related genes |
| Identification of chemicals and drugs interact with genes involved in malignant transfromation |
| (DGIdb 4.0) |
| Entrez ID | Symbol | Category | Interaction Types | Drug Claim Name | Drug Name | PMIDs |
| 84727 | SPSB2 | DRUGGABLE GENOME, B30_2 SPRY DOMAIN | PHENYLTHIAZOL-2-AMINE | CHEMBL175296 | 25559643 | |
| 84727 | SPSB2 | DRUGGABLE GENOME, B30_2 SPRY DOMAIN | methylphenidate | METHYLPHENIDATE | 29382897 |
| Page: 1 |

Copyright 2023-Present -The University of Texas Health Science Center at Houston |