
|
|||||
|
 | |
| |
| |
| |
| |
| |
|
Gene: SPRY1 |
Gene summary for SPRY1 |
| Gene information | Species | Human | Gene symbol | SPRY1 | Gene ID | 10252 |
| Gene name | sprouty RTK signaling antagonist 1 | |
| Gene Alias | hSPRY1 | |
| Cytomap | 4q28.1 | |
| Gene Type | protein-coding | GO ID | GO:0000132 | UniProtAcc | O43609 |
Top |
Malignant transformation analysis |
| Identification of the aberrant gene expression in precancerous and cancerous lesions by comparing the gene expression of stem-like cells in diseased tissues with normal stem cells |
| Entrez ID | Symbol | Replicates | Species | Organ | Tissue | Adj P-value | Log2FC | Malignancy |
| 10252 | SPRY1 | P2T-E | Human | Esophagus | ESCC | 1.76e-03 | 9.17e-02 | 0.1177 |
| 10252 | SPRY1 | P4T-E | Human | Esophagus | ESCC | 2.13e-05 | 6.44e-02 | 0.1323 |
| 10252 | SPRY1 | P8T-E | Human | Esophagus | ESCC | 1.60e-18 | 5.60e-01 | 0.0889 |
| 10252 | SPRY1 | P10T-E | Human | Esophagus | ESCC | 2.27e-14 | 3.75e-01 | 0.116 |
| 10252 | SPRY1 | P12T-E | Human | Esophagus | ESCC | 3.58e-07 | 2.98e-01 | 0.1122 |
| 10252 | SPRY1 | P15T-E | Human | Esophagus | ESCC | 4.38e-04 | 1.18e-01 | 0.1149 |
| 10252 | SPRY1 | P16T-E | Human | Esophagus | ESCC | 4.31e-14 | 9.95e-02 | 0.1153 |
| 10252 | SPRY1 | P22T-E | Human | Esophagus | ESCC | 4.35e-02 | -5.14e-02 | 0.1236 |
| 10252 | SPRY1 | P23T-E | Human | Esophagus | ESCC | 2.63e-02 | 3.52e-01 | 0.108 |
| 10252 | SPRY1 | P26T-E | Human | Esophagus | ESCC | 4.40e-11 | 1.50e-01 | 0.1276 |
| 10252 | SPRY1 | P48T-E | Human | Esophagus | ESCC | 9.51e-05 | 3.32e-02 | 0.0959 |
| 10252 | SPRY1 | P56T-E | Human | Esophagus | ESCC | 8.73e-04 | 3.48e-01 | 0.1613 |
| 10252 | SPRY1 | P57T-E | Human | Esophagus | ESCC | 9.14e-07 | 3.85e-01 | 0.0926 |
| 10252 | SPRY1 | P61T-E | Human | Esophagus | ESCC | 3.40e-14 | 9.89e-02 | 0.099 |
| 10252 | SPRY1 | P65T-E | Human | Esophagus | ESCC | 1.02e-02 | 2.37e-01 | 0.0978 |
| 10252 | SPRY1 | P75T-E | Human | Esophagus | ESCC | 9.94e-10 | 1.26e-01 | 0.1125 |
| 10252 | SPRY1 | P76T-E | Human | Esophagus | ESCC | 2.31e-06 | 2.92e-01 | 0.1207 |
| 10252 | SPRY1 | P79T-E | Human | Esophagus | ESCC | 1.03e-32 | 9.52e-01 | 0.1154 |
| 10252 | SPRY1 | P130T-E | Human | Esophagus | ESCC | 1.43e-12 | 5.84e-02 | 0.1676 |
| 10252 | SPRY1 | C43 | Human | Oral cavity | OSCC | 1.30e-03 | -3.36e-02 | 0.1704 |
| Page: 1 2 3 |
| Tissue | Expression Dynamics | Abbreviation |
| Esophagus |  | ESCC: Esophageal squamous cell carcinoma |
| HGIN: High-grade intraepithelial neoplasias | ||
| LGIN: Low-grade intraepithelial neoplasias | ||
| Oral Cavity | 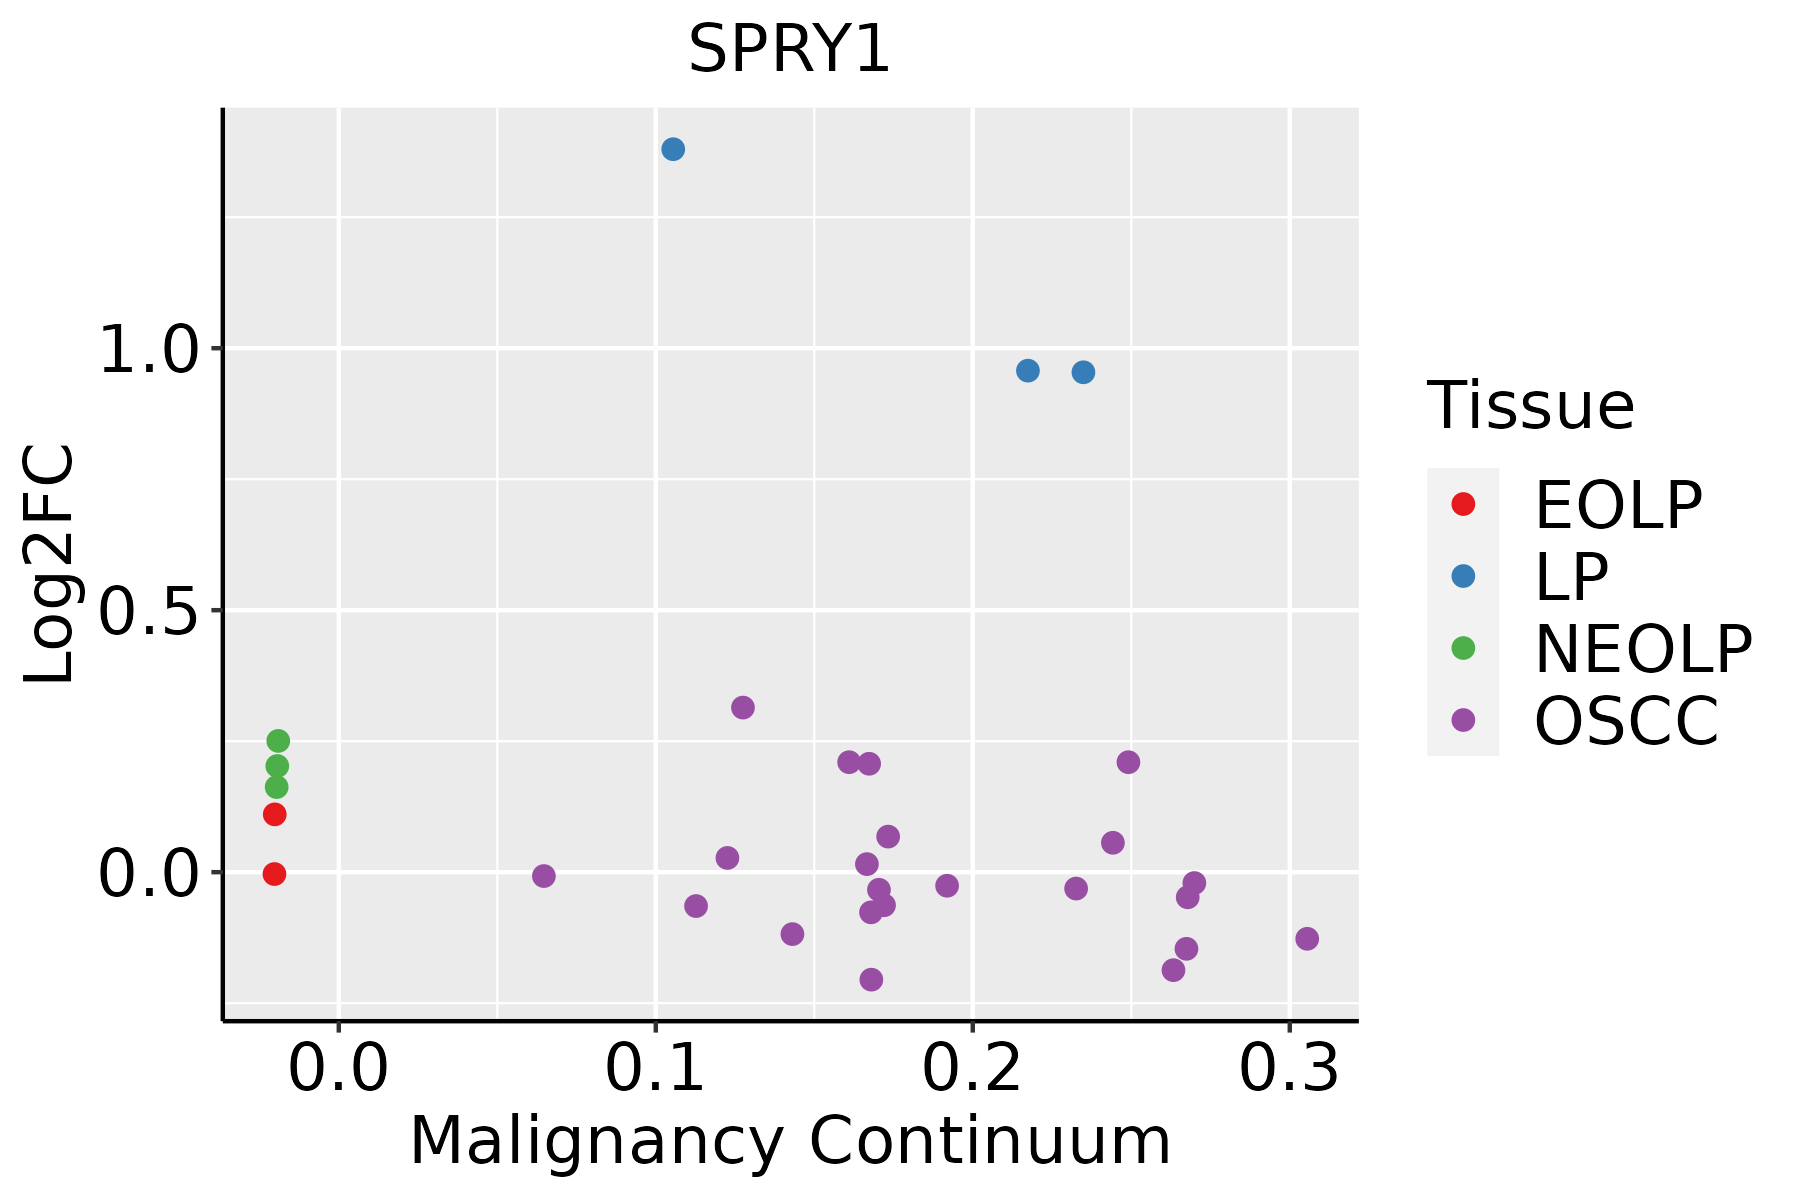 | EOLP: Erosive Oral lichen planus |
| LP: leukoplakia | ||
| NEOLP: Non-erosive oral lichen planus | ||
| OSCC: Oral squamous cell carcinoma | ||
| Prostate |  | BPH: Benign Prostatic Hyperplasia |
| Thyroid |  | ATC: Anaplastic thyroid cancer |
| HT: Hashimoto's thyroiditis | ||
| PTC: Papillary thyroid cancer |
| ∗log2FC in expression of this searched gene in stem-like cells from each diseased tissue sample relative to stem-like cells in normal samples in each tissue plotted against the malignancy continuum. Samples are colored based on if they are from different disease stage. |
Top |
Malignant transformation related pathway analysis |
| Find out the enriched GO biological processes and KEGG pathways involved in transition from healthy to precancer to cancer |
| Tissue | Disease Stage | Enriched GO biological Processes |
| Colorectum | AD |  |
| Colorectum | SER |  |
| Colorectum | MSS |  |
| Colorectum | MSI-H |  |
| Colorectum | FAP |  |
| ∗Top 15 enriched GO BP terms are showed in the bar plot of each disease state in each tissue. Each row represents a significant GO biological process which is colored according to the -log10(p.adjust). |
| Page: 1 2 3 4 5 6 7 8 9 |
| GO ID | Tissue | Disease Stage | Description | Gene Ratio | Bg Ratio | pvalue | p.adjust | Count |
| GO:005165617 | Esophagus | ESCC | establishment of organelle localization | 273/8552 | 390/18723 | 9.13e-23 | 1.81e-20 | 273 |
| GO:190285015 | Esophagus | ESCC | microtubule cytoskeleton organization involved in mitosis | 116/8552 | 147/18723 | 1.25e-16 | 9.91e-15 | 116 |
| GO:0010563111 | Esophagus | ESCC | negative regulation of phosphorus metabolic process | 274/8552 | 442/18723 | 2.32e-12 | 9.41e-11 | 274 |
| GO:0045936111 | Esophagus | ESCC | negative regulation of phosphate metabolic process | 273/8552 | 441/18723 | 3.18e-12 | 1.25e-10 | 273 |
| GO:0051348111 | Esophagus | ESCC | negative regulation of transferase activity | 177/8552 | 268/18723 | 1.08e-11 | 4.00e-10 | 177 |
| GO:007190016 | Esophagus | ESCC | regulation of protein serine/threonine kinase activity | 227/8552 | 359/18723 | 1.12e-11 | 4.10e-10 | 227 |
| GO:0042326111 | Esophagus | ESCC | negative regulation of phosphorylation | 237/8552 | 385/18723 | 1.86e-10 | 5.33e-09 | 237 |
| GO:0001933111 | Esophagus | ESCC | negative regulation of protein phosphorylation | 213/8552 | 342/18723 | 3.54e-10 | 9.76e-09 | 213 |
| GO:003367319 | Esophagus | ESCC | negative regulation of kinase activity | 154/8552 | 237/18723 | 1.38e-09 | 3.27e-08 | 154 |
| GO:000646920 | Esophagus | ESCC | negative regulation of protein kinase activity | 140/8552 | 212/18723 | 1.53e-09 | 3.56e-08 | 140 |
| GO:000716320 | Esophagus | ESCC | establishment or maintenance of cell polarity | 143/8552 | 218/18723 | 2.05e-09 | 4.65e-08 | 143 |
| GO:000726510 | Esophagus | ESCC | Ras protein signal transduction | 201/8552 | 337/18723 | 1.44e-07 | 2.30e-06 | 201 |
| GO:003001018 | Esophagus | ESCC | establishment of cell polarity | 96/8552 | 143/18723 | 1.69e-07 | 2.67e-06 | 96 |
| GO:00715599 | Esophagus | ESCC | response to transforming growth factor beta | 157/8552 | 256/18723 | 2.95e-07 | 4.23e-06 | 157 |
| GO:00715609 | Esophagus | ESCC | cellular response to transforming growth factor beta stimulus | 151/8552 | 250/18723 | 1.78e-06 | 2.10e-05 | 151 |
| GO:00303239 | Esophagus | ESCC | respiratory tube development | 112/8552 | 181/18723 | 7.82e-06 | 7.69e-05 | 112 |
| GO:00071799 | Esophagus | ESCC | transforming growth factor beta receptor signaling pathway | 121/8552 | 198/18723 | 8.26e-06 | 8.03e-05 | 121 |
| GO:006056210 | Esophagus | ESCC | epithelial tube morphogenesis | 187/8552 | 325/18723 | 9.95e-06 | 9.44e-05 | 187 |
| GO:00605417 | Esophagus | ESCC | respiratory system development | 123/8552 | 203/18723 | 1.26e-05 | 1.15e-04 | 123 |
| GO:00303249 | Esophagus | ESCC | lung development | 109/8552 | 177/18723 | 1.40e-05 | 1.27e-04 | 109 |
| Page: 1 2 3 4 5 6 7 8 9 10 11 12 13 14 15 16 17 18 19 20 |
| Pathway ID | Tissue | Disease Stage | Description | Gene Ratio | Bg Ratio | pvalue | p.adjust | qvalue | Count |
| Page: 1 |
Top |
Cell-cell communication analysis |
| Identification of potential cell-cell interactions between two cell types and their ligand-receptor pairs for different disease states |
| Ligand | Receptor | LRpair | Pathway | Tissue | Disease Stage |
| Page: 1 |
Top |
Single-cell gene regulatory network inference analysis |
| Find out the significant the regulons (TFs) and the target genes of each regulon across cell types for different disease states |
| TF | Cell Type | Tissue | Disease Stage | Target Gene | RSS | Regulon Activity |
| ∗The dot plots of a searched regulon are shown for all cell subpopulations in each disease state of each tissue based on the regulon specific score inferred using pySCENIC and by calculating the average expression. |
| Page: 1 |
Top |
Somatic mutation of malignant transformation related genes |
| Annotation of somatic variants for genes involved in malignant transformation |
| Hugo Symbol | Variant Class | Variant Classification | dbSNP RS | HGVSc | HGVSp | HGVSp Short | SWISSPROT | BIOTYPE | SIFT | PolyPhen | Tumor Sample Barcode | Tissue | Histology | Sex | Age | Stage | Therapy Types | Drugs | Outcome |
| SPRY1 | SNV | Missense_Mutation | c.510N>C | p.Leu170Phe | p.L170F | O43609 | protein_coding | tolerated(0.13) | benign(0.261) | TCGA-AC-A23H-01 | Breast | breast invasive carcinoma | Female | >=65 | I/II | Unknown | Unknown | PD | |
| SPRY1 | SNV | Missense_Mutation | novel | c.5A>G | p.Asp2Gly | p.D2G | O43609 | protein_coding | deleterious(0) | benign(0.025) | TCGA-AN-A046-01 | Breast | breast invasive carcinoma | Female | >=65 | I/II | Unknown | Unknown | SD |
| SPRY1 | SNV | Missense_Mutation | c.593N>C | p.Leu198Pro | p.L198P | O43609 | protein_coding | deleterious(0) | probably_damaging(0.998) | TCGA-AN-A0AK-01 | Breast | breast invasive carcinoma | Female | >=65 | I/II | Unknown | Unknown | SD | |
| SPRY1 | SNV | Missense_Mutation | c.874N>T | p.Arg292Cys | p.R292C | O43609 | protein_coding | deleterious(0) | probably_damaging(0.998) | TCGA-D8-A1XJ-01 | Breast | breast invasive carcinoma | Female | >=65 | III/IV | Hormone Therapy | tamoxiphen | SD | |
| SPRY1 | insertion | Nonsense_Mutation | novel | c.806_807insAGTGGAGAATGGACATTTCTTTTTCTTTTCATT | p.Cys269delinsTer | p.C269delins* | O43609 | protein_coding | TCGA-AN-A0FX-01 | Breast | breast invasive carcinoma | Female | <65 | I/II | Unknown | Unknown | SD | ||
| SPRY1 | SNV | Missense_Mutation | c.703N>A | p.Asp235Asn | p.D235N | O43609 | protein_coding | deleterious(0) | probably_damaging(0.963) | TCGA-EK-A2PG-01 | Cervix | cervical & endocervical cancer | Female | >=65 | I/II | Unknown | Unknown | SD | |
| SPRY1 | SNV | Missense_Mutation | c.669N>G | p.Cys223Trp | p.C223W | O43609 | protein_coding | deleterious(0) | probably_damaging(0.998) | TCGA-Q1-A6DT-01 | Cervix | cervical & endocervical cancer | Female | <65 | I/II | Unknown | Unknown | PD | |
| SPRY1 | SNV | Missense_Mutation | c.12A>C | p.Gln4His | p.Q4H | O43609 | protein_coding | tolerated(0.11) | benign(0.172) | TCGA-AA-3510-01 | Colorectum | colon adenocarcinoma | Male | >=65 | I/II | Unknown | Unknown | SD | |
| SPRY1 | SNV | Missense_Mutation | c.287A>G | p.His96Arg | p.H96R | O43609 | protein_coding | tolerated(0.47) | benign(0.027) | TCGA-AA-3663-01 | Colorectum | colon adenocarcinoma | Male | <65 | I/II | Unknown | Unknown | SD | |
| SPRY1 | SNV | Missense_Mutation | novel | c.836N>T | p.Cys279Phe | p.C279F | O43609 | protein_coding | deleterious(0.02) | probably_damaging(0.987) | TCGA-AA-A02J-01 | Colorectum | colon adenocarcinoma | Female | >=65 | III/IV | Unknown | Unknown | PD |
| Page: 1 2 3 4 |
Top |
Related drugs of malignant transformation related genes |
| Identification of chemicals and drugs interact with genes involved in malignant transfromation |
| (DGIdb 4.0) |
| Entrez ID | Symbol | Category | Interaction Types | Drug Claim Name | Drug Name | PMIDs |
| Page: 1 |

Copyright 2023-Present -The University of Texas Health Science Center at Houston |