
|
|||||
|
 | |
| |
| |
| |
| |
| |
|
Gene: SPRR3 |
Gene summary for SPRR3 |
| Gene information | Species | Human | Gene symbol | SPRR3 | Gene ID | 6707 |
| Gene name | small proline rich protein 3 | |
| Gene Alias | SPRR3 | |
| Cytomap | 1q21.3 | |
| Gene Type | protein-coding | GO ID | GO:0006464 | UniProtAcc | Q9UBC9 |
Top |
Malignant transformation analysis |
| Identification of the aberrant gene expression in precancerous and cancerous lesions by comparing the gene expression of stem-like cells in diseased tissues with normal stem cells |
| Entrez ID | Symbol | Replicates | Species | Organ | Tissue | Adj P-value | Log2FC | Malignancy |
| 6707 | SPRR3 | HSIL_HPV_2 | Human | Cervix | HSIL_HPV | 1.91e-03 | -1.44e-01 | 0.0208 |
| 6707 | SPRR3 | H2 | Human | Cervix | HSIL_HPV | 4.32e-55 | 1.47e+00 | 0.0632 |
| 6707 | SPRR3 | L1 | Human | Cervix | CC | 2.06e-09 | 3.67e-01 | 0.0802 |
| 6707 | SPRR3 | T1 | Human | Cervix | CC | 4.57e-06 | -1.60e-01 | 0.0918 |
| 6707 | SPRR3 | LZE20T | Human | Esophagus | ESCC | 5.10e-08 | 1.90e+00 | 0.0662 |
| 6707 | SPRR3 | LZE22D1 | Human | Esophagus | HGIN | 1.06e-02 | 7.09e-01 | 0.0595 |
| 6707 | SPRR3 | LZE22T | Human | Esophagus | ESCC | 3.35e-03 | 1.23e+00 | 0.068 |
| 6707 | SPRR3 | P1T-E | Human | Esophagus | ESCC | 2.05e-04 | 3.46e+00 | 0.0875 |
| 6707 | SPRR3 | P23T-E | Human | Esophagus | ESCC | 4.52e-16 | 3.80e+00 | 0.108 |
| 6707 | SPRR3 | P39T-E | Human | Esophagus | ESCC | 3.27e-12 | 2.79e+00 | 0.0894 |
| 6707 | SPRR3 | P84T-E | Human | Esophagus | ESCC | 4.19e-03 | 4.34e+00 | 0.0933 |
| 6707 | SPRR3 | P127T-E | Human | Esophagus | ESCC | 6.45e-16 | 2.22e+00 | 0.0826 |
| 6707 | SPRR3 | P128T-E | Human | Esophagus | ESCC | 4.23e-37 | 3.41e+00 | 0.1241 |
| 6707 | SPRR3 | C46 | Human | Oral cavity | OSCC | 9.10e-03 | -4.34e-01 | 0.1673 |
| 6707 | SPRR3 | C57 | Human | Oral cavity | OSCC | 2.63e-81 | 5.52e+00 | 0.1679 |
| 6707 | SPRR3 | C86 | Human | Oral cavity | OSCC | 2.81e-02 | 2.79e-01 | 0.161 |
| 6707 | SPRR3 | LN22 | Human | Oral cavity | OSCC | 4.37e-07 | 2.73e+00 | 0.1733 |
| 6707 | SPRR3 | LN38 | Human | Oral cavity | OSCC | 2.61e-02 | 2.79e-01 | 0.168 |
| 6707 | SPRR3 | LN46 | Human | Oral cavity | OSCC | 9.28e-17 | 3.28e-01 | 0.1666 |
| 6707 | SPRR3 | EOLP-1 | Human | Oral cavity | EOLP | 1.90e-10 | -4.58e-01 | -0.0202 |
| Page: 1 2 |
| Tissue | Expression Dynamics | Abbreviation |
| Cervix | 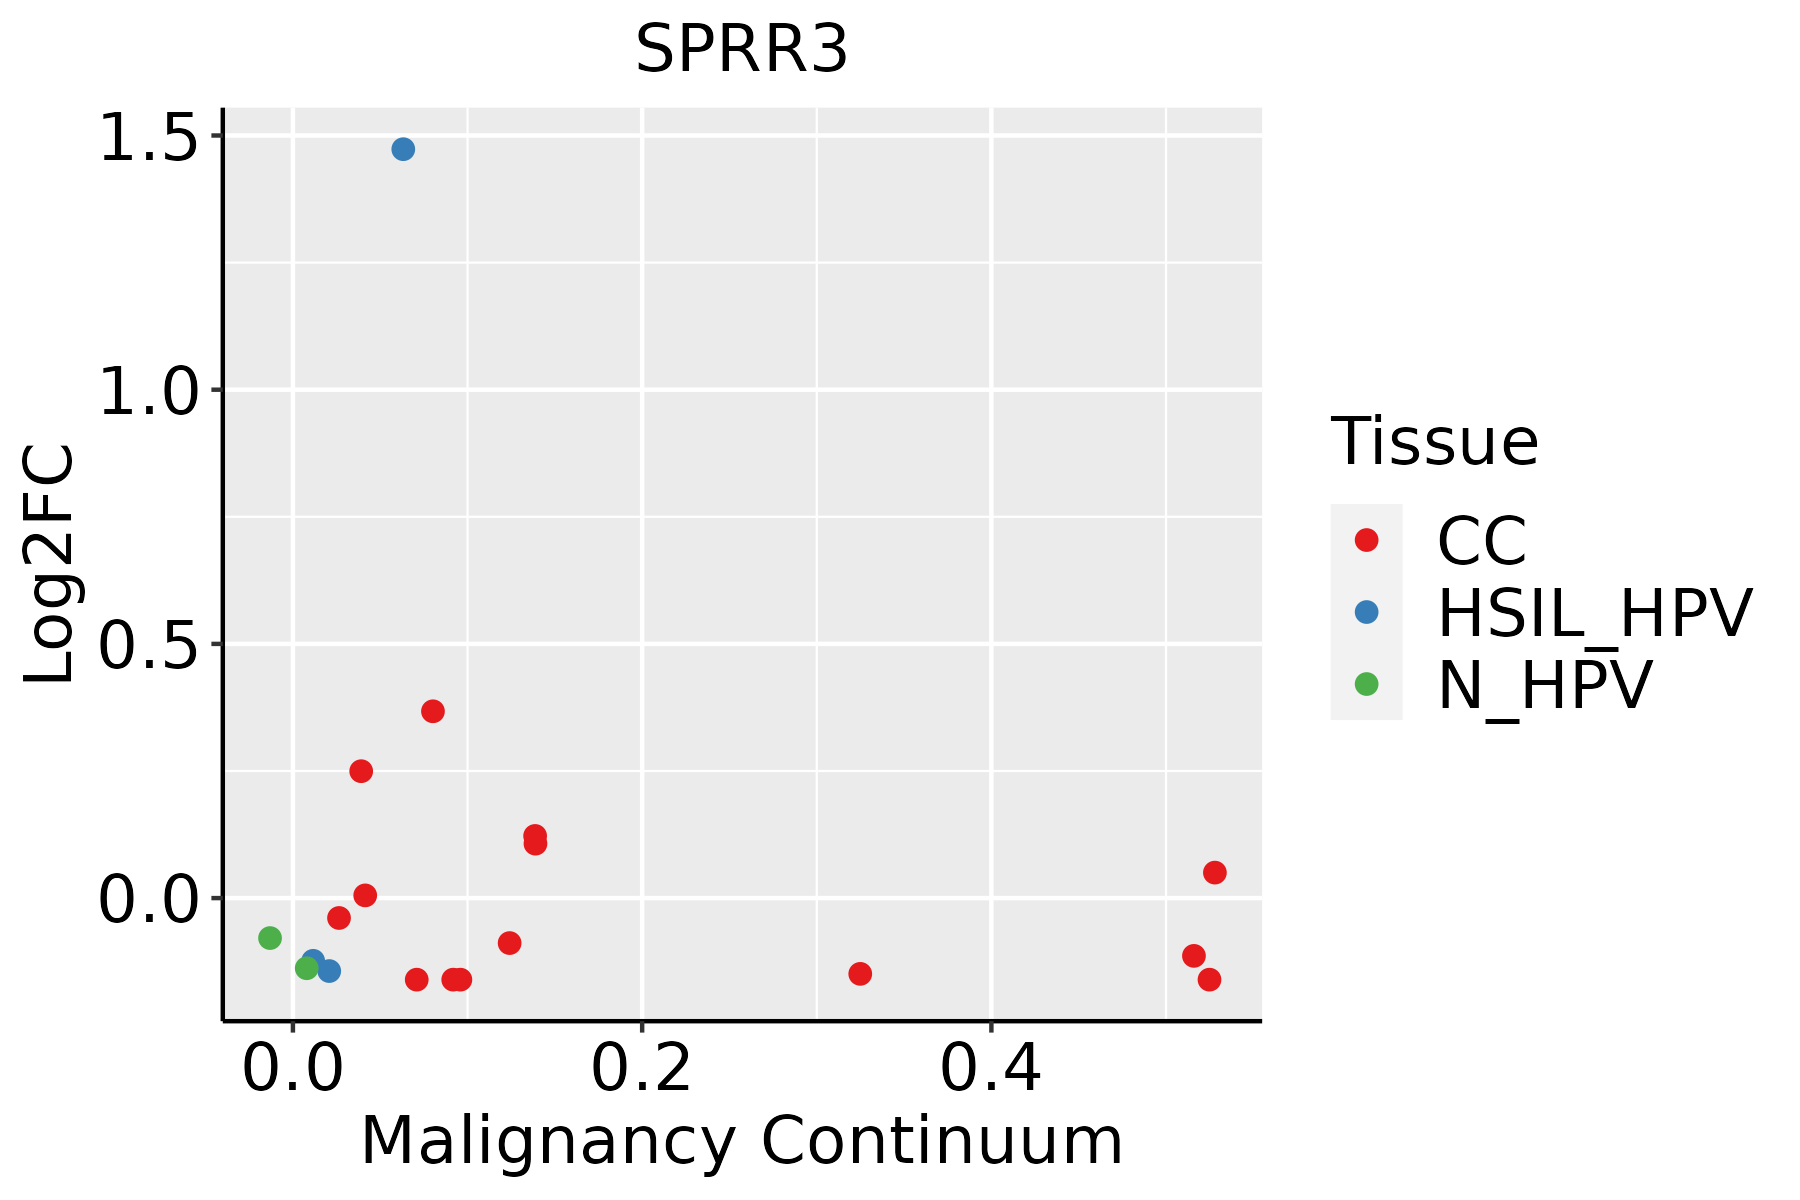 | CC: Cervix cancer |
| HSIL_HPV: HPV-infected high-grade squamous intraepithelial lesions | ||
| N_HPV: HPV-infected normal cervix | ||
| Esophagus | 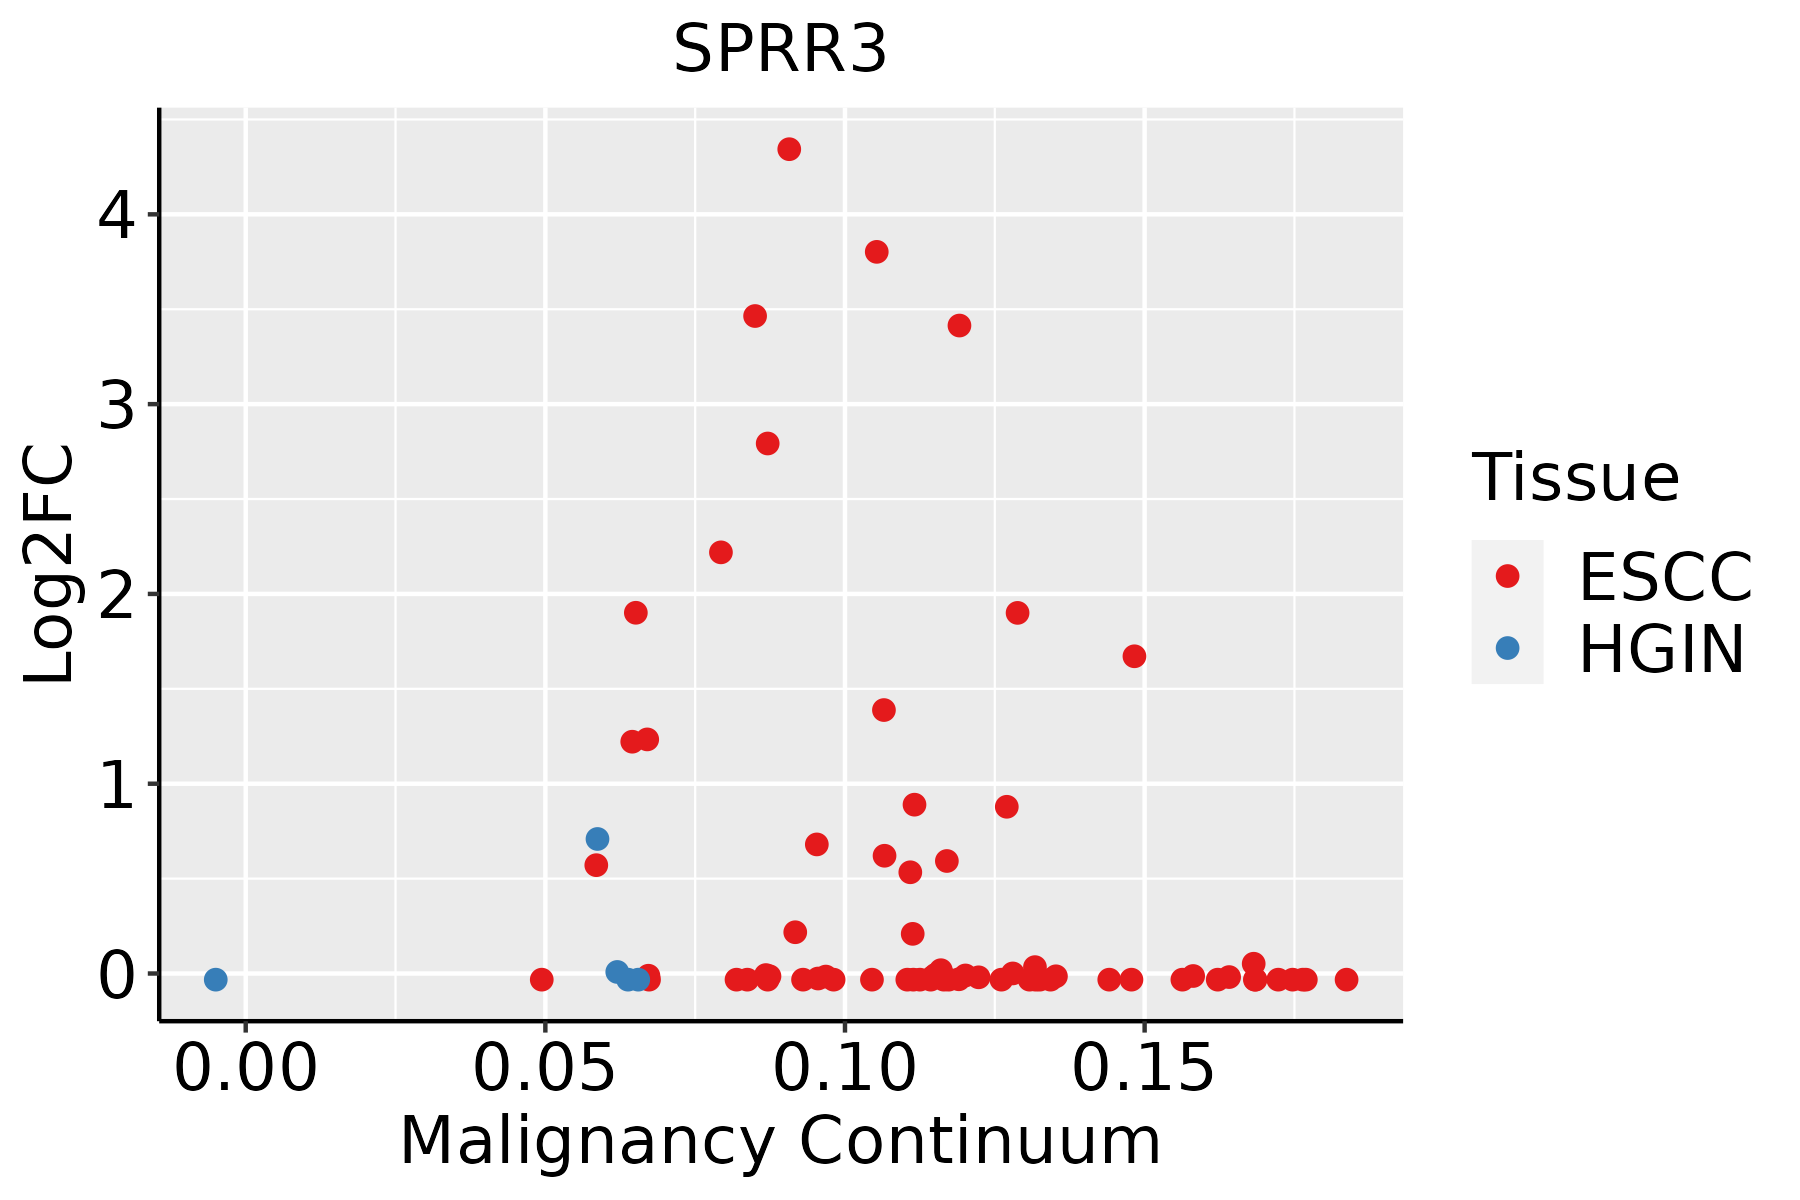 | ESCC: Esophageal squamous cell carcinoma |
| HGIN: High-grade intraepithelial neoplasias | ||
| LGIN: Low-grade intraepithelial neoplasias | ||
| Oral Cavity |  | EOLP: Erosive Oral lichen planus |
| LP: leukoplakia | ||
| NEOLP: Non-erosive oral lichen planus | ||
| OSCC: Oral squamous cell carcinoma |
| ∗log2FC in expression of this searched gene in stem-like cells from each diseased tissue sample relative to stem-like cells in normal samples in each tissue plotted against the malignancy continuum. Samples are colored based on if they are from different disease stage. |
Top |
Malignant transformation related pathway analysis |
| Find out the enriched GO biological processes and KEGG pathways involved in transition from healthy to precancer to cancer |
| Tissue | Disease Stage | Enriched GO biological Processes |
| Colorectum | AD |  |
| Colorectum | SER |  |
| Colorectum | MSS |  |
| Colorectum | MSI-H |  |
| Colorectum | FAP |  |
| ∗Top 15 enriched GO BP terms are showed in the bar plot of each disease state in each tissue. Each row represents a significant GO biological process which is colored according to the -log10(p.adjust). |
| Page: 1 2 3 4 5 6 7 8 9 |
| GO ID | Tissue | Disease Stage | Description | Gene Ratio | Bg Ratio | pvalue | p.adjust | Count |
| GO:004206010 | Cervix | CC | wound healing | 109/2311 | 422/18723 | 1.84e-14 | 1.57e-11 | 109 |
| GO:00085446 | Cervix | CC | epidermis development | 83/2311 | 324/18723 | 3.91e-11 | 8.54e-09 | 83 |
| GO:00435884 | Cervix | CC | skin development | 71/2311 | 263/18723 | 8.04e-11 | 1.46e-08 | 71 |
| GO:00302164 | Cervix | CC | keratinocyte differentiation | 42/2311 | 139/18723 | 1.74e-08 | 1.28e-06 | 42 |
| GO:00099137 | Cervix | CC | epidermal cell differentiation | 53/2311 | 202/18723 | 5.48e-08 | 3.25e-06 | 53 |
| GO:00181493 | Cervix | CC | peptide cross-linking | 10/2311 | 35/18723 | 7.99e-03 | 4.18e-02 | 10 |
| GO:000854413 | Cervix | HSIL_HPV | epidermis development | 38/737 | 324/18723 | 1.92e-09 | 3.23e-07 | 38 |
| GO:003021611 | Cervix | HSIL_HPV | keratinocyte differentiation | 22/737 | 139/18723 | 2.53e-08 | 2.18e-06 | 22 |
| GO:004358813 | Cervix | HSIL_HPV | skin development | 31/737 | 263/18723 | 5.32e-08 | 3.89e-06 | 31 |
| GO:000991313 | Cervix | HSIL_HPV | epidermal cell differentiation | 26/737 | 202/18723 | 1.10e-07 | 7.15e-06 | 26 |
| GO:004206015 | Cervix | HSIL_HPV | wound healing | 40/737 | 422/18723 | 2.80e-07 | 1.61e-05 | 40 |
| GO:00181491 | Cervix | HSIL_HPV | peptide cross-linking | 8/737 | 35/18723 | 5.08e-05 | 1.26e-03 | 8 |
| GO:00435888 | Esophagus | ESCC | skin development | 163/8552 | 263/18723 | 6.48e-08 | 1.14e-06 | 163 |
| GO:000854410 | Esophagus | ESCC | epidermis development | 193/8552 | 324/18723 | 2.87e-07 | 4.19e-06 | 193 |
| GO:004206027 | Esophagus | ESCC | wound healing | 243/8552 | 422/18723 | 4.62e-07 | 6.25e-06 | 243 |
| GO:000991310 | Esophagus | ESCC | epidermal cell differentiation | 122/8552 | 202/18723 | 1.69e-05 | 1.51e-04 | 122 |
| GO:00302167 | Esophagus | ESCC | keratinocyte differentiation | 86/8552 | 139/18723 | 8.53e-05 | 6.19e-04 | 86 |
| GO:004206020 | Oral cavity | OSCC | wound healing | 237/7305 | 422/18723 | 4.51e-13 | 2.18e-11 | 237 |
| GO:00435887 | Oral cavity | OSCC | skin development | 143/7305 | 263/18723 | 2.77e-07 | 4.27e-06 | 143 |
| GO:00085449 | Oral cavity | OSCC | epidermis development | 171/7305 | 324/18723 | 2.89e-07 | 4.43e-06 | 171 |
| Page: 1 2 |
| Pathway ID | Tissue | Disease Stage | Description | Gene Ratio | Bg Ratio | pvalue | p.adjust | qvalue | Count |
| Page: 1 |
Top |
Cell-cell communication analysis |
| Identification of potential cell-cell interactions between two cell types and their ligand-receptor pairs for different disease states |
| Ligand | Receptor | LRpair | Pathway | Tissue | Disease Stage |
| Page: 1 |
Top |
Single-cell gene regulatory network inference analysis |
| Find out the significant the regulons (TFs) and the target genes of each regulon across cell types for different disease states |
| TF | Cell Type | Tissue | Disease Stage | Target Gene | RSS | Regulon Activity |
| ∗The dot plots of a searched regulon are shown for all cell subpopulations in each disease state of each tissue based on the regulon specific score inferred using pySCENIC and by calculating the average expression. |
| Page: 1 |
Top |
Somatic mutation of malignant transformation related genes |
| Annotation of somatic variants for genes involved in malignant transformation |
| Hugo Symbol | Variant Class | Variant Classification | dbSNP RS | HGVSc | HGVSp | HGVSp Short | SWISSPROT | BIOTYPE | SIFT | PolyPhen | Tumor Sample Barcode | Tissue | Histology | Sex | Age | Stage | Therapy Types | Drugs | Outcome |
| SPRR3 | SNV | Missense_Mutation | c.403N>C | p.Glu135Gln | p.E135Q | Q9UBC9 | protein_coding | tolerated(0.14) | benign(0.054) | TCGA-BH-A0H5-01 | Breast | breast invasive carcinoma | Female | <65 | I/II | Chemotherapy | cytoxan | CR | |
| SPRR3 | insertion | Nonsense_Mutation | novel | c.449_450insTGCTTTGGGAGCCTGAGGCTAGAGAACAATCTGAGCCCAGA | p.Glu151AlafsTer5 | p.E151Afs*5 | Q9UBC9 | protein_coding | TCGA-AN-A049-01 | Breast | breast invasive carcinoma | Female | <65 | I/II | Unknown | Unknown | SD | ||
| SPRR3 | SNV | Missense_Mutation | novel | c.121T>C | p.Cys41Arg | p.C41R | Q9UBC9 | protein_coding | tolerated(0.05) | possibly_damaging(0.701) | TCGA-2W-A8YY-01 | Cervix | cervical & endocervical cancer | Female | <65 | I/II | Chemotherapy | cisplatin | CR |
| SPRR3 | SNV | Missense_Mutation | novel | c.286C>T | p.Pro96Ser | p.P96S | Q9UBC9 | protein_coding | tolerated(0.07) | benign(0.033) | TCGA-AA-3941-01 | Colorectum | colon adenocarcinoma | Female | >=65 | I/II | Unknown | Unknown | SD |
| SPRR3 | SNV | Missense_Mutation | rs746832933 | c.90N>T | p.Gln30His | p.Q30H | Q9UBC9 | protein_coding | deleterious(0.04) | possibly_damaging(0.527) | TCGA-AZ-6606-01 | Colorectum | colon adenocarcinoma | Male | >=65 | III/IV | Chemotherapy | folfiri | PD |
| SPRR3 | SNV | Missense_Mutation | c.169G>T | p.Gly57Cys | p.G57C | Q9UBC9 | protein_coding | tolerated(0.37) | benign(0.012) | TCGA-CM-4743-01 | Colorectum | colon adenocarcinoma | Male | >=65 | I/II | Chemotherapy | capecitabine | SD | |
| SPRR3 | SNV | Missense_Mutation | c.500A>G | p.Lys167Arg | p.K167R | Q9UBC9 | protein_coding | deleterious(0.02) | probably_damaging(0.977) | TCGA-NH-A8F7-06 | Colorectum | NA | NA | NA | NA | NA | NA | NA | |
| SPRR3 | SNV | Missense_Mutation | c.47N>C | p.Leu16Pro | p.L16P | Q9UBC9 | protein_coding | tolerated(0.18) | benign(0) | TCGA-AG-3885-01 | Colorectum | rectum adenocarcinoma | Female | >=65 | III/IV | Ancillary | zoledronic | SD | |
| SPRR3 | SNV | Missense_Mutation | novel | c.142C>T | p.Pro48Ser | p.P48S | Q9UBC9 | protein_coding | tolerated(0.06) | possibly_damaging(0.871) | TCGA-AP-A1E0-01 | Endometrium | uterine corpus endometrioid carcinoma | Female | <65 | III/IV | Chemotherapy | paclitaxel | SD |
| SPRR3 | SNV | Missense_Mutation | c.437N>G | p.Tyr146Cys | p.Y146C | Q9UBC9 | protein_coding | tolerated(0.1) | possibly_damaging(0.87) | TCGA-AX-A05Z-01 | Endometrium | uterine corpus endometrioid carcinoma | Female | <65 | III/IV | Chemotherapy | adriamycin | SD |
| Page: 1 2 3 |
Top |
Related drugs of malignant transformation related genes |
| Identification of chemicals and drugs interact with genes involved in malignant transfromation |
| (DGIdb 4.0) |
| Entrez ID | Symbol | Category | Interaction Types | Drug Claim Name | Drug Name | PMIDs |
| Page: 1 |

Copyright 2023-Present -The University of Texas Health Science Center at Houston |