
|
|||||
|
 | |
| |
| |
| |
| |
| |
|
Gene: SPRR2G |
Gene summary for SPRR2G |
| Gene information | Species | Human | Gene symbol | SPRR2G | Gene ID | 6706 |
| Gene name | small proline rich protein 2G | |
| Gene Alias | SPRR2G | |
| Cytomap | 1q21.3 | |
| Gene Type | protein-coding | GO ID | GO:0007275 | UniProtAcc | Q9BYE4 |
Top |
Malignant transformation analysis |
| Identification of the aberrant gene expression in precancerous and cancerous lesions by comparing the gene expression of stem-like cells in diseased tissues with normal stem cells |
| Entrez ID | Symbol | Replicates | Species | Organ | Tissue | Adj P-value | Log2FC | Malignancy |
| 6706 | SPRR2G | LP15 | Human | Oral cavity | LP | 1.43e-05 | 7.90e-01 | 0.2174 |
| 6706 | SPRR2G | SYSMH3 | Human | Oral cavity | OSCC | 2.28e-48 | 9.14e-01 | 0.2442 |
| 6706 | SPRR2G | SYSMH4 | Human | Oral cavity | OSCC | 2.02e-07 | 9.79e-02 | 0.1226 |
| 6706 | SPRR2G | SYSMH5 | Human | Oral cavity | OSCC | 7.84e-17 | 9.36e-01 | 0.0647 |
| Page: 1 |
| Tissue | Expression Dynamics | Abbreviation |
| Oral Cavity | 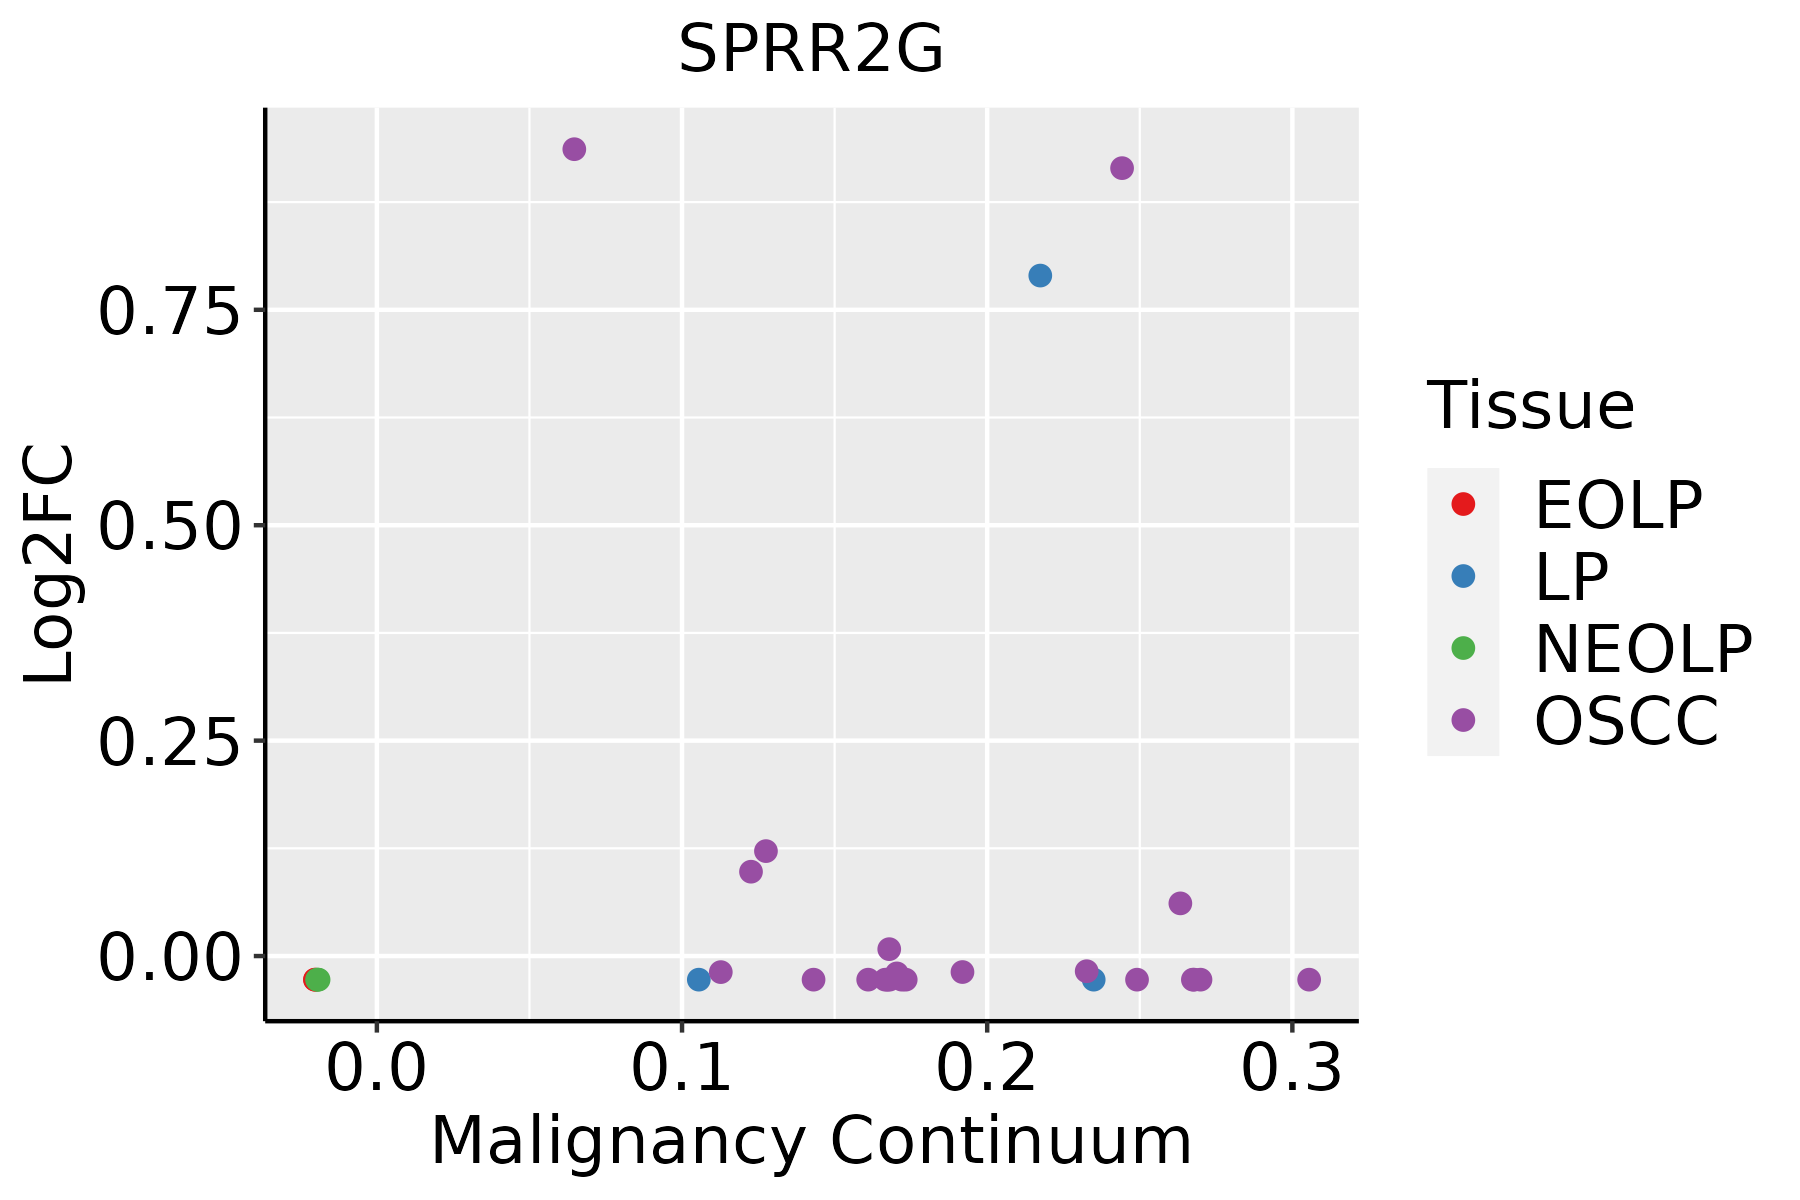 | EOLP: Erosive Oral lichen planus |
| LP: leukoplakia | ||
| NEOLP: Non-erosive oral lichen planus | ||
| OSCC: Oral squamous cell carcinoma |
| ∗log2FC in expression of this searched gene in stem-like cells from each diseased tissue sample relative to stem-like cells in normal samples in each tissue plotted against the malignancy continuum. Samples are colored based on if they are from different disease stage. |
Top |
Malignant transformation related pathway analysis |
| Find out the enriched GO biological processes and KEGG pathways involved in transition from healthy to precancer to cancer |
| Tissue | Disease Stage | Enriched GO biological Processes |
| Colorectum | AD |  |
| Colorectum | SER |  |
| Colorectum | MSS |  |
| Colorectum | MSI-H |  |
| Colorectum | FAP |  |
| ∗Top 15 enriched GO BP terms are showed in the bar plot of each disease state in each tissue. Each row represents a significant GO biological process which is colored according to the -log10(p.adjust). |
| Page: 1 2 3 4 5 6 7 8 9 |
| GO ID | Tissue | Disease Stage | Description | Gene Ratio | Bg Ratio | pvalue | p.adjust | Count |
| GO:00435887 | Oral cavity | OSCC | skin development | 143/7305 | 263/18723 | 2.77e-07 | 4.27e-06 | 143 |
| GO:00085449 | Oral cavity | OSCC | epidermis development | 171/7305 | 324/18723 | 2.89e-07 | 4.43e-06 | 171 |
| GO:00302166 | Oral cavity | OSCC | keratinocyte differentiation | 81/7305 | 139/18723 | 3.16e-06 | 3.81e-05 | 81 |
| GO:00099139 | Oral cavity | OSCC | epidermal cell differentiation | 109/7305 | 202/18723 | 1.08e-05 | 1.14e-04 | 109 |
| GO:000854416 | Oral cavity | LP | epidermis development | 112/4623 | 324/18723 | 3.81e-05 | 5.61e-04 | 112 |
| GO:004358816 | Oral cavity | LP | skin development | 93/4623 | 263/18723 | 6.47e-05 | 8.70e-04 | 93 |
| GO:003021613 | Oral cavity | LP | keratinocyte differentiation | 51/4623 | 139/18723 | 1.05e-03 | 8.84e-03 | 51 |
| GO:000991315 | Oral cavity | LP | epidermal cell differentiation | 69/4623 | 202/18723 | 1.53e-03 | 1.19e-02 | 69 |
| Page: 1 |
| Pathway ID | Tissue | Disease Stage | Description | Gene Ratio | Bg Ratio | pvalue | p.adjust | qvalue | Count |
| Page: 1 |
Top |
Cell-cell communication analysis |
| Identification of potential cell-cell interactions between two cell types and their ligand-receptor pairs for different disease states |
| Ligand | Receptor | LRpair | Pathway | Tissue | Disease Stage |
| Page: 1 |
Top |
Single-cell gene regulatory network inference analysis |
| Find out the significant the regulons (TFs) and the target genes of each regulon across cell types for different disease states |
| TF | Cell Type | Tissue | Disease Stage | Target Gene | RSS | Regulon Activity |
| ∗The dot plots of a searched regulon are shown for all cell subpopulations in each disease state of each tissue based on the regulon specific score inferred using pySCENIC and by calculating the average expression. |
| Page: 1 |
Top |
Somatic mutation of malignant transformation related genes |
| Annotation of somatic variants for genes involved in malignant transformation |
| Hugo Symbol | Variant Class | Variant Classification | dbSNP RS | HGVSc | HGVSp | HGVSp Short | SWISSPROT | BIOTYPE | SIFT | PolyPhen | Tumor Sample Barcode | Tissue | Histology | Sex | Age | Stage | Therapy Types | Drugs | Outcome |
| SPRR2G | SNV | Missense_Mutation | c.112N>T | p.Pro38Ser | p.P38S | Q9BYE4 | protein_coding | benign(0.246) | TCGA-G4-6302-01 | Colorectum | colon adenocarcinoma | Female | >=65 | I/II | Unknown | Unknown | SD | ||
| SPRR2G | SNV | Missense_Mutation | c.49N>T | p.Val17Leu | p.V17L | Q9BYE4 | protein_coding | benign(0.104) | TCGA-F5-6863-01 | Colorectum | rectum adenocarcinoma | Female | >=65 | III/IV | Chemotherapy | etoposide | SD | ||
| SPRR2G | SNV | Missense_Mutation | c.94T>C | p.Cys32Arg | p.C32R | Q9BYE4 | protein_coding | possibly_damaging(0.901) | TCGA-B5-A11E-01 | Endometrium | uterine corpus endometrioid carcinoma | Female | <65 | I/II | Unknown | Unknown | SD | ||
| SPRR2G | SNV | Missense_Mutation | c.118C>A | p.Pro40Thr | p.P40T | Q9BYE4 | protein_coding | benign(0.003) | TCGA-BG-A0RY-01 | Endometrium | uterine corpus endometrioid carcinoma | Female | >=65 | I/II | Unknown | Unknown | SD | ||
| SPRR2G | SNV | Missense_Mutation | novel | c.132N>T | p.Glu44Asp | p.E44D | Q9BYE4 | protein_coding | benign(0.056) | TCGA-E6-A1LX-01 | Endometrium | uterine corpus endometrioid carcinoma | Female | <65 | I/II | Unknown | Unknown | SD | |
| SPRR2G | SNV | Missense_Mutation | novel | c.202T>C | p.Tyr68His | p.Y68H | Q9BYE4 | protein_coding | benign(0) | TCGA-FI-A2D5-01 | Endometrium | uterine corpus endometrioid carcinoma | Female | <65 | III/IV | Chemotherapy | carboplatinum | PD | |
| SPRR2G | insertion | In_Frame_Ins | novel | c.108_109insTGCAAGCCCGCCTCTCGGATTCACGCCATTCTC | p.Tyr36_Leu37insCysLysProAlaSerArgIleHisAlaIleLeu | p.Y36_L37insCKPASRIHAIL | Q9BYE4 | protein_coding | TCGA-B5-A11V-01 | Endometrium | uterine corpus endometrioid carcinoma | Female | <65 | I/II | Unknown | Unknown | SD | ||
| SPRR2G | SNV | Missense_Mutation | c.100N>A | p.Glu34Lys | p.E34K | Q9BYE4 | protein_coding | possibly_damaging(0.775) | TCGA-DD-A39Y-01 | Liver | liver hepatocellular carcinoma | Male | >=65 | I/II | Unknown | Unknown | SD | ||
| SPRR2G | SNV | Missense_Mutation | c.193N>A | p.Gln65Lys | p.Q65K | Q9BYE4 | protein_coding | benign(0.395) | TCGA-69-7980-01 | Lung | lung adenocarcinoma | Female | >=65 | I/II | Unknown | Unknown | SD | ||
| SPRR2G | SNV | Missense_Mutation | c.187C>A | p.Pro63Thr | p.P63T | Q9BYE4 | protein_coding | probably_damaging(0.923) | TCGA-73-4677-01 | Lung | lung adenocarcinoma | Male | >=65 | I/II | Unknown | Unknown | PD |
| Page: 1 2 |
Top |
Related drugs of malignant transformation related genes |
| Identification of chemicals and drugs interact with genes involved in malignant transfromation |
| (DGIdb 4.0) |
| Entrez ID | Symbol | Category | Interaction Types | Drug Claim Name | Drug Name | PMIDs |
| Page: 1 |

Copyright 2023-Present -The University of Texas Health Science Center at Houston |