
|
|||||
|
 | |
| |
| |
| |
| |
| |
|
Gene: SPRR1B |
Gene summary for SPRR1B |
| Gene information | Species | Human | Gene symbol | SPRR1B | Gene ID | 6699 |
| Gene name | small proline rich protein 1B | |
| Gene Alias | CORNIFIN | |
| Cytomap | 1q21.3 | |
| Gene Type | protein-coding | GO ID | GO:0006464 | UniProtAcc | P22528 |
Top |
Malignant transformation analysis |
| Identification of the aberrant gene expression in precancerous and cancerous lesions by comparing the gene expression of stem-like cells in diseased tissues with normal stem cells |
| Entrez ID | Symbol | Replicates | Species | Organ | Tissue | Adj P-value | Log2FC | Malignancy |
| 6699 | SPRR1B | HSIL_HPV_2 | Human | Cervix | HSIL_HPV | 4.75e-06 | -2.33e-01 | 0.0208 |
| 6699 | SPRR1B | CCI_1 | Human | Cervix | CC | 3.56e-08 | 1.04e+00 | 0.528 |
| 6699 | SPRR1B | Tumor | Human | Cervix | CC | 5.09e-35 | 1.12e+00 | 0.1241 |
| 6699 | SPRR1B | sample3 | Human | Cervix | CC | 8.10e-40 | 1.20e+00 | 0.1387 |
| 6699 | SPRR1B | L1 | Human | Cervix | CC | 8.08e-23 | 1.11e+00 | 0.0802 |
| 6699 | SPRR1B | T3 | Human | Cervix | CC | 1.38e-39 | 1.22e+00 | 0.1389 |
| 6699 | SPRR1B | LZE20T | Human | Esophagus | ESCC | 2.68e-04 | 6.70e-01 | 0.0662 |
| 6699 | SPRR1B | P4T-E | Human | Esophagus | ESCC | 6.07e-10 | 1.65e+00 | 0.1323 |
| 6699 | SPRR1B | P5T-E | Human | Esophagus | ESCC | 1.23e-33 | 1.71e+00 | 0.1327 |
| 6699 | SPRR1B | P21T-E | Human | Esophagus | ESCC | 1.17e-03 | 9.86e-01 | 0.1617 |
| 6699 | SPRR1B | P23T-E | Human | Esophagus | ESCC | 2.98e-19 | 2.21e+00 | 0.108 |
| 6699 | SPRR1B | P26T-E | Human | Esophagus | ESCC | 1.19e-02 | 4.31e-01 | 0.1276 |
| 6699 | SPRR1B | P28T-E | Human | Esophagus | ESCC | 7.52e-06 | 6.10e-01 | 0.1149 |
| 6699 | SPRR1B | P39T-E | Human | Esophagus | ESCC | 3.16e-10 | 9.70e-01 | 0.0894 |
| 6699 | SPRR1B | P42T-E | Human | Esophagus | ESCC | 6.50e-08 | 1.06e+00 | 0.1175 |
| 6699 | SPRR1B | P47T-E | Human | Esophagus | ESCC | 8.64e-04 | 9.41e-01 | 0.1067 |
| 6699 | SPRR1B | P52T-E | Human | Esophagus | ESCC | 4.85e-04 | 1.44e-01 | 0.1555 |
| 6699 | SPRR1B | P74T-E | Human | Esophagus | ESCC | 4.29e-09 | 1.55e+00 | 0.1479 |
| 6699 | SPRR1B | P91T-E | Human | Esophagus | ESCC | 1.83e-02 | 8.21e-01 | 0.1828 |
| 6699 | SPRR1B | P107T-E | Human | Esophagus | ESCC | 2.17e-15 | 1.17e+00 | 0.171 |
| Page: 1 2 3 |
| Tissue | Expression Dynamics | Abbreviation |
| Cervix | 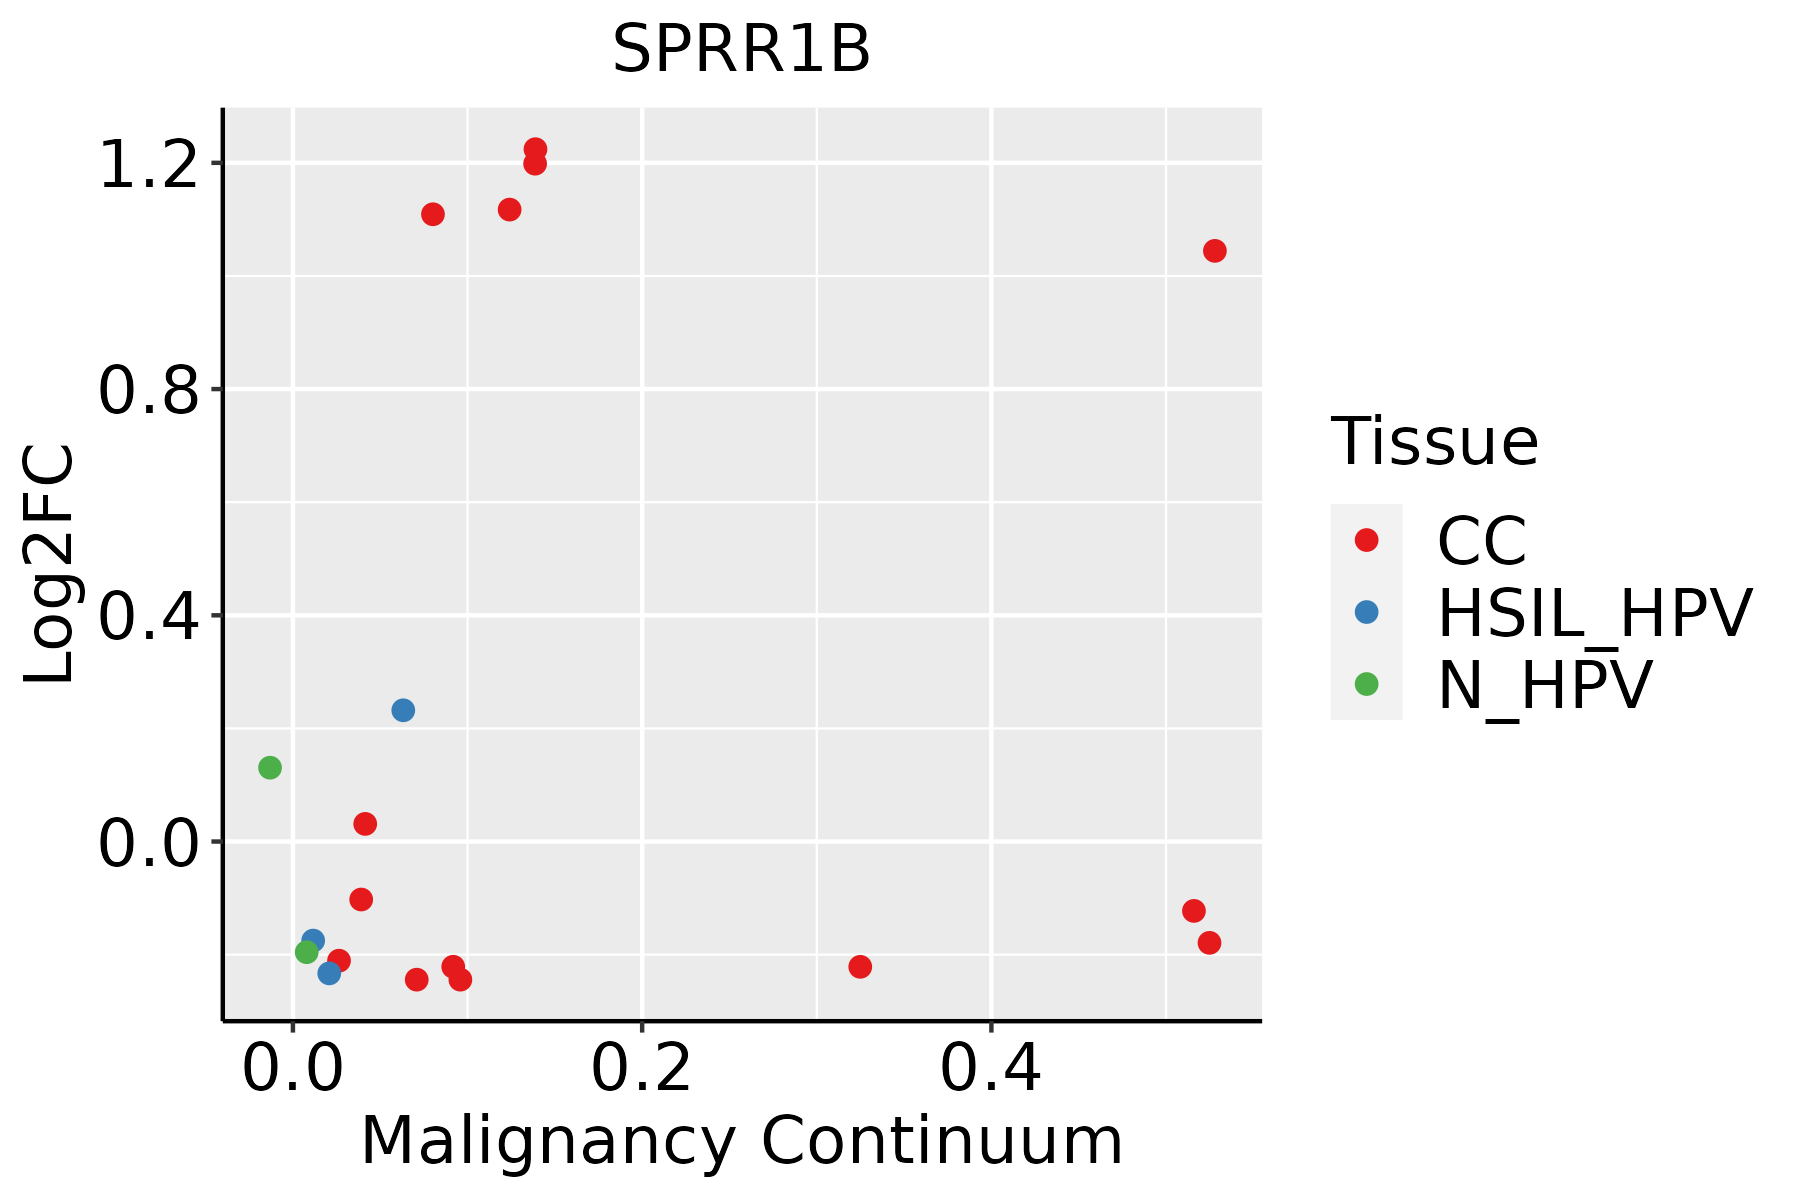 | CC: Cervix cancer |
| HSIL_HPV: HPV-infected high-grade squamous intraepithelial lesions | ||
| N_HPV: HPV-infected normal cervix | ||
| Esophagus | 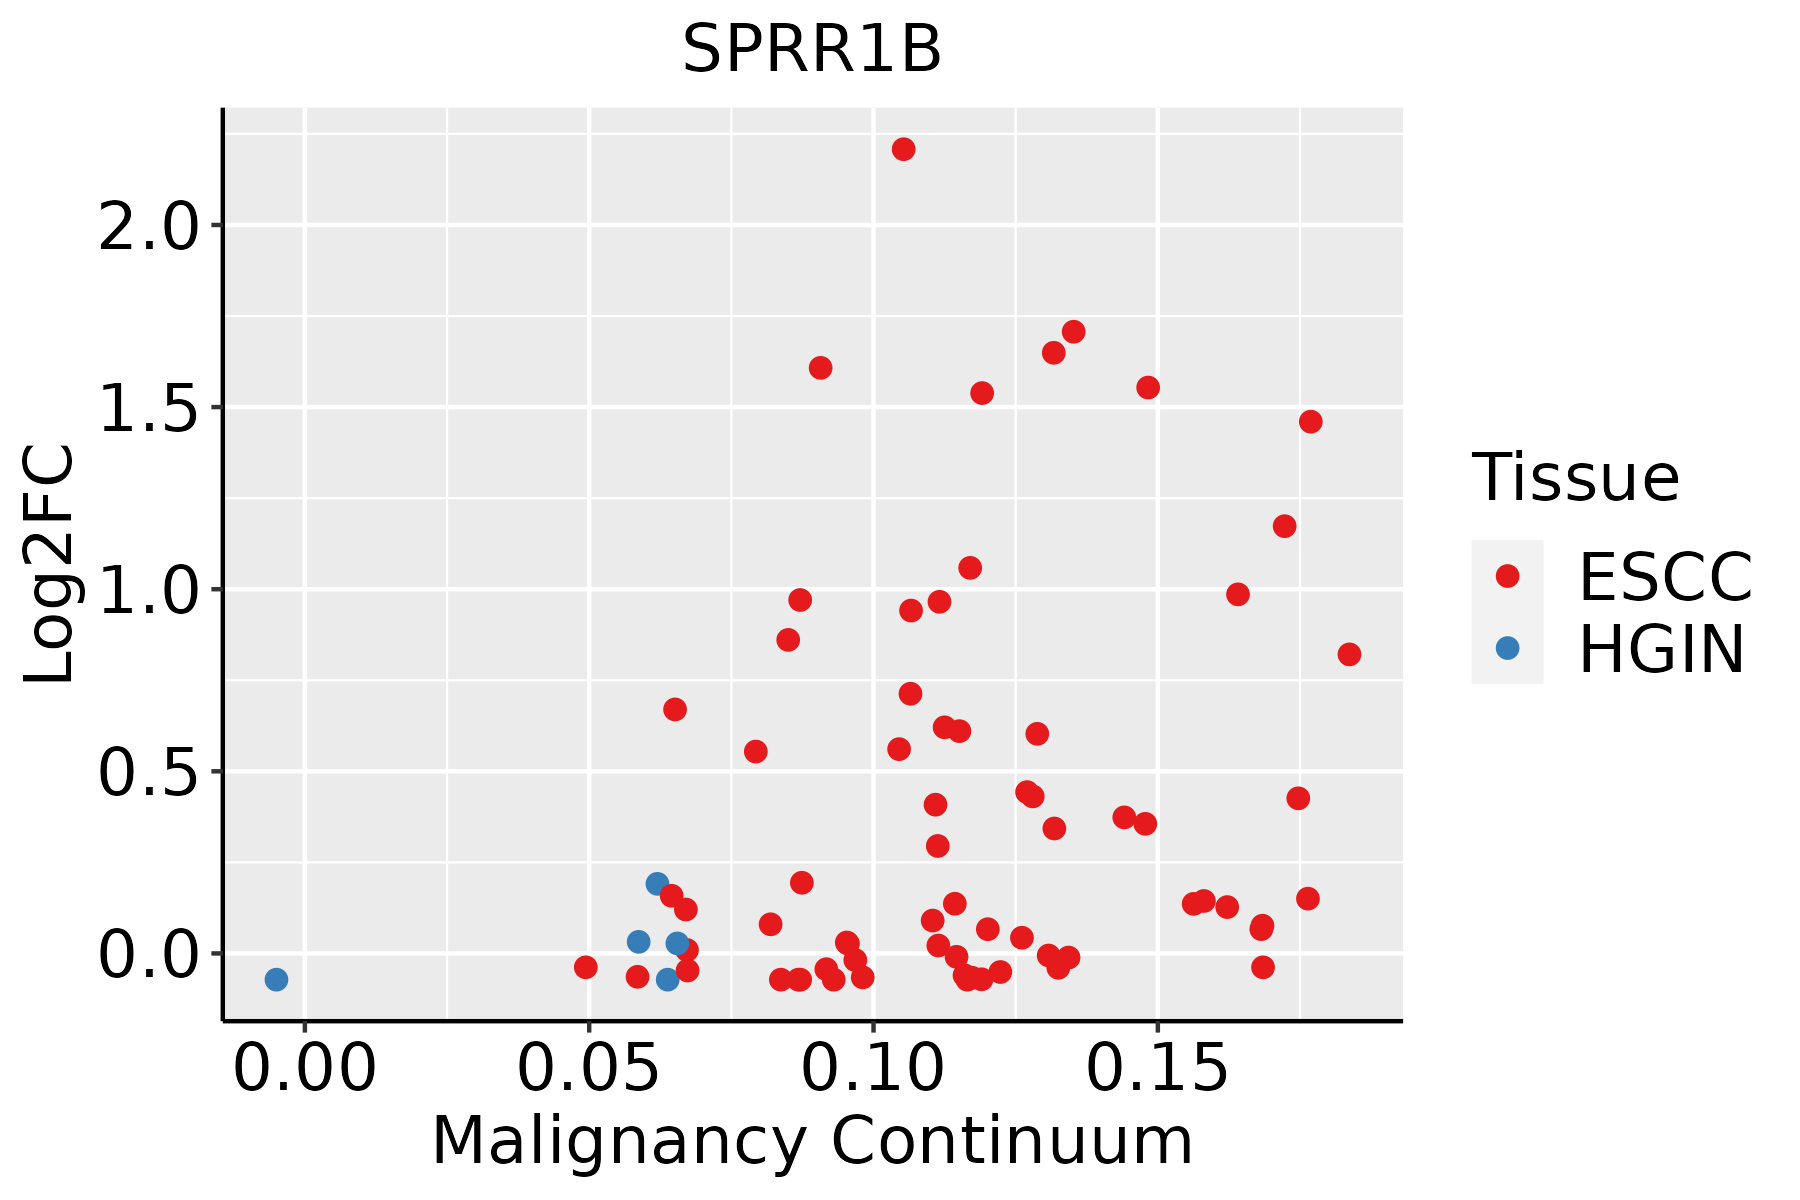 | ESCC: Esophageal squamous cell carcinoma |
| HGIN: High-grade intraepithelial neoplasias | ||
| LGIN: Low-grade intraepithelial neoplasias | ||
| Oral Cavity | 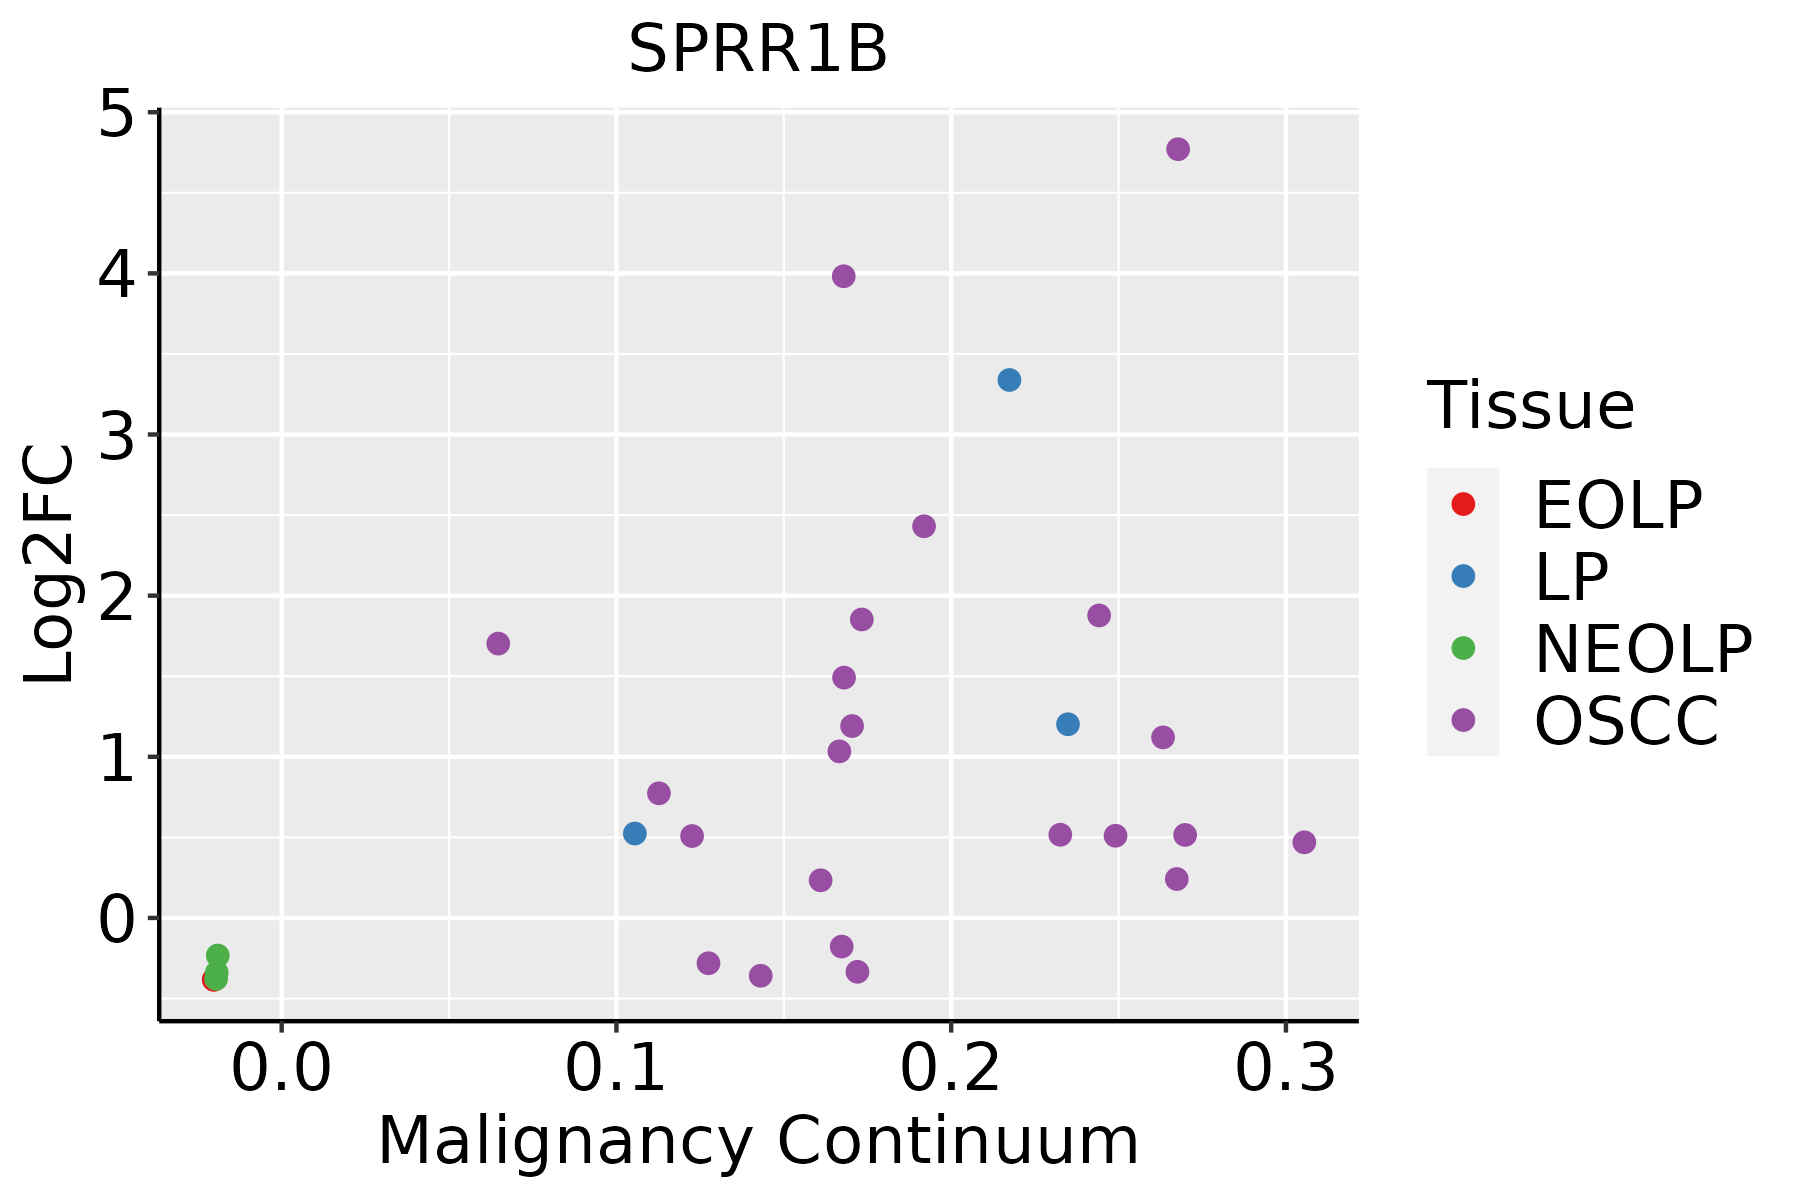 | EOLP: Erosive Oral lichen planus |
| LP: leukoplakia | ||
| NEOLP: Non-erosive oral lichen planus | ||
| OSCC: Oral squamous cell carcinoma | ||
| Skin |  | AK: Actinic keratosis |
| cSCC: Cutaneous squamous cell carcinoma | ||
| SCCIS:squamous cell carcinoma in situ |
| ∗log2FC in expression of this searched gene in stem-like cells from each diseased tissue sample relative to stem-like cells in normal samples in each tissue plotted against the malignancy continuum. Samples are colored based on if they are from different disease stage. |
Top |
Malignant transformation related pathway analysis |
| Find out the enriched GO biological processes and KEGG pathways involved in transition from healthy to precancer to cancer |
| Tissue | Disease Stage | Enriched GO biological Processes |
| Colorectum | AD |  |
| Colorectum | SER |  |
| Colorectum | MSS |  |
| Colorectum | MSI-H |  |
| Colorectum | FAP |  |
| ∗Top 15 enriched GO BP terms are showed in the bar plot of each disease state in each tissue. Each row represents a significant GO biological process which is colored according to the -log10(p.adjust). |
| Page: 1 2 3 4 5 6 7 8 9 |
| GO ID | Tissue | Disease Stage | Description | Gene Ratio | Bg Ratio | pvalue | p.adjust | Count |
| GO:00085446 | Cervix | CC | epidermis development | 83/2311 | 324/18723 | 3.91e-11 | 8.54e-09 | 83 |
| GO:00435884 | Cervix | CC | skin development | 71/2311 | 263/18723 | 8.04e-11 | 1.46e-08 | 71 |
| GO:00302164 | Cervix | CC | keratinocyte differentiation | 42/2311 | 139/18723 | 1.74e-08 | 1.28e-06 | 42 |
| GO:00099137 | Cervix | CC | epidermal cell differentiation | 53/2311 | 202/18723 | 5.48e-08 | 3.25e-06 | 53 |
| GO:00181493 | Cervix | CC | peptide cross-linking | 10/2311 | 35/18723 | 7.99e-03 | 4.18e-02 | 10 |
| GO:000854413 | Cervix | HSIL_HPV | epidermis development | 38/737 | 324/18723 | 1.92e-09 | 3.23e-07 | 38 |
| GO:003021611 | Cervix | HSIL_HPV | keratinocyte differentiation | 22/737 | 139/18723 | 2.53e-08 | 2.18e-06 | 22 |
| GO:004358813 | Cervix | HSIL_HPV | skin development | 31/737 | 263/18723 | 5.32e-08 | 3.89e-06 | 31 |
| GO:000991313 | Cervix | HSIL_HPV | epidermal cell differentiation | 26/737 | 202/18723 | 1.10e-07 | 7.15e-06 | 26 |
| GO:00181491 | Cervix | HSIL_HPV | peptide cross-linking | 8/737 | 35/18723 | 5.08e-05 | 1.26e-03 | 8 |
| GO:00435888 | Esophagus | ESCC | skin development | 163/8552 | 263/18723 | 6.48e-08 | 1.14e-06 | 163 |
| GO:000854410 | Esophagus | ESCC | epidermis development | 193/8552 | 324/18723 | 2.87e-07 | 4.19e-06 | 193 |
| GO:000991310 | Esophagus | ESCC | epidermal cell differentiation | 122/8552 | 202/18723 | 1.69e-05 | 1.51e-04 | 122 |
| GO:00302167 | Esophagus | ESCC | keratinocyte differentiation | 86/8552 | 139/18723 | 8.53e-05 | 6.19e-04 | 86 |
| GO:00435887 | Oral cavity | OSCC | skin development | 143/7305 | 263/18723 | 2.77e-07 | 4.27e-06 | 143 |
| GO:00085449 | Oral cavity | OSCC | epidermis development | 171/7305 | 324/18723 | 2.89e-07 | 4.43e-06 | 171 |
| GO:00302166 | Oral cavity | OSCC | keratinocyte differentiation | 81/7305 | 139/18723 | 3.16e-06 | 3.81e-05 | 81 |
| GO:00099139 | Oral cavity | OSCC | epidermal cell differentiation | 109/7305 | 202/18723 | 1.08e-05 | 1.14e-04 | 109 |
| GO:000854416 | Oral cavity | LP | epidermis development | 112/4623 | 324/18723 | 3.81e-05 | 5.61e-04 | 112 |
| GO:004358816 | Oral cavity | LP | skin development | 93/4623 | 263/18723 | 6.47e-05 | 8.70e-04 | 93 |
| Page: 1 2 |
| Pathway ID | Tissue | Disease Stage | Description | Gene Ratio | Bg Ratio | pvalue | p.adjust | qvalue | Count |
| Page: 1 |
Top |
Cell-cell communication analysis |
| Identification of potential cell-cell interactions between two cell types and their ligand-receptor pairs for different disease states |
| Ligand | Receptor | LRpair | Pathway | Tissue | Disease Stage |
| Page: 1 |
Top |
Single-cell gene regulatory network inference analysis |
| Find out the significant the regulons (TFs) and the target genes of each regulon across cell types for different disease states |
| TF | Cell Type | Tissue | Disease Stage | Target Gene | RSS | Regulon Activity |
| ∗The dot plots of a searched regulon are shown for all cell subpopulations in each disease state of each tissue based on the regulon specific score inferred using pySCENIC and by calculating the average expression. |
| Page: 1 |
Top |
Somatic mutation of malignant transformation related genes |
| Annotation of somatic variants for genes involved in malignant transformation |
| Hugo Symbol | Variant Class | Variant Classification | dbSNP RS | HGVSc | HGVSp | HGVSp Short | SWISSPROT | BIOTYPE | SIFT | PolyPhen | Tumor Sample Barcode | Tissue | Histology | Sex | Age | Stage | Therapy Types | Drugs | Outcome |
| SPRR1B | SNV | Missense_Mutation | novel | c.211G>A | p.Glu71Lys | p.E71K | P22528 | protein_coding | deleterious(0.01) | possibly_damaging(0.9) | TCGA-DS-A1OB-01 | Cervix | cervical & endocervical cancer | Female | <65 | I/II | Chemotherapy | carboplatin | PD |
| SPRR1B | SNV | Missense_Mutation | c.184C>A | p.Pro62Thr | p.P62T | P22528 | protein_coding | deleterious(0) | probably_damaging(0.999) | TCGA-DM-A1HA-01 | Colorectum | colon adenocarcinoma | Male | >=65 | III/IV | Unknown | Unknown | SD | |
| SPRR1B | SNV | Missense_Mutation | c.250N>A | p.Gln84Lys | p.Q84K | P22528 | protein_coding | deleterious(0.01) | possibly_damaging(0.672) | TCGA-DY-A1DG-01 | Colorectum | rectum adenocarcinoma | Male | >=65 | I/II | Unknown | Unknown | PD | |
| SPRR1B | SNV | Missense_Mutation | novel | c.204G>T | p.Lys68Asn | p.K68N | P22528 | protein_coding | deleterious(0.03) | possibly_damaging(0.815) | TCGA-EO-A22T-01 | Endometrium | uterine corpus endometrioid carcinoma | Female | <65 | I/II | Unknown | Unknown | SD |
| SPRR1B | SNV | Missense_Mutation | c.70N>T | p.Pro24Ser | p.P24S | P22528 | protein_coding | deleterious(0) | possibly_damaging(0.619) | TCGA-DD-A3A6-01 | Liver | liver hepatocellular carcinoma | Female | >=65 | I/II | Unknown | Unknown | SD | |
| SPRR1B | SNV | Missense_Mutation | rs201420448 | c.59N>C | p.Gln20Pro | p.Q20P | P22528 | protein_coding | deleterious(0) | probably_damaging(0.927) | TCGA-DD-AACA-01 | Liver | liver hepatocellular carcinoma | Male | >=65 | I/II | Unknown | Unknown | PD |
| SPRR1B | SNV | Missense_Mutation | novel | c.47N>C | p.Leu16Pro | p.L16P | P22528 | protein_coding | tolerated(0.38) | benign(0) | TCGA-05-4424-01 | Lung | lung adenocarcinoma | Male | >=65 | I/II | Targeted Molecular therapy | erlotinib | SD |
| SPRR1B | SNV | Missense_Mutation | c.139N>C | p.Glu47Gln | p.E47Q | P22528 | protein_coding | tolerated(0.41) | probably_damaging(0.998) | TCGA-53-7624-01 | Lung | lung adenocarcinoma | Female | <65 | III/IV | Chemotherapy | cisplatin | PD | |
| SPRR1B | SNV | Missense_Mutation | c.13N>G | p.Gln5Glu | p.Q5E | P22528 | protein_coding | deleterious(0.03) | benign(0.078) | TCGA-99-8028-01 | Lung | lung adenocarcinoma | Female | <65 | I/II | Unknown | Unknown | SD | |
| SPRR1B | SNV | Missense_Mutation | rs781282352 | c.157N>A | p.Val53Met | p.V53M | P22528 | protein_coding | tolerated(0.05) | possibly_damaging(0.888) | TCGA-CR-7388-01 | Oral cavity | head & neck squamous cell carcinoma | Female | >=65 | I/II | Chemotherapy | carboplatin | PD |
| Page: 1 2 |
Top |
Related drugs of malignant transformation related genes |
| Identification of chemicals and drugs interact with genes involved in malignant transfromation |
| (DGIdb 4.0) |
| Entrez ID | Symbol | Category | Interaction Types | Drug Claim Name | Drug Name | PMIDs |
| Page: 1 |

Copyright 2023-Present -The University of Texas Health Science Center at Houston |