
|
|||||
|
 | |
| |
| |
| |
| |
| |
|
Gene: SPRR1A |
Gene summary for SPRR1A |
| Gene information | Species | Human | Gene symbol | SPRR1A | Gene ID | 6698 |
| Gene name | small proline rich protein 1A | |
| Gene Alias | SPRK | |
| Cytomap | 1q21.3 | |
| Gene Type | protein-coding | GO ID | GO:0006464 | UniProtAcc | P35321 |
Top |
Malignant transformation analysis |
| Identification of the aberrant gene expression in precancerous and cancerous lesions by comparing the gene expression of stem-like cells in diseased tissues with normal stem cells |
| Entrez ID | Symbol | Replicates | Species | Organ | Tissue | Adj P-value | Log2FC | Malignancy |
| 6698 | SPRR1A | LZE20T | Human | Esophagus | ESCC | 4.98e-02 | 2.48e-01 | 0.0662 |
| 6698 | SPRR1A | LZE22T | Human | Esophagus | ESCC | 1.57e-02 | 2.20e-01 | 0.068 |
| 6698 | SPRR1A | LZE21T | Human | Esophagus | ESCC | 1.16e-05 | 7.89e-01 | 0.0655 |
| 6698 | SPRR1A | P1T-E | Human | Esophagus | ESCC | 1.09e-04 | 7.21e-01 | 0.0875 |
| 6698 | SPRR1A | P4T-E | Human | Esophagus | ESCC | 2.90e-03 | 3.55e-01 | 0.1323 |
| 6698 | SPRR1A | P9T-E | Human | Esophagus | ESCC | 1.45e-04 | 3.59e-01 | 0.1131 |
| 6698 | SPRR1A | P20T-E | Human | Esophagus | ESCC | 2.18e-03 | 3.77e-01 | 0.1124 |
| 6698 | SPRR1A | P23T-E | Human | Esophagus | ESCC | 2.12e-16 | 1.13e+00 | 0.108 |
| 6698 | SPRR1A | P28T-E | Human | Esophagus | ESCC | 9.35e-10 | 1.16e+00 | 0.1149 |
| 6698 | SPRR1A | P42T-E | Human | Esophagus | ESCC | 2.20e-07 | 6.71e-01 | 0.1175 |
| 6698 | SPRR1A | P47T-E | Human | Esophagus | ESCC | 1.66e-02 | 1.79e-01 | 0.1067 |
| 6698 | SPRR1A | P84T-E | Human | Esophagus | ESCC | 1.67e-05 | 1.80e+00 | 0.0933 |
| 6698 | SPRR1A | P107T-E | Human | Esophagus | ESCC | 2.08e-09 | 6.09e-01 | 0.171 |
| 6698 | SPRR1A | P127T-E | Human | Esophagus | ESCC | 4.60e-16 | 7.00e-01 | 0.0826 |
| 6698 | SPRR1A | P128T-E | Human | Esophagus | ESCC | 2.28e-28 | 1.65e+00 | 0.1241 |
| Page: 1 |
| Tissue | Expression Dynamics | Abbreviation |
| Esophagus | 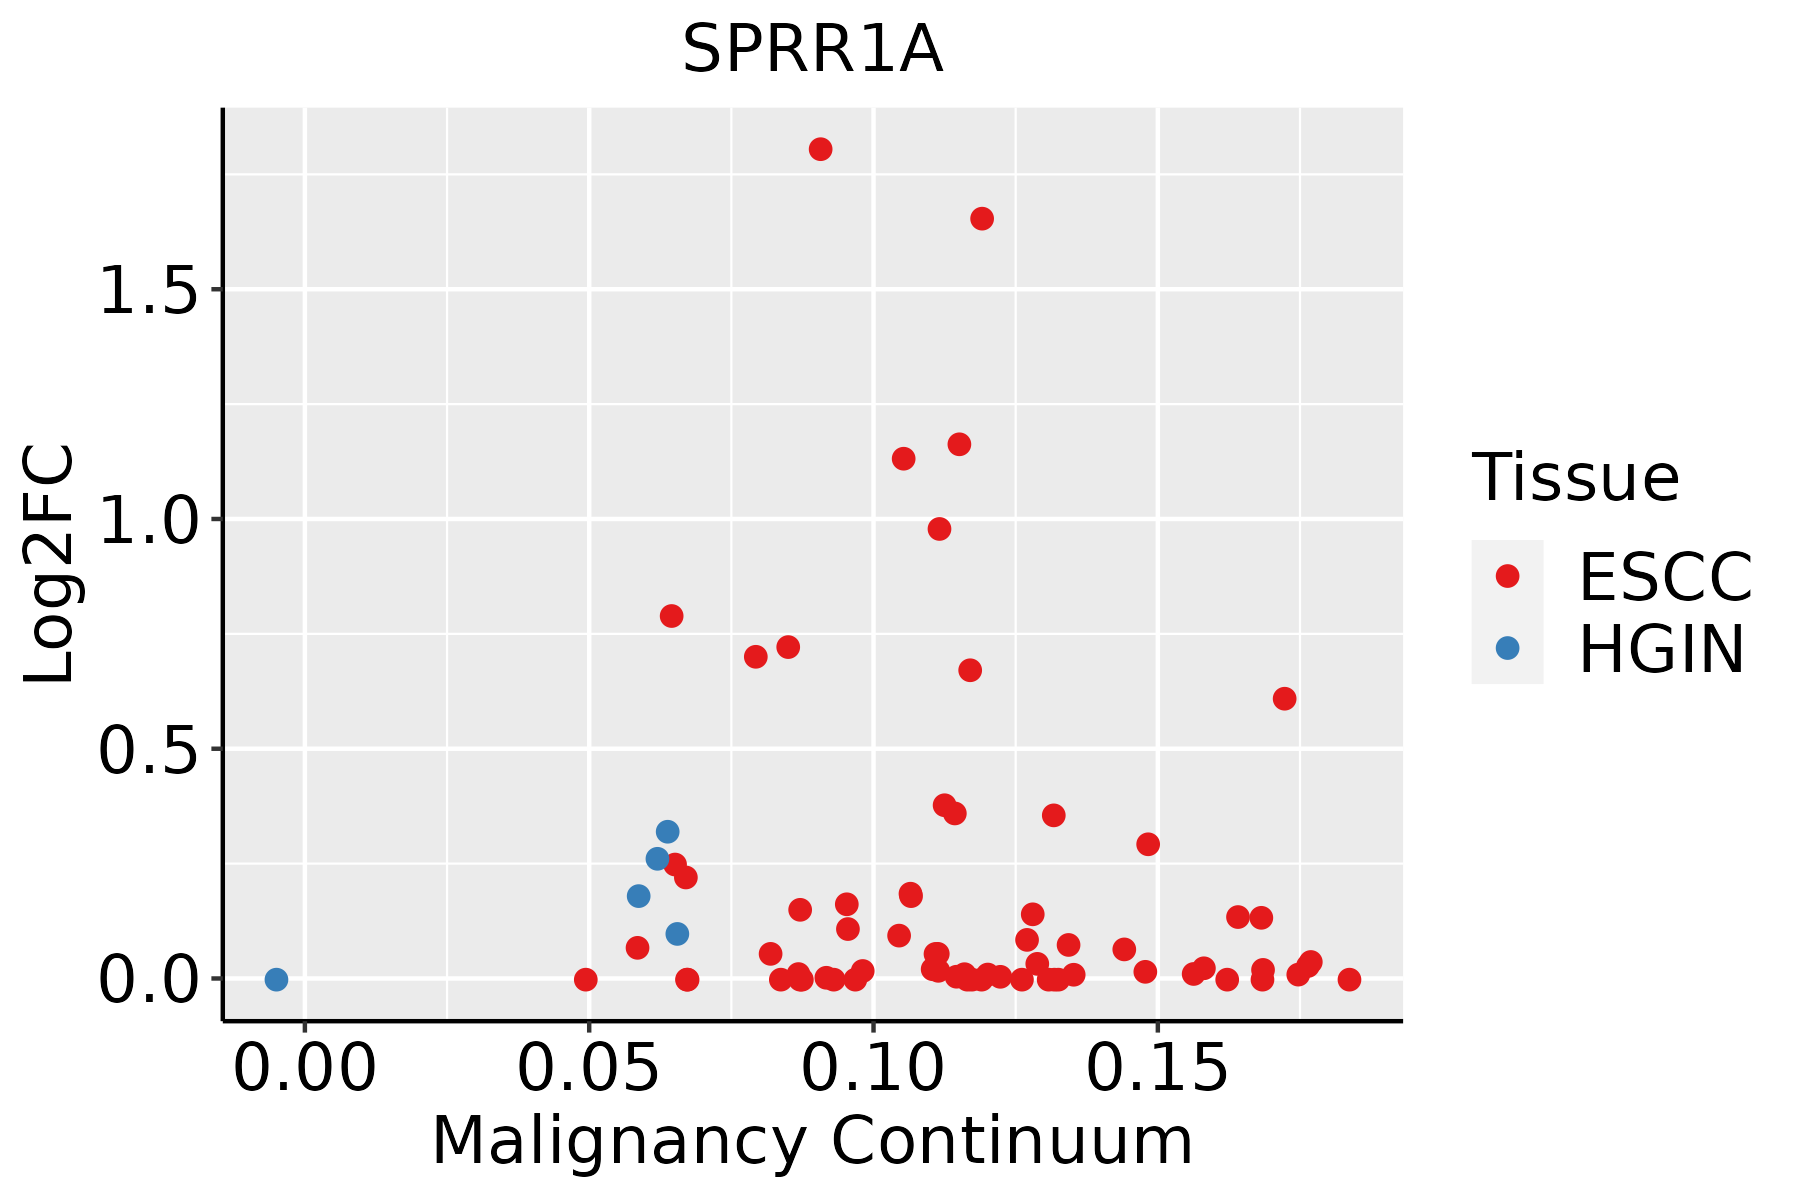 | ESCC: Esophageal squamous cell carcinoma |
| HGIN: High-grade intraepithelial neoplasias | ||
| LGIN: Low-grade intraepithelial neoplasias |
| ∗log2FC in expression of this searched gene in stem-like cells from each diseased tissue sample relative to stem-like cells in normal samples in each tissue plotted against the malignancy continuum. Samples are colored based on if they are from different disease stage. |
Top |
Malignant transformation related pathway analysis |
| Find out the enriched GO biological processes and KEGG pathways involved in transition from healthy to precancer to cancer |
| Tissue | Disease Stage | Enriched GO biological Processes |
| Colorectum | AD |  |
| Colorectum | SER |  |
| Colorectum | MSS |  |
| Colorectum | MSI-H |  |
| Colorectum | FAP |  |
| ∗Top 15 enriched GO BP terms are showed in the bar plot of each disease state in each tissue. Each row represents a significant GO biological process which is colored according to the -log10(p.adjust). |
| Page: 1 2 3 4 5 6 7 8 9 |
| GO ID | Tissue | Disease Stage | Description | Gene Ratio | Bg Ratio | pvalue | p.adjust | Count |
| GO:00435888 | Esophagus | ESCC | skin development | 163/8552 | 263/18723 | 6.48e-08 | 1.14e-06 | 163 |
| GO:000854410 | Esophagus | ESCC | epidermis development | 193/8552 | 324/18723 | 2.87e-07 | 4.19e-06 | 193 |
| GO:000991310 | Esophagus | ESCC | epidermal cell differentiation | 122/8552 | 202/18723 | 1.69e-05 | 1.51e-04 | 122 |
| GO:00302167 | Esophagus | ESCC | keratinocyte differentiation | 86/8552 | 139/18723 | 8.53e-05 | 6.19e-04 | 86 |
| Page: 1 |
| Pathway ID | Tissue | Disease Stage | Description | Gene Ratio | Bg Ratio | pvalue | p.adjust | qvalue | Count |
| Page: 1 |
Top |
Cell-cell communication analysis |
| Identification of potential cell-cell interactions between two cell types and their ligand-receptor pairs for different disease states |
| Ligand | Receptor | LRpair | Pathway | Tissue | Disease Stage |
| Page: 1 |
Top |
Single-cell gene regulatory network inference analysis |
| Find out the significant the regulons (TFs) and the target genes of each regulon across cell types for different disease states |
| TF | Cell Type | Tissue | Disease Stage | Target Gene | RSS | Regulon Activity |
| ∗The dot plots of a searched regulon are shown for all cell subpopulations in each disease state of each tissue based on the regulon specific score inferred using pySCENIC and by calculating the average expression. |
| Page: 1 |
Top |
Somatic mutation of malignant transformation related genes |
| Annotation of somatic variants for genes involved in malignant transformation |
| Hugo Symbol | Variant Class | Variant Classification | dbSNP RS | HGVSc | HGVSp | HGVSp Short | SWISSPROT | BIOTYPE | SIFT | PolyPhen | Tumor Sample Barcode | Tissue | Histology | Sex | Age | Stage | Therapy Types | Drugs | Outcome |
| SPRR1A | insertion | Nonsense_Mutation | novel | c.108_109insGTCTGGGTGGAGTGAAGGGAAAAAGTGATCCCAGAAGAAGGATT | p.Thr37ValfsTer5 | p.T37Vfs*5 | P35321 | protein_coding | TCGA-AR-A0TY-01 | Breast | breast invasive carcinoma | Female | <65 | I/II | Unspecific | Paclitaxel | PD | ||
| SPRR1A | SNV | Missense_Mutation | novel | c.128N>A | p.Pro43His | p.P43H | P35321 | protein_coding | deleterious(0) | probably_damaging(0.979) | TCGA-VS-A9UU-01 | Cervix | cervical & endocervical cancer | Female | <65 | I/II | Chemotherapy | cisplatin | CR |
| SPRR1A | SNV | Missense_Mutation | c.206N>C | p.Val69Ala | p.V69A | P35321 | protein_coding | tolerated(0.16) | benign(0.145) | TCGA-AA-3821-01 | Colorectum | colon adenocarcinoma | Female | >=65 | I/II | Unknown | Unknown | SD | |
| SPRR1A | SNV | Missense_Mutation | novel | c.8N>A | p.Ser3Tyr | p.S3Y | P35321 | protein_coding | deleterious(0) | probably_damaging(0.994) | TCGA-AJ-A3EL-01 | Endometrium | uterine corpus endometrioid carcinoma | Female | <65 | I/II | Unknown | Unknown | SD |
| SPRR1A | SNV | Missense_Mutation | novel | c.244N>T | p.Ala82Ser | p.A82S | P35321 | protein_coding | tolerated(0.26) | possibly_damaging(0.629) | TCGA-AX-A1C7-01 | Endometrium | uterine corpus endometrioid carcinoma | Female | >=65 | I/II | Chemotherapy | topotecan | SD |
| SPRR1A | SNV | Missense_Mutation | novel | c.66N>T | p.Lys22Asn | p.K22N | P35321 | protein_coding | deleterious(0.02) | probably_damaging(0.939) | TCGA-BC-A69I-01 | Liver | liver hepatocellular carcinoma | Male | >=65 | I/II | Unknown | Unknown | SD |
| SPRR1A | SNV | Missense_Mutation | c.158N>C | p.Val53Ala | p.V53A | P35321 | protein_coding | tolerated(0.28) | benign(0.031) | TCGA-UB-A7MB-01 | Liver | liver hepatocellular carcinoma | Male | <65 | I/II | Targeted Molecular therapy | sorafenib | PD | |
| SPRR1A | SNV | Missense_Mutation | rs199524880 | c.190C>A | p.Pro64Thr | p.P64T | P35321 | protein_coding | deleterious(0.03) | possibly_damaging(0.545) | TCGA-05-4410-01 | Lung | lung adenocarcinoma | Male | <65 | I/II | Unknown | Unknown | SD |
| SPRR1A | SNV | Missense_Mutation | rs527509026 | c.249G>C | p.Gln83His | p.Q83H | P35321 | protein_coding | deleterious(0.03) | benign(0.332) | TCGA-49-AAR3-01 | Lung | lung adenocarcinoma | Male | >=65 | I/II | Unknown | Unknown | PD |
| SPRR1A | SNV | Missense_Mutation | novel | c.41N>A | p.Pro14His | p.P14H | P35321 | protein_coding | deleterious(0.02) | probably_damaging(0.927) | TCGA-55-7281-01 | Lung | lung adenocarcinoma | Female | >=65 | I/II | Chemotherapy | carboplatin | PD |
| Page: 1 2 |
Top |
Related drugs of malignant transformation related genes |
| Identification of chemicals and drugs interact with genes involved in malignant transfromation |
| (DGIdb 4.0) |
| Entrez ID | Symbol | Category | Interaction Types | Drug Claim Name | Drug Name | PMIDs |
| Page: 1 |

Copyright 2023-Present -The University of Texas Health Science Center at Houston |