
|
|||||
|
 | |
| |
| |
| |
| |
| |
|
Gene: SPRED2 |
Gene summary for SPRED2 |
| Gene information | Species | Human | Gene symbol | SPRED2 | Gene ID | 200734 |
| Gene name | sprouty related EVH1 domain containing 2 | |
| Gene Alias | Spred-2 | |
| Cytomap | 2p14 | |
| Gene Type | protein-coding | GO ID | GO:0000165 | UniProtAcc | B3KPL5 |
Top |
Malignant transformation analysis |
| Identification of the aberrant gene expression in precancerous and cancerous lesions by comparing the gene expression of stem-like cells in diseased tissues with normal stem cells |
| Entrez ID | Symbol | Replicates | Species | Organ | Tissue | Adj P-value | Log2FC | Malignancy |
| 200734 | SPRED2 | HTA11_3410_2000001011 | Human | Colorectum | AD | 6.63e-05 | -3.90e-01 | 0.0155 |
| 200734 | SPRED2 | HTA11_347_2000001011 | Human | Colorectum | AD | 2.57e-03 | 4.27e-01 | -0.1954 |
| 200734 | SPRED2 | F007 | Human | Colorectum | FAP | 1.95e-07 | -5.05e-01 | 0.1176 |
| 200734 | SPRED2 | A001-C-207 | Human | Colorectum | FAP | 3.90e-03 | -1.57e-01 | 0.1278 |
| 200734 | SPRED2 | A015-C-203 | Human | Colorectum | FAP | 9.13e-32 | -6.44e-01 | -0.1294 |
| 200734 | SPRED2 | A015-C-204 | Human | Colorectum | FAP | 1.08e-07 | -4.28e-01 | -0.0228 |
| 200734 | SPRED2 | A014-C-040 | Human | Colorectum | FAP | 1.97e-04 | -5.01e-01 | -0.1184 |
| 200734 | SPRED2 | A002-C-201 | Human | Colorectum | FAP | 8.78e-18 | -5.29e-01 | 0.0324 |
| 200734 | SPRED2 | A001-C-119 | Human | Colorectum | FAP | 4.41e-10 | -5.78e-01 | -0.1557 |
| 200734 | SPRED2 | A001-C-108 | Human | Colorectum | FAP | 2.96e-21 | -4.10e-01 | -0.0272 |
| 200734 | SPRED2 | A002-C-205 | Human | Colorectum | FAP | 5.76e-23 | -5.76e-01 | -0.1236 |
| 200734 | SPRED2 | A001-C-104 | Human | Colorectum | FAP | 8.53e-04 | -2.77e-01 | 0.0184 |
| 200734 | SPRED2 | A015-C-005 | Human | Colorectum | FAP | 6.57e-07 | -4.55e-01 | -0.0336 |
| 200734 | SPRED2 | A015-C-006 | Human | Colorectum | FAP | 1.61e-16 | -6.00e-01 | -0.0994 |
| 200734 | SPRED2 | A015-C-106 | Human | Colorectum | FAP | 4.83e-15 | -3.72e-01 | -0.0511 |
| 200734 | SPRED2 | A002-C-114 | Human | Colorectum | FAP | 8.98e-19 | -5.59e-01 | -0.1561 |
| 200734 | SPRED2 | A015-C-104 | Human | Colorectum | FAP | 4.39e-38 | -7.06e-01 | -0.1899 |
| 200734 | SPRED2 | A001-C-014 | Human | Colorectum | FAP | 4.42e-14 | -4.05e-01 | 0.0135 |
| 200734 | SPRED2 | A002-C-016 | Human | Colorectum | FAP | 1.94e-22 | -5.06e-01 | 0.0521 |
| 200734 | SPRED2 | A015-C-002 | Human | Colorectum | FAP | 7.36e-12 | -5.80e-01 | -0.0763 |
| Page: 1 2 3 4 |
| Tissue | Expression Dynamics | Abbreviation |
| Colorectum (GSE201348) |  | FAP: Familial adenomatous polyposis |
| CRC: Colorectal cancer | ||
| Colorectum (HTA11) |  | AD: Adenomas |
| SER: Sessile serrated lesions | ||
| MSI-H: Microsatellite-high colorectal cancer | ||
| MSS: Microsatellite stable colorectal cancer | ||
| Lung | 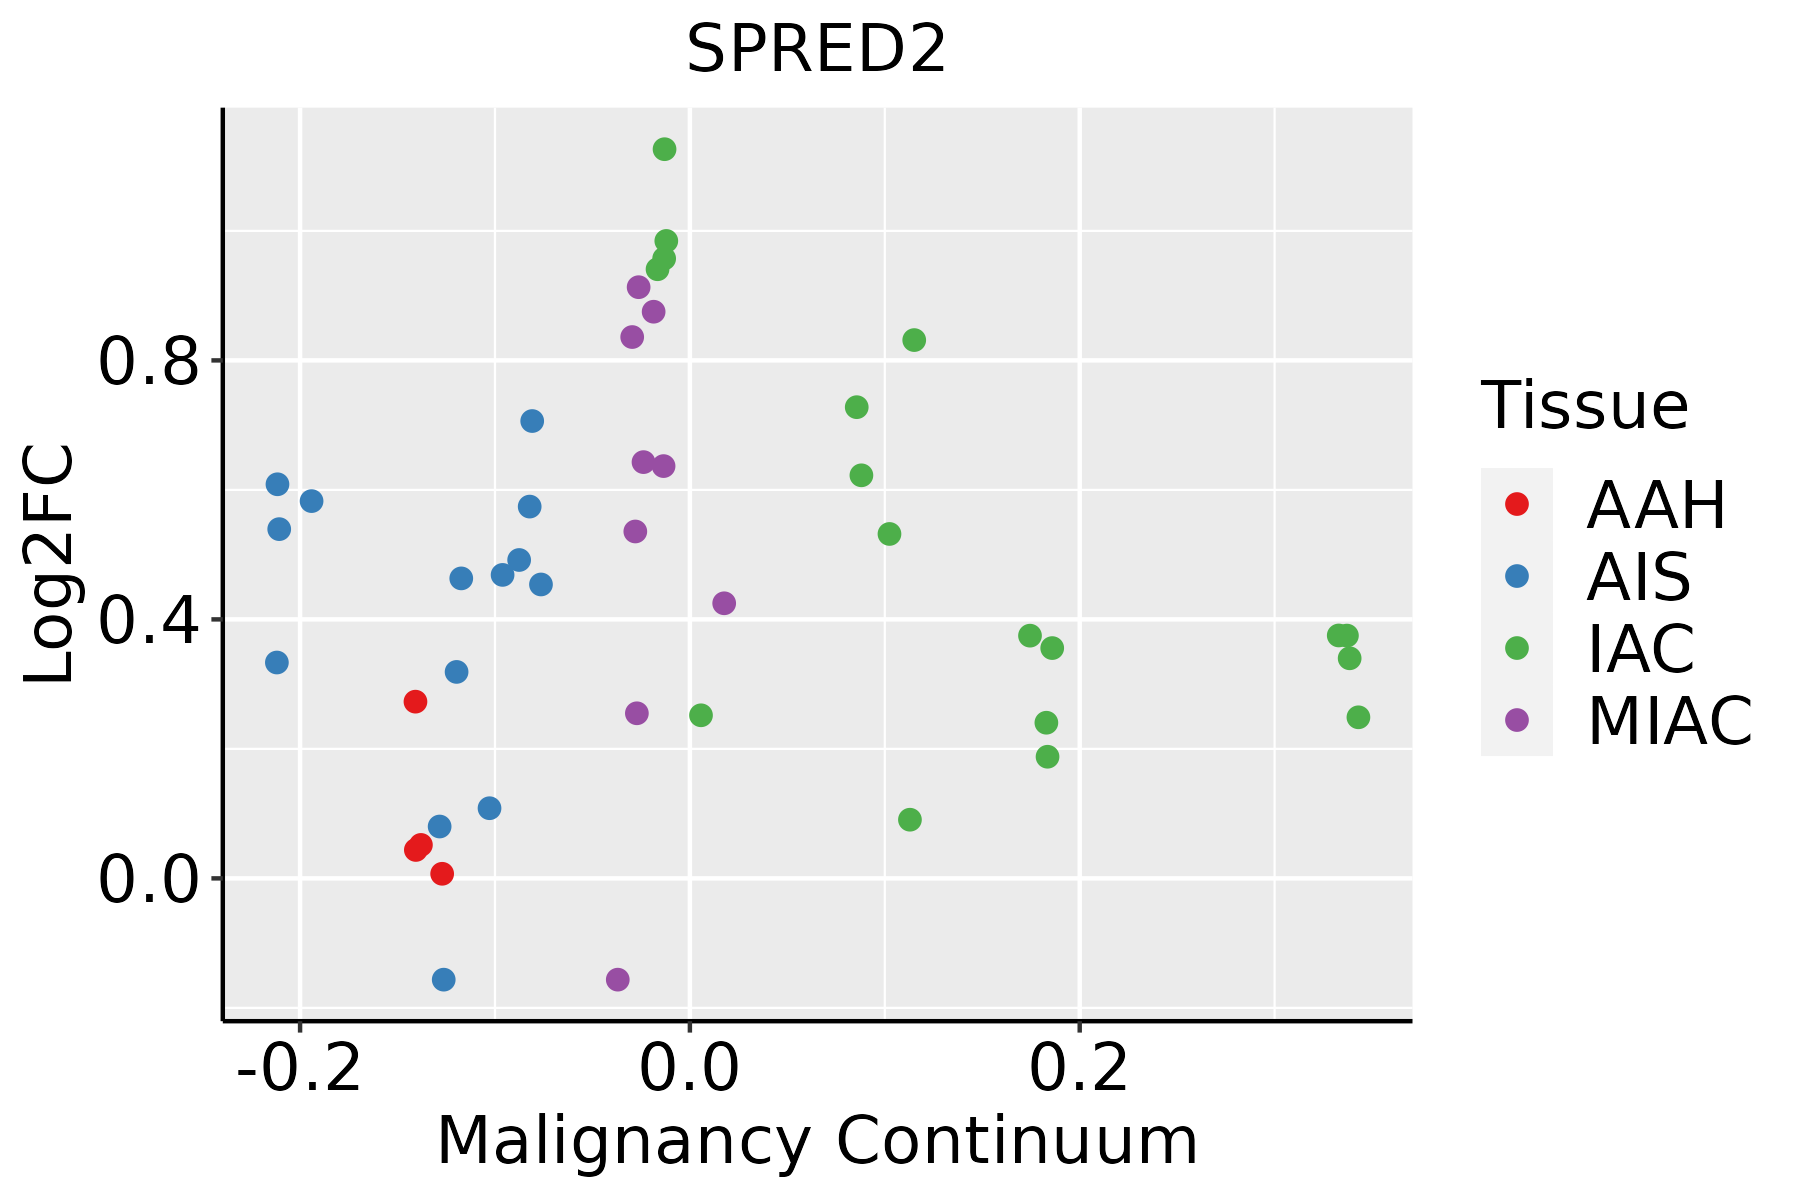 | AAH: Atypical adenomatous hyperplasia |
| AIS: Adenocarcinoma in situ | ||
| IAC: Invasive lung adenocarcinoma | ||
| MIA: Minimally invasive adenocarcinoma | ||
| Oral Cavity | 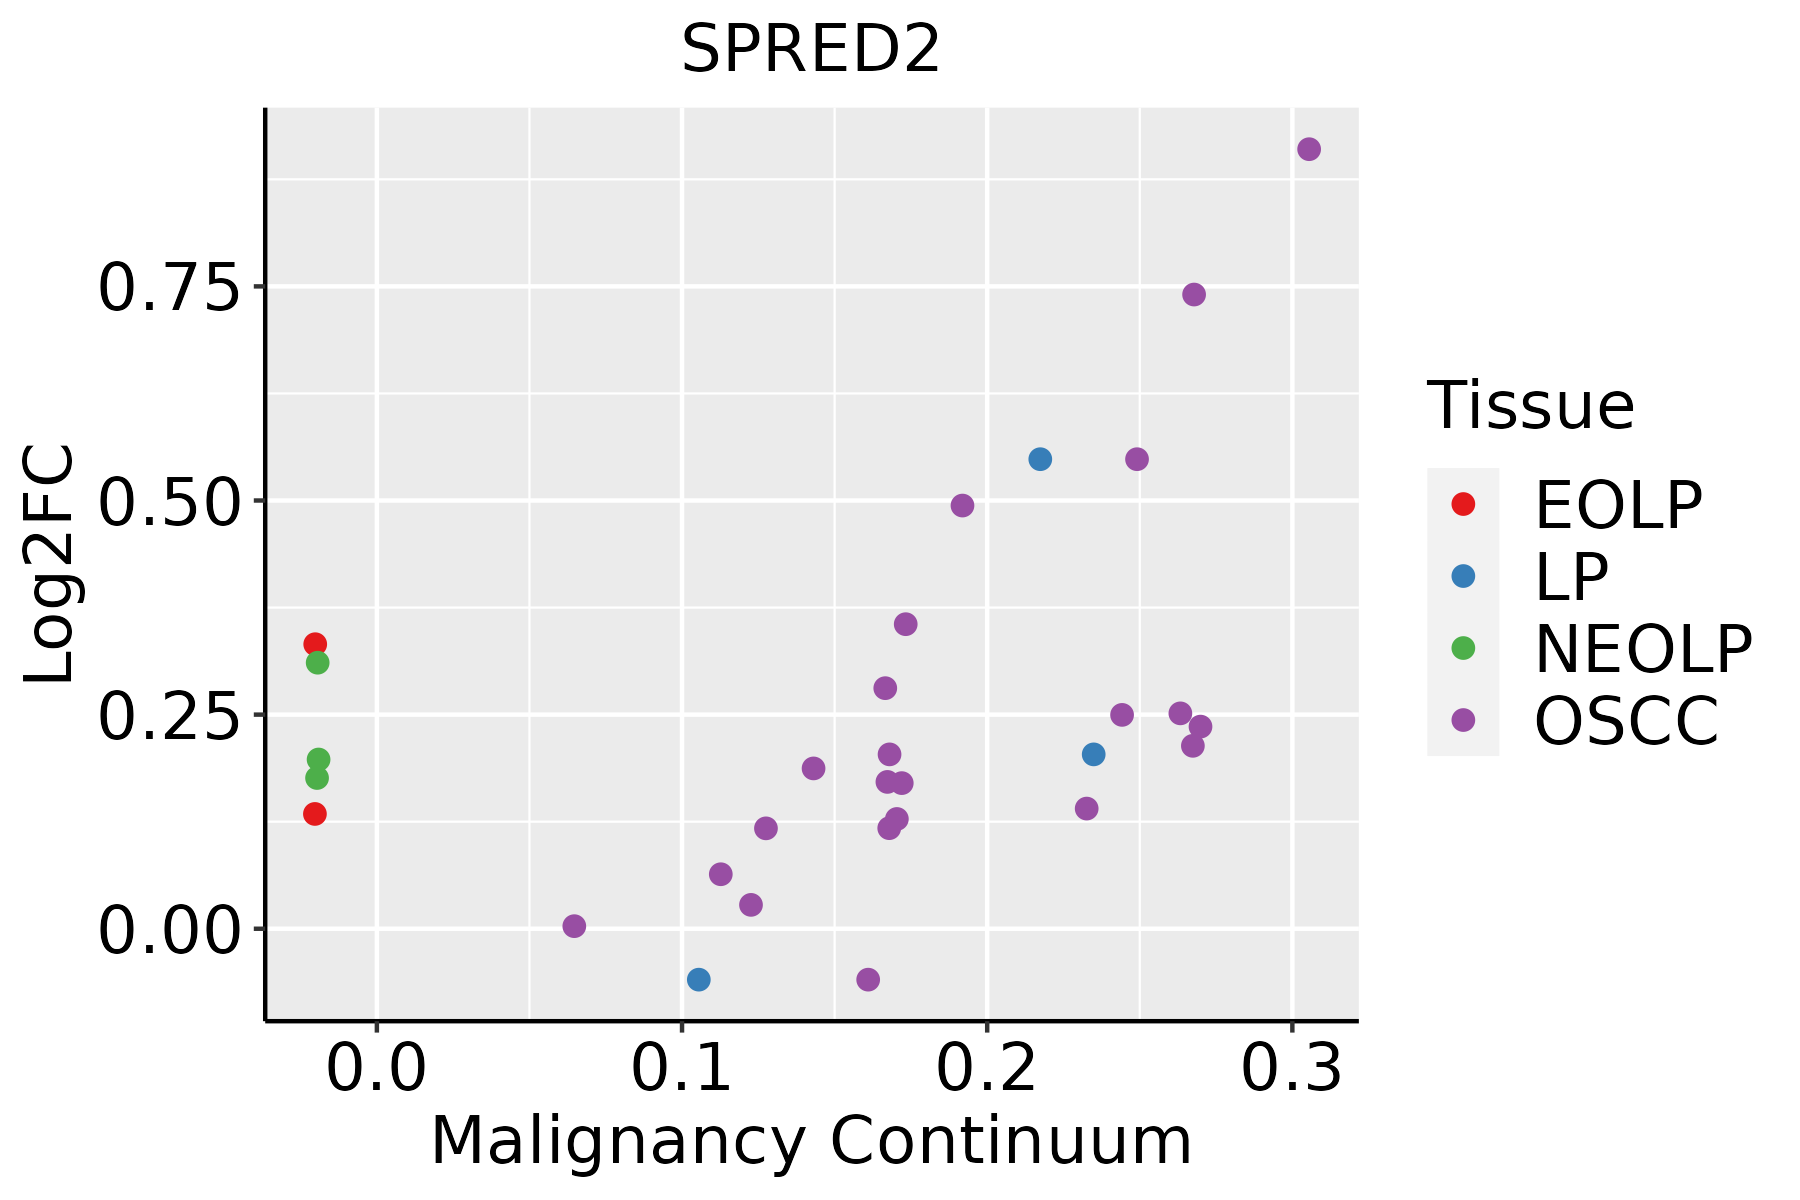 | EOLP: Erosive Oral lichen planus |
| LP: leukoplakia | ||
| NEOLP: Non-erosive oral lichen planus | ||
| OSCC: Oral squamous cell carcinoma | ||
| Prostate | 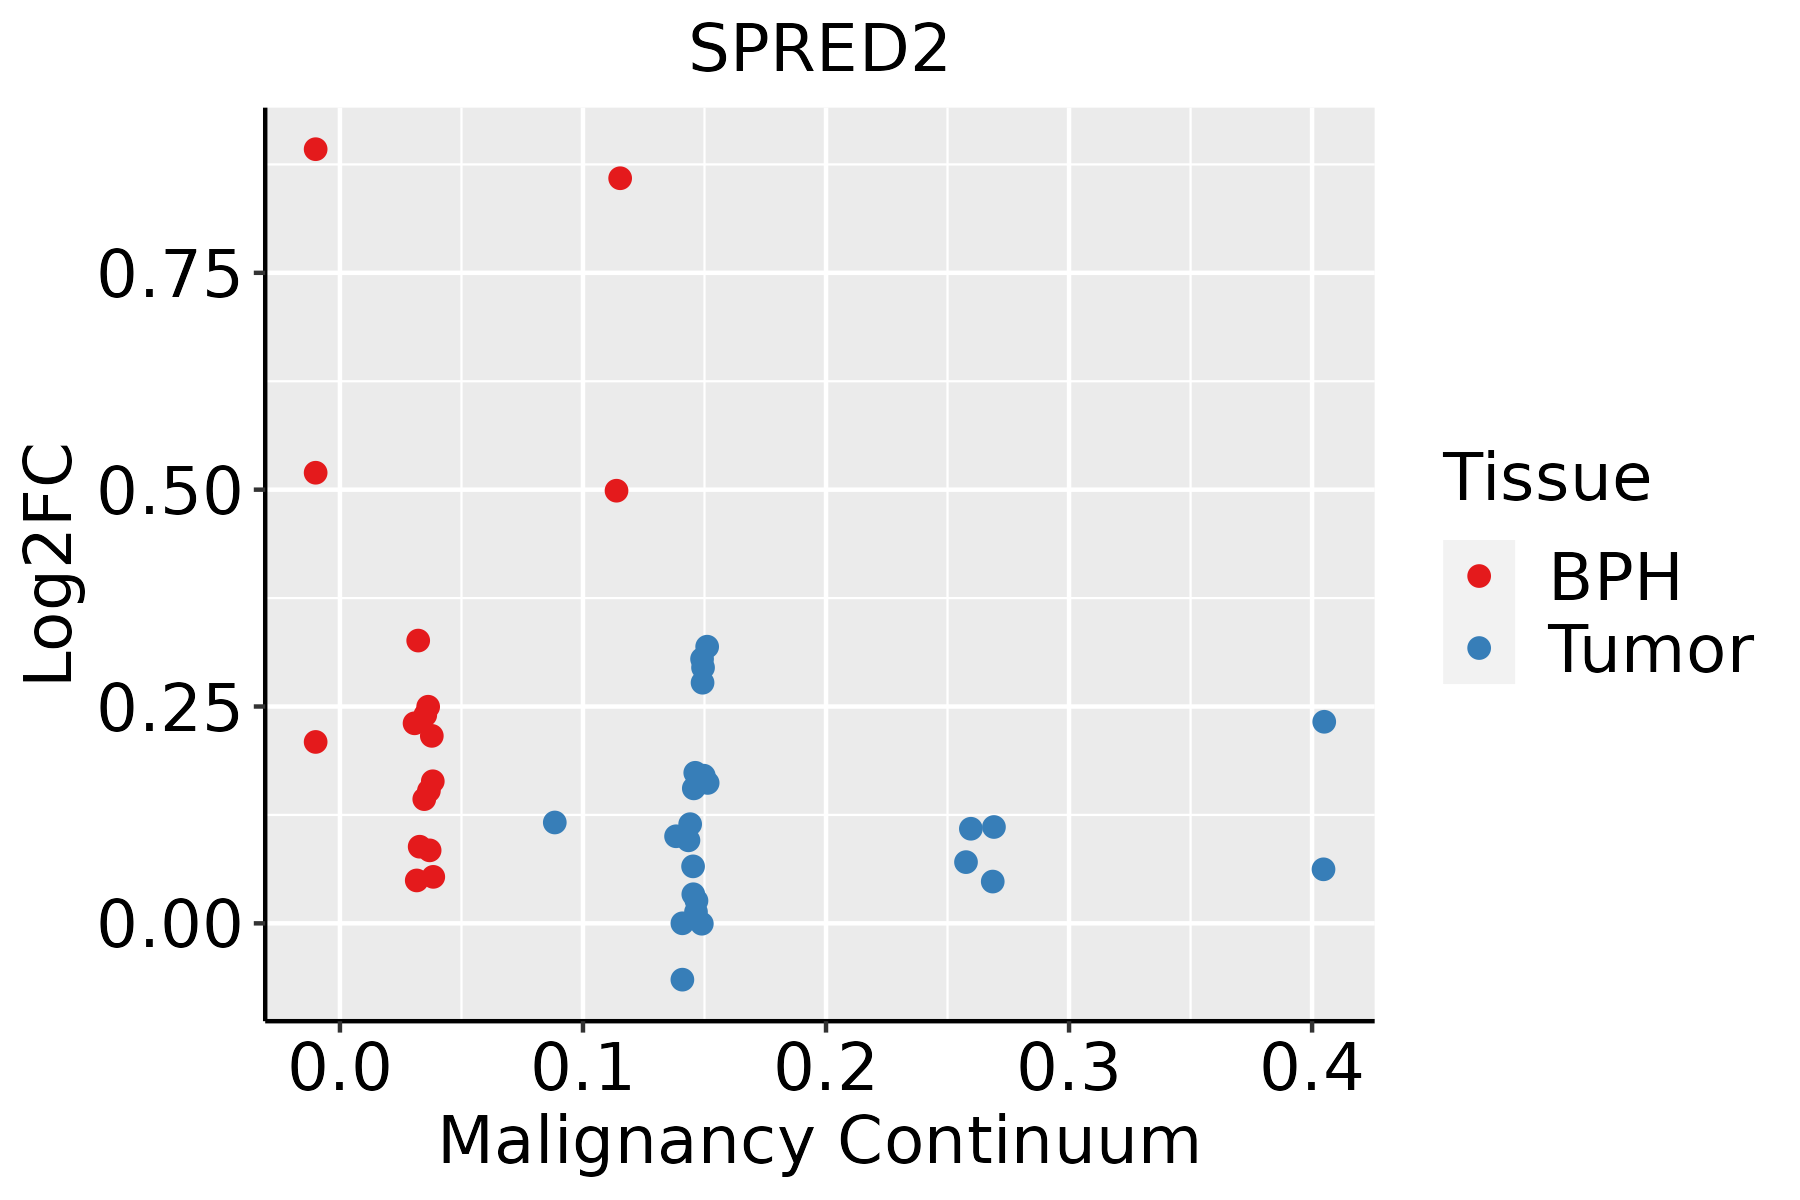 | BPH: Benign Prostatic Hyperplasia |
| ∗log2FC in expression of this searched gene in stem-like cells from each diseased tissue sample relative to stem-like cells in normal samples in each tissue plotted against the malignancy continuum. Samples are colored based on if they are from different disease stage. |
Top |
Malignant transformation related pathway analysis |
| Find out the enriched GO biological processes and KEGG pathways involved in transition from healthy to precancer to cancer |
| Tissue | Disease Stage | Enriched GO biological Processes |
| Colorectum | AD |  |
| Colorectum | SER |  |
| Colorectum | MSS |  |
| Colorectum | MSI-H |  |
| Colorectum | FAP |  |
| ∗Top 15 enriched GO BP terms are showed in the bar plot of each disease state in each tissue. Each row represents a significant GO biological process which is colored according to the -log10(p.adjust). |
| Page: 1 2 3 4 5 6 7 8 9 |
| GO ID | Tissue | Disease Stage | Description | Gene Ratio | Bg Ratio | pvalue | p.adjust | Count |
| GO:0072331 | Colorectum | AD | signal transduction by p53 class mediator | 58/3918 | 163/18723 | 1.04e-05 | 2.40e-04 | 58 |
| GO:0010563 | Colorectum | AD | negative regulation of phosphorus metabolic process | 130/3918 | 442/18723 | 1.26e-05 | 2.76e-04 | 130 |
| GO:0045936 | Colorectum | AD | negative regulation of phosphate metabolic process | 129/3918 | 441/18723 | 1.81e-05 | 3.76e-04 | 129 |
| GO:2001020 | Colorectum | AD | regulation of response to DNA damage stimulus | 71/3918 | 219/18723 | 4.38e-05 | 7.65e-04 | 71 |
| GO:1901796 | Colorectum | AD | regulation of signal transduction by p53 class mediator | 36/3918 | 93/18723 | 6.58e-05 | 1.07e-03 | 36 |
| GO:0042326 | Colorectum | AD | negative regulation of phosphorylation | 112/3918 | 385/18723 | 8.02e-05 | 1.27e-03 | 112 |
| GO:0001933 | Colorectum | AD | negative regulation of protein phosphorylation | 101/3918 | 342/18723 | 9.39e-05 | 1.42e-03 | 101 |
| GO:1901798 | Colorectum | AD | positive regulation of signal transduction by p53 class mediator | 14/3918 | 25/18723 | 1.27e-04 | 1.83e-03 | 14 |
| GO:0043409 | Colorectum | AD | negative regulation of MAPK cascade | 57/3918 | 180/18723 | 4.61e-04 | 5.14e-03 | 57 |
| GO:0007178 | Colorectum | AD | transmembrane receptor protein serine/threonine kinase signaling pathway | 99/3918 | 355/18723 | 9.92e-04 | 9.28e-03 | 99 |
| GO:2001022 | Colorectum | AD | positive regulation of response to DNA damage stimulus | 36/3918 | 105/18723 | 1.02e-03 | 9.47e-03 | 36 |
| GO:0071559 | Colorectum | AD | response to transforming growth factor beta | 74/3918 | 256/18723 | 1.45e-03 | 1.23e-02 | 74 |
| GO:0071560 | Colorectum | AD | cellular response to transforming growth factor beta stimulus | 72/3918 | 250/18723 | 1.85e-03 | 1.52e-02 | 72 |
| GO:0007179 | Colorectum | AD | transforming growth factor beta receptor signaling pathway | 59/3918 | 198/18723 | 1.94e-03 | 1.58e-02 | 59 |
| GO:0018210 | Colorectum | AD | peptidyl-threonine modification | 40/3918 | 125/18723 | 2.44e-03 | 1.88e-02 | 40 |
| GO:0018107 | Colorectum | AD | peptidyl-threonine phosphorylation | 37/3918 | 116/18723 | 3.68e-03 | 2.61e-02 | 37 |
| GO:0030330 | Colorectum | AD | DNA damage response, signal transduction by p53 class mediator | 25/3918 | 72/18723 | 4.65e-03 | 3.16e-02 | 25 |
| GO:00715591 | Colorectum | FAP | response to transforming growth factor beta | 63/2622 | 256/18723 | 3.82e-06 | 1.32e-04 | 63 |
| GO:00071782 | Colorectum | FAP | transmembrane receptor protein serine/threonine kinase signaling pathway | 81/2622 | 355/18723 | 4.28e-06 | 1.46e-04 | 81 |
| GO:00715601 | Colorectum | FAP | cellular response to transforming growth factor beta stimulus | 61/2622 | 250/18723 | 7.22e-06 | 2.19e-04 | 61 |
| Page: 1 2 3 4 5 6 7 8 9 10 11 12 13 14 15 16 |
| Pathway ID | Tissue | Disease Stage | Description | Gene Ratio | Bg Ratio | pvalue | p.adjust | qvalue | Count |
| Page: 1 |
Top |
Cell-cell communication analysis |
| Identification of potential cell-cell interactions between two cell types and their ligand-receptor pairs for different disease states |
| Ligand | Receptor | LRpair | Pathway | Tissue | Disease Stage |
| Page: 1 |
Top |
Single-cell gene regulatory network inference analysis |
| Find out the significant the regulons (TFs) and the target genes of each regulon across cell types for different disease states |
| TF | Cell Type | Tissue | Disease Stage | Target Gene | RSS | Regulon Activity |
| ∗The dot plots of a searched regulon are shown for all cell subpopulations in each disease state of each tissue based on the regulon specific score inferred using pySCENIC and by calculating the average expression. |
| Page: 1 |
Top |
Somatic mutation of malignant transformation related genes |
| Annotation of somatic variants for genes involved in malignant transformation |
| Hugo Symbol | Variant Class | Variant Classification | dbSNP RS | HGVSc | HGVSp | HGVSp Short | SWISSPROT | BIOTYPE | SIFT | PolyPhen | Tumor Sample Barcode | Tissue | Histology | Sex | Age | Stage | Therapy Types | Drugs | Outcome |
| SPRED2 | SNV | Missense_Mutation | novel | c.1181N>C | p.Tyr394Ser | p.Y394S | Q7Z698 | protein_coding | deleterious(0) | probably_damaging(1) | TCGA-A2-A0T2-01 | Breast | breast invasive carcinoma | Female | >=65 | III/IV | Chemotherapy | xeloda | PD |
| SPRED2 | insertion | Frame_Shift_Ins | rs754129301 | c.301_302insA | p.Thr101AsnfsTer7 | p.T101Nfs*7 | Q7Z698 | protein_coding | TCGA-LL-A740-01 | Breast | breast invasive carcinoma | Female | <65 | I/II | Chemotherapy | adriamycin | CR | ||
| SPRED2 | SNV | Missense_Mutation | c.188G>A | p.Arg63Gln | p.R63Q | Q7Z698 | protein_coding | tolerated(0.05) | probably_damaging(1) | TCGA-Q1-A6DW-01 | Cervix | cervical & endocervical cancer | Female | <65 | I/II | Chemotherapy | cisplatin | SD | |
| SPRED2 | SNV | Missense_Mutation | c.1102N>A | p.Asp368Asn | p.D368N | Q7Z698 | protein_coding | deleterious(0) | probably_damaging(1) | TCGA-AA-3672-01 | Colorectum | colon adenocarcinoma | Female | >=65 | III/IV | Unknown | Unknown | SD | |
| SPRED2 | SNV | Missense_Mutation | c.1223N>T | p.Arg408Met | p.R408M | Q7Z698 | protein_coding | deleterious(0.03) | possibly_damaging(0.806) | TCGA-AA-3715-01 | Colorectum | colon adenocarcinoma | Male | >=65 | I/II | Unknown | Unknown | PD | |
| SPRED2 | SNV | Missense_Mutation | rs749197715 | c.43C>T | p.Arg15Cys | p.R15C | Q7Z698 | protein_coding | deleterious(0) | probably_damaging(1) | TCGA-AA-3947-01 | Colorectum | colon adenocarcinoma | Female | <65 | I/II | Unknown | Unknown | SD |
| SPRED2 | SNV | Missense_Mutation | c.895N>T | p.Arg299Trp | p.R299W | Q7Z698 | protein_coding | deleterious(0) | probably_damaging(0.962) | TCGA-AA-A01R-01 | Colorectum | colon adenocarcinoma | Male | <65 | III/IV | Chemotherapy | 5-fluorouracil | PD | |
| SPRED2 | SNV | Missense_Mutation | c.628N>A | p.Asp210Asn | p.D210N | Q7Z698 | protein_coding | deleterious(0) | possibly_damaging(0.704) | TCGA-CM-6162-01 | Colorectum | colon adenocarcinoma | Female | <65 | III/IV | Chemotherapy | oxaliplatin | SD | |
| SPRED2 | SNV | Missense_Mutation | c.115N>G | p.Ser39Gly | p.S39G | Q7Z698 | protein_coding | deleterious(0) | possibly_damaging(0.854) | TCGA-D5-6540-01 | Colorectum | colon adenocarcinoma | Male | >=65 | I/II | Unknown | Unknown | SD | |
| SPRED2 | SNV | Missense_Mutation | rs754327382 | c.677C>T | p.Thr226Met | p.T226M | Q7Z698 | protein_coding | tolerated(0.05) | probably_damaging(0.981) | TCGA-F4-6856-01 | Colorectum | colon adenocarcinoma | Male | <65 | I/II | Ancillary | leucovorin | CR |
| Page: 1 2 3 4 5 6 |
Top |
Related drugs of malignant transformation related genes |
| Identification of chemicals and drugs interact with genes involved in malignant transfromation |
| (DGIdb 4.0) |
| Entrez ID | Symbol | Category | Interaction Types | Drug Claim Name | Drug Name | PMIDs |
| Page: 1 |

Copyright 2023-Present -The University of Texas Health Science Center at Houston |