
|
|||||
|
 | |
| |
| |
| |
| |
| |
|
Gene: SPRED1 |
Gene summary for SPRED1 |
| Gene information | Species | Human | Gene symbol | SPRED1 | Gene ID | 161742 |
| Gene name | sprouty related EVH1 domain containing 1 | |
| Gene Alias | LGSS | |
| Cytomap | 15q14 | |
| Gene Type | protein-coding | GO ID | GO:0000165 | UniProtAcc | Q7Z699 |
Top |
Malignant transformation analysis |
| Identification of the aberrant gene expression in precancerous and cancerous lesions by comparing the gene expression of stem-like cells in diseased tissues with normal stem cells |
| Entrez ID | Symbol | Replicates | Species | Organ | Tissue | Adj P-value | Log2FC | Malignancy |
| 161742 | SPRED1 | HTA11_3410_2000001011 | Human | Colorectum | AD | 1.63e-15 | -5.83e-01 | 0.0155 |
| 161742 | SPRED1 | HTA11_2951_2000001011 | Human | Colorectum | AD | 9.37e-04 | -6.75e-01 | 0.0216 |
| 161742 | SPRED1 | HTA11_3361_2000001011 | Human | Colorectum | AD | 5.62e-04 | -5.18e-01 | -0.1207 |
| 161742 | SPRED1 | HTA11_696_2000001011 | Human | Colorectum | AD | 1.28e-14 | -4.81e-01 | -0.1464 |
| 161742 | SPRED1 | HTA11_866_2000001011 | Human | Colorectum | AD | 2.45e-06 | -3.78e-01 | -0.1001 |
| 161742 | SPRED1 | HTA11_546_2000001011 | Human | Colorectum | AD | 1.12e-03 | -5.72e-01 | -0.0842 |
| 161742 | SPRED1 | HTA11_866_3004761011 | Human | Colorectum | AD | 3.40e-13 | -5.81e-01 | 0.096 |
| 161742 | SPRED1 | HTA11_10711_2000001011 | Human | Colorectum | AD | 1.47e-06 | -5.50e-01 | 0.0338 |
| 161742 | SPRED1 | HTA11_7696_3000711011 | Human | Colorectum | AD | 6.89e-15 | -4.80e-01 | 0.0674 |
| 161742 | SPRED1 | HTA11_6818_2000001011 | Human | Colorectum | AD | 2.32e-04 | -6.32e-01 | 0.0112 |
| 161742 | SPRED1 | HTA11_99999971662_82457 | Human | Colorectum | MSS | 6.88e-17 | -4.73e-01 | 0.3859 |
| 161742 | SPRED1 | HTA11_99999973899_84307 | Human | Colorectum | MSS | 2.50e-04 | -5.80e-01 | 0.2585 |
| 161742 | SPRED1 | HTA11_99999974143_84620 | Human | Colorectum | MSS | 2.30e-22 | -5.66e-01 | 0.3005 |
| 161742 | SPRED1 | F007 | Human | Colorectum | FAP | 5.87e-07 | -4.92e-01 | 0.1176 |
| 161742 | SPRED1 | A001-C-207 | Human | Colorectum | FAP | 7.23e-03 | 2.20e-01 | 0.1278 |
| 161742 | SPRED1 | A015-C-203 | Human | Colorectum | FAP | 2.79e-28 | -4.94e-01 | -0.1294 |
| 161742 | SPRED1 | A015-C-204 | Human | Colorectum | FAP | 9.98e-04 | -3.03e-01 | -0.0228 |
| 161742 | SPRED1 | A014-C-040 | Human | Colorectum | FAP | 6.36e-03 | -4.02e-01 | -0.1184 |
| 161742 | SPRED1 | A002-C-201 | Human | Colorectum | FAP | 1.85e-06 | -2.45e-01 | 0.0324 |
| 161742 | SPRED1 | A001-C-119 | Human | Colorectum | FAP | 1.97e-11 | -5.70e-01 | -0.1557 |
| Page: 1 2 3 4 5 |
| Tissue | Expression Dynamics | Abbreviation |
| Colorectum (GSE201348) |  | FAP: Familial adenomatous polyposis |
| CRC: Colorectal cancer | ||
| Colorectum (HTA11) | 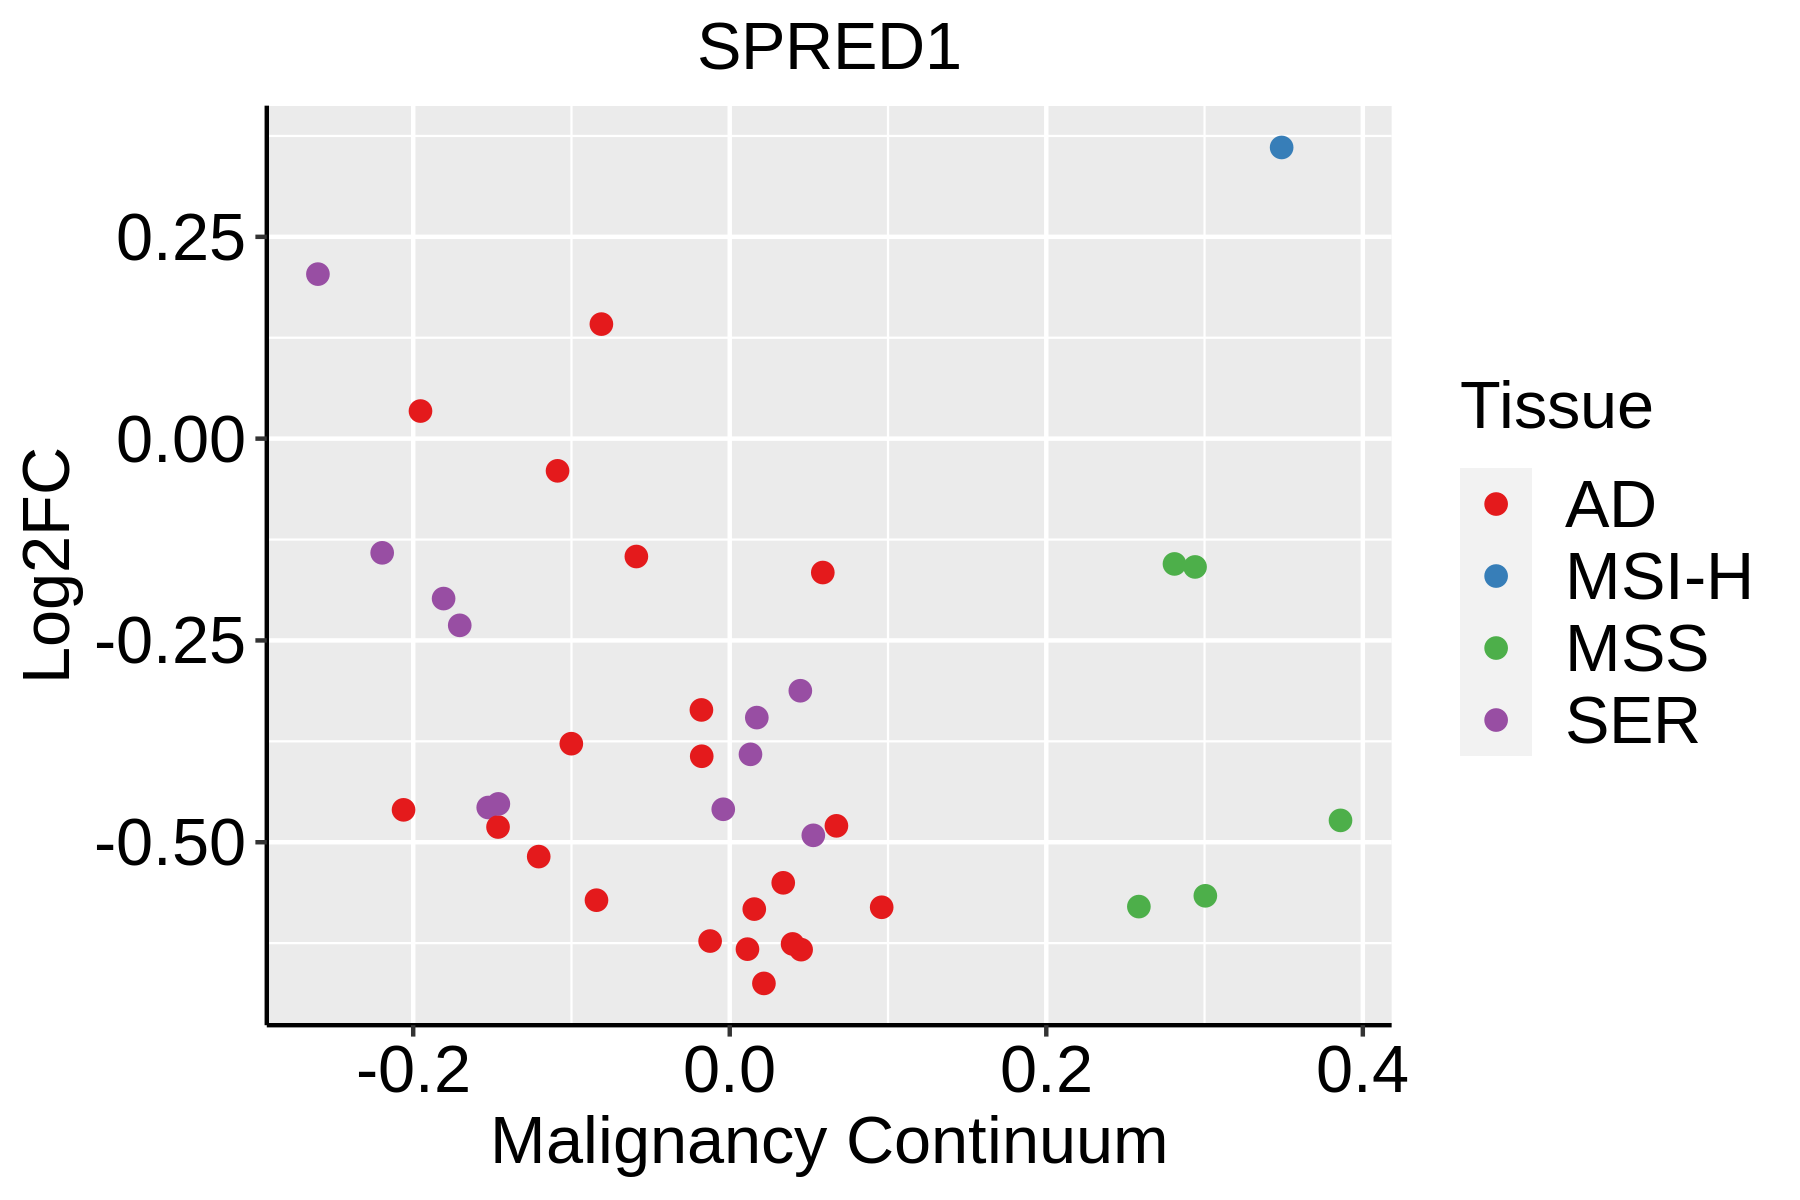 | AD: Adenomas |
| SER: Sessile serrated lesions | ||
| MSI-H: Microsatellite-high colorectal cancer | ||
| MSS: Microsatellite stable colorectal cancer | ||
| Liver |  | HCC: Hepatocellular carcinoma |
| NAFLD: Non-alcoholic fatty liver disease | ||
| Lung | 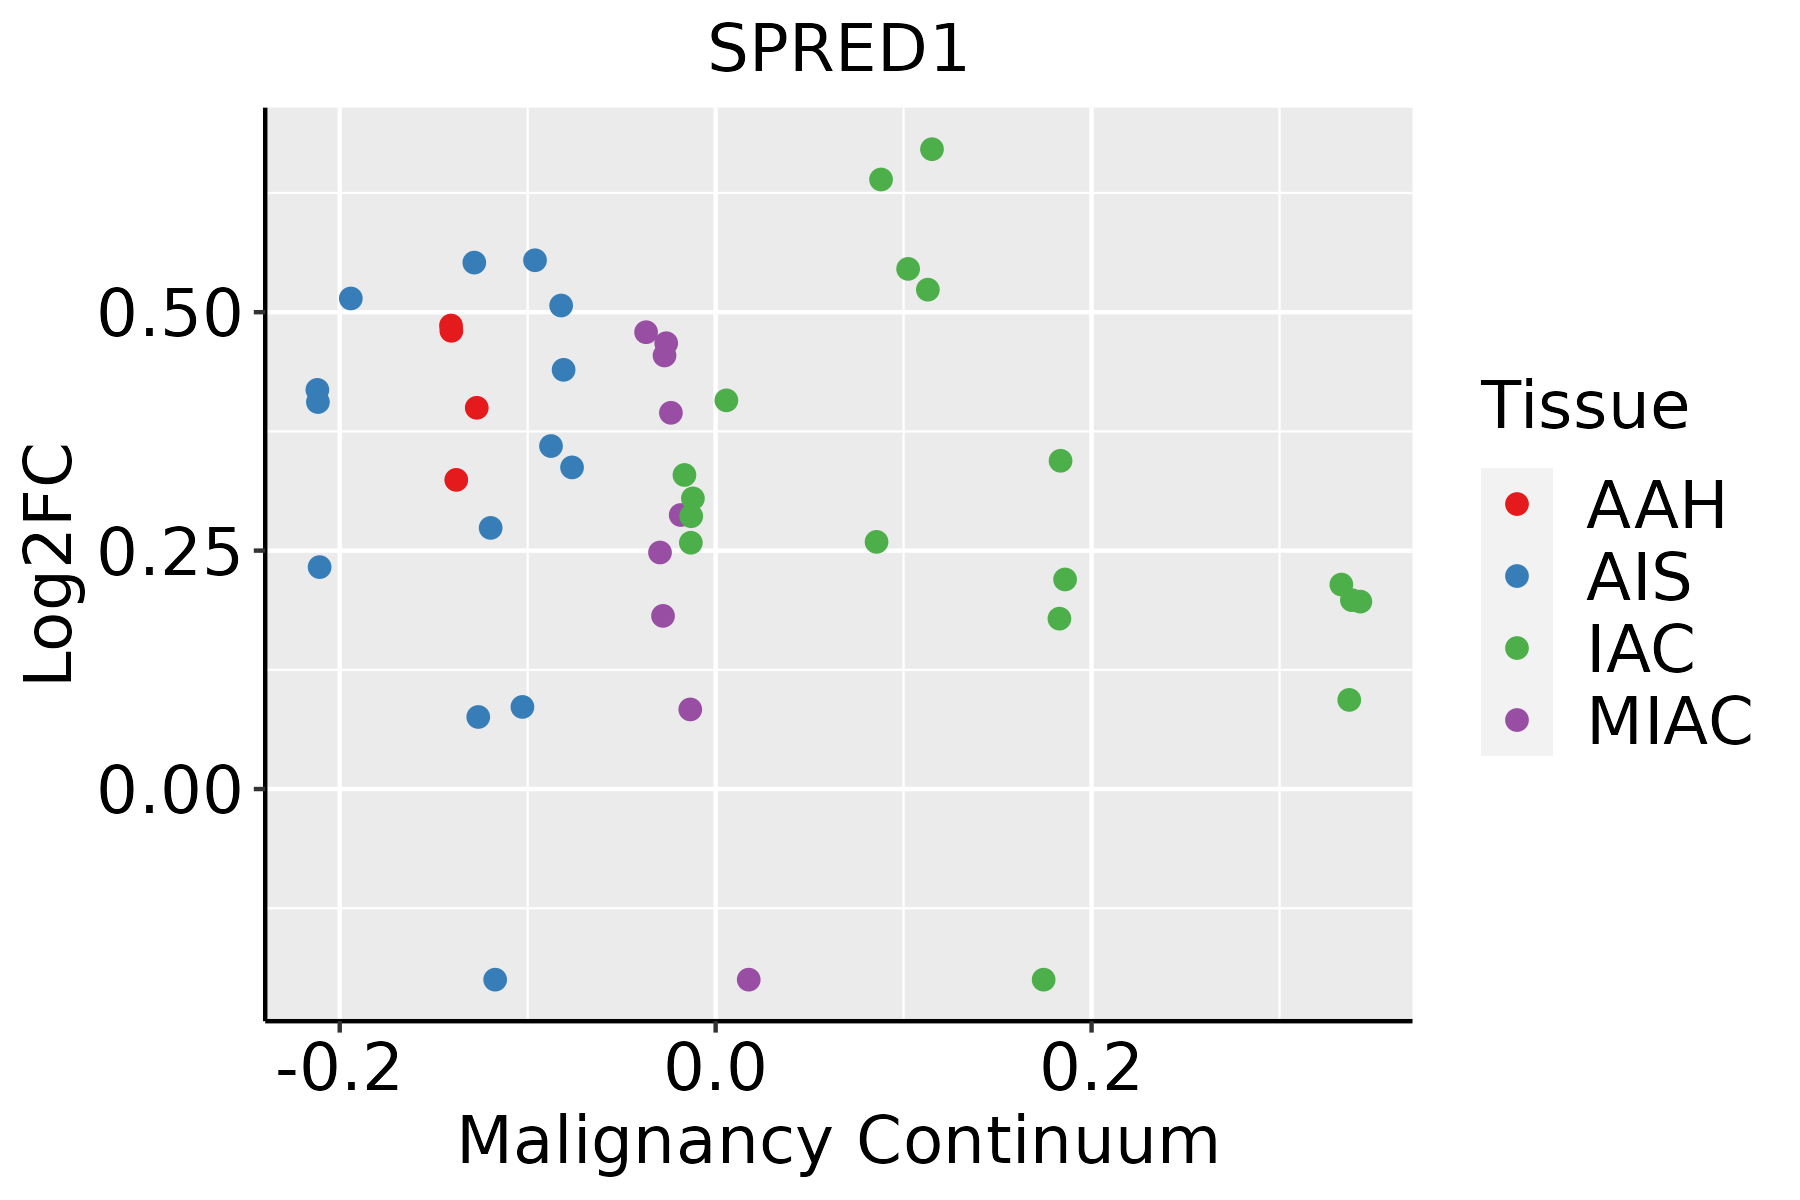 | AAH: Atypical adenomatous hyperplasia |
| AIS: Adenocarcinoma in situ | ||
| IAC: Invasive lung adenocarcinoma | ||
| MIA: Minimally invasive adenocarcinoma | ||
| Prostate | 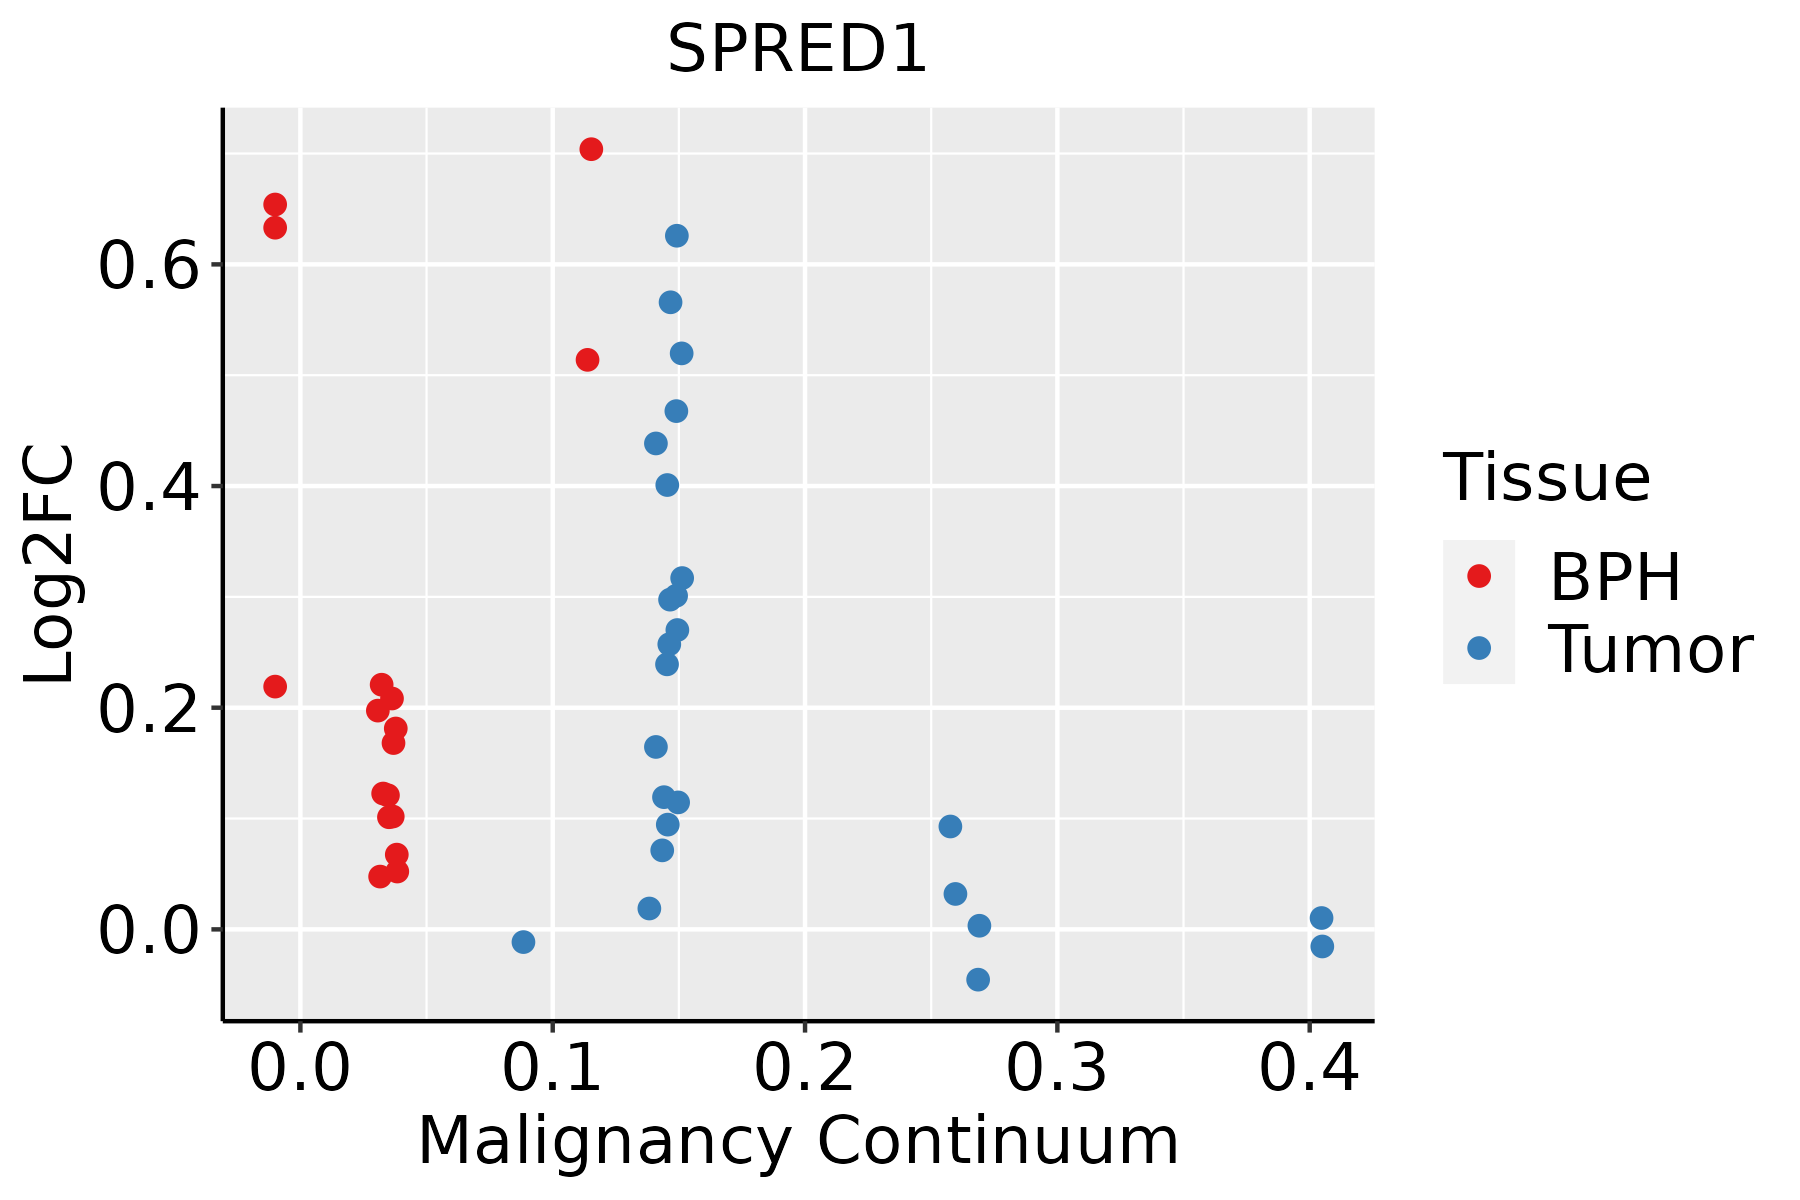 | BPH: Benign Prostatic Hyperplasia |
| Thyroid | 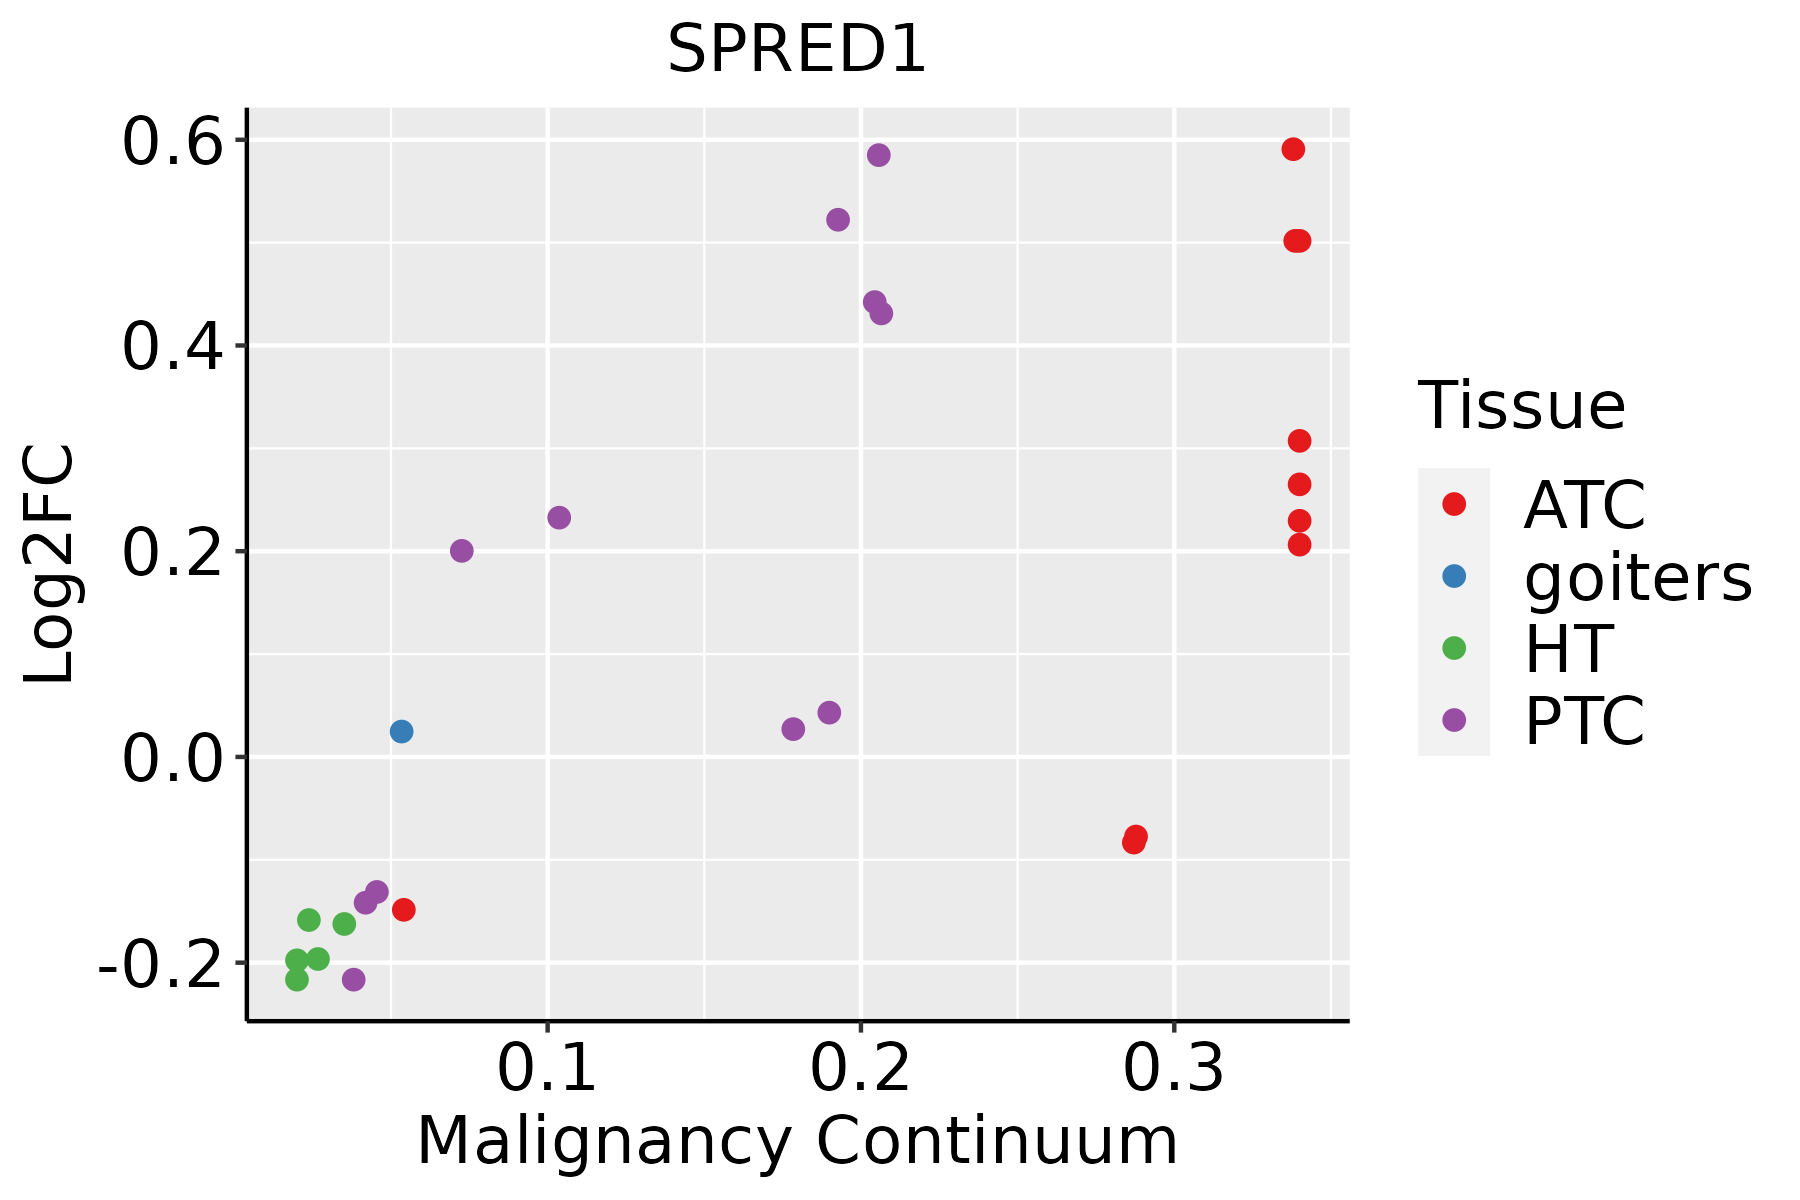 | ATC: Anaplastic thyroid cancer |
| HT: Hashimoto's thyroiditis | ||
| PTC: Papillary thyroid cancer |
| ∗log2FC in expression of this searched gene in stem-like cells from each diseased tissue sample relative to stem-like cells in normal samples in each tissue plotted against the malignancy continuum. Samples are colored based on if they are from different disease stage. |
Top |
Malignant transformation related pathway analysis |
| Find out the enriched GO biological processes and KEGG pathways involved in transition from healthy to precancer to cancer |
| Tissue | Disease Stage | Enriched GO biological Processes |
| Colorectum | AD |  |
| Colorectum | SER |  |
| Colorectum | MSS |  |
| Colorectum | MSI-H |  |
| Colorectum | FAP |  |
| ∗Top 15 enriched GO BP terms are showed in the bar plot of each disease state in each tissue. Each row represents a significant GO biological process which is colored according to the -log10(p.adjust). |
| Page: 1 2 3 4 5 6 7 8 9 |
| GO ID | Tissue | Disease Stage | Description | Gene Ratio | Bg Ratio | pvalue | p.adjust | Count |
| GO:0072331 | Colorectum | AD | signal transduction by p53 class mediator | 58/3918 | 163/18723 | 1.04e-05 | 2.40e-04 | 58 |
| GO:0010563 | Colorectum | AD | negative regulation of phosphorus metabolic process | 130/3918 | 442/18723 | 1.26e-05 | 2.76e-04 | 130 |
| GO:0045936 | Colorectum | AD | negative regulation of phosphate metabolic process | 129/3918 | 441/18723 | 1.81e-05 | 3.76e-04 | 129 |
| GO:0051348 | Colorectum | AD | negative regulation of transferase activity | 85/3918 | 268/18723 | 2.07e-05 | 4.19e-04 | 85 |
| GO:0001667 | Colorectum | AD | ameboidal-type cell migration | 137/3918 | 475/18723 | 2.17e-05 | 4.33e-04 | 137 |
| GO:2001020 | Colorectum | AD | regulation of response to DNA damage stimulus | 71/3918 | 219/18723 | 4.38e-05 | 7.65e-04 | 71 |
| GO:1901796 | Colorectum | AD | regulation of signal transduction by p53 class mediator | 36/3918 | 93/18723 | 6.58e-05 | 1.07e-03 | 36 |
| GO:0042326 | Colorectum | AD | negative regulation of phosphorylation | 112/3918 | 385/18723 | 8.02e-05 | 1.27e-03 | 112 |
| GO:0001933 | Colorectum | AD | negative regulation of protein phosphorylation | 101/3918 | 342/18723 | 9.39e-05 | 1.42e-03 | 101 |
| GO:0090132 | Colorectum | AD | epithelium migration | 105/3918 | 360/18723 | 1.18e-04 | 1.73e-03 | 105 |
| GO:0010632 | Colorectum | AD | regulation of epithelial cell migration | 88/3918 | 292/18723 | 1.19e-04 | 1.75e-03 | 88 |
| GO:1901798 | Colorectum | AD | positive regulation of signal transduction by p53 class mediator | 14/3918 | 25/18723 | 1.27e-04 | 1.83e-03 | 14 |
| GO:0010631 | Colorectum | AD | epithelial cell migration | 104/3918 | 357/18723 | 1.33e-04 | 1.90e-03 | 104 |
| GO:0090130 | Colorectum | AD | tissue migration | 105/3918 | 365/18723 | 2.10e-04 | 2.77e-03 | 105 |
| GO:0043409 | Colorectum | AD | negative regulation of MAPK cascade | 57/3918 | 180/18723 | 4.61e-04 | 5.14e-03 | 57 |
| GO:0006469 | Colorectum | AD | negative regulation of protein kinase activity | 65/3918 | 212/18723 | 5.21e-04 | 5.62e-03 | 65 |
| GO:0033673 | Colorectum | AD | negative regulation of kinase activity | 71/3918 | 237/18723 | 6.18e-04 | 6.47e-03 | 71 |
| GO:0007178 | Colorectum | AD | transmembrane receptor protein serine/threonine kinase signaling pathway | 99/3918 | 355/18723 | 9.92e-04 | 9.28e-03 | 99 |
| GO:2001022 | Colorectum | AD | positive regulation of response to DNA damage stimulus | 36/3918 | 105/18723 | 1.02e-03 | 9.47e-03 | 36 |
| GO:0071559 | Colorectum | AD | response to transforming growth factor beta | 74/3918 | 256/18723 | 1.45e-03 | 1.23e-02 | 74 |
| Page: 1 2 3 4 5 6 7 8 9 10 11 12 13 14 15 16 17 18 19 20 21 22 23 24 25 26 |
| Pathway ID | Tissue | Disease Stage | Description | Gene Ratio | Bg Ratio | pvalue | p.adjust | qvalue | Count |
| Page: 1 |
Top |
Cell-cell communication analysis |
| Identification of potential cell-cell interactions between two cell types and their ligand-receptor pairs for different disease states |
| Ligand | Receptor | LRpair | Pathway | Tissue | Disease Stage |
| Page: 1 |
Top |
Single-cell gene regulatory network inference analysis |
| Find out the significant the regulons (TFs) and the target genes of each regulon across cell types for different disease states |
| TF | Cell Type | Tissue | Disease Stage | Target Gene | RSS | Regulon Activity |
| ∗The dot plots of a searched regulon are shown for all cell subpopulations in each disease state of each tissue based on the regulon specific score inferred using pySCENIC and by calculating the average expression. |
| Page: 1 |
Top |
Somatic mutation of malignant transformation related genes |
| Annotation of somatic variants for genes involved in malignant transformation |
| Hugo Symbol | Variant Class | Variant Classification | dbSNP RS | HGVSc | HGVSp | HGVSp Short | SWISSPROT | BIOTYPE | SIFT | PolyPhen | Tumor Sample Barcode | Tissue | Histology | Sex | Age | Stage | Therapy Types | Drugs | Outcome |
| SPRED1 | SNV | Missense_Mutation | c.337N>A | p.Asp113Asn | p.D113N | Q7Z699 | protein_coding | deleterious(0) | probably_damaging(0.999) | TCGA-BH-A18H-01 | Breast | breast invasive carcinoma | Female | <65 | I/II | Chemotherapy | adriamycin | CR | |
| SPRED1 | SNV | Missense_Mutation | c.279G>C | p.Lys93Asn | p.K93N | Q7Z699 | protein_coding | deleterious(0.02) | probably_damaging(0.957) | TCGA-C8-A1HM-01 | Breast | breast invasive carcinoma | Female | >=65 | I/II | Chemotherapy | doxorubicin | CR | |
| SPRED1 | SNV | Missense_Mutation | novel | c.140N>C | p.Val47Ala | p.V47A | Q7Z699 | protein_coding | tolerated(0.12) | benign(0.014) | TCGA-D8-A1XK-01 | Breast | breast invasive carcinoma | Female | <65 | I/II | Chemotherapy | doxorubicine+cyclophosphamide | SD |
| SPRED1 | SNV | Missense_Mutation | c.970A>G | p.Lys324Glu | p.K324E | Q7Z699 | protein_coding | tolerated(0.12) | benign(0.444) | TCGA-D8-A1XQ-01 | Breast | breast invasive carcinoma | Female | >=65 | I/II | Unknown | Unknown | SD | |
| SPRED1 | SNV | Missense_Mutation | novel | c.506N>C | p.Arg169Thr | p.R169T | Q7Z699 | protein_coding | tolerated(0.5) | benign(0.057) | TCGA-GI-A2C9-01 | Breast | breast invasive carcinoma | Female | <65 | I/II | Unspecific | SD | |
| SPRED1 | SNV | Missense_Mutation | rs200142785 | c.565N>A | p.Gln189Lys | p.Q189K | Q7Z699 | protein_coding | tolerated(0.69) | benign(0.003) | TCGA-2W-A8YY-01 | Cervix | cervical & endocervical cancer | Female | <65 | I/II | Chemotherapy | cisplatin | CR |
| SPRED1 | SNV | Missense_Mutation | novel | c.752N>A | p.Arg251Gln | p.R251Q | Q7Z699 | protein_coding | deleterious(0.03) | probably_damaging(0.992) | TCGA-2W-A8YY-01 | Cervix | cervical & endocervical cancer | Female | <65 | I/II | Chemotherapy | cisplatin | CR |
| SPRED1 | SNV | Missense_Mutation | c.397N>A | p.Glu133Lys | p.E133K | Q7Z699 | protein_coding | deleterious(0.03) | benign(0.036) | TCGA-FU-A40J-01 | Cervix | cervical & endocervical cancer | Female | <65 | III/IV | Chemotherapy | carboplatin | CR | |
| SPRED1 | SNV | Missense_Mutation | novel | c.1175N>T | p.Ser392Leu | p.S392L | Q7Z699 | protein_coding | deleterious(0) | probably_damaging(0.998) | TCGA-JX-A3Q0-01 | Cervix | cervical & endocervical cancer | Female | <65 | III/IV | Unknown | Unknown | SD |
| SPRED1 | SNV | Missense_Mutation | novel | c.161N>A | p.Gly54Asp | p.G54D | Q7Z699 | protein_coding | deleterious(0.02) | benign(0.089) | TCGA-AA-3811-01 | Colorectum | colon adenocarcinoma | Female | >=65 | III/IV | Unknown | Unknown | PD |
| Page: 1 2 3 4 5 6 7 8 |
Top |
Related drugs of malignant transformation related genes |
| Identification of chemicals and drugs interact with genes involved in malignant transfromation |
| (DGIdb 4.0) |
| Entrez ID | Symbol | Category | Interaction Types | Drug Claim Name | Drug Name | PMIDs |
| Page: 1 |

Copyright 2023-Present -The University of Texas Health Science Center at Houston |