
|
|||||
|
 | |
| |
| |
| |
| |
| |
|
Gene: SPR |
Gene summary for SPR |
| Gene information | Species | Human | Gene symbol | SPR | Gene ID | 6697 |
| Gene name | sepiapterin reductase | |
| Gene Alias | SDR38C1 | |
| Cytomap | 2p13.2 | |
| Gene Type | protein-coding | GO ID | GO:0006066 | UniProtAcc | P35270 |
Top |
Malignant transformation analysis |
| Identification of the aberrant gene expression in precancerous and cancerous lesions by comparing the gene expression of stem-like cells in diseased tissues with normal stem cells |
| Entrez ID | Symbol | Replicates | Species | Organ | Tissue | Adj P-value | Log2FC | Malignancy |
| 6697 | SPR | HTA11_3410_2000001011 | Human | Colorectum | AD | 2.11e-08 | 2.38e-01 | 0.0155 |
| 6697 | SPR | HTA11_2487_2000001011 | Human | Colorectum | SER | 6.92e-14 | 4.48e-01 | -0.1808 |
| 6697 | SPR | HTA11_1938_2000001011 | Human | Colorectum | AD | 9.79e-12 | 4.81e-01 | -0.0811 |
| 6697 | SPR | HTA11_78_2000001011 | Human | Colorectum | AD | 1.17e-02 | 2.62e-01 | -0.1088 |
| 6697 | SPR | HTA11_347_2000001011 | Human | Colorectum | AD | 1.36e-25 | 5.76e-01 | -0.1954 |
| 6697 | SPR | HTA11_411_2000001011 | Human | Colorectum | SER | 3.05e-06 | 6.82e-01 | -0.2602 |
| 6697 | SPR | HTA11_2112_2000001011 | Human | Colorectum | SER | 3.64e-02 | 4.98e-01 | -0.2196 |
| 6697 | SPR | HTA11_3361_2000001011 | Human | Colorectum | AD | 8.20e-08 | 3.63e-01 | -0.1207 |
| 6697 | SPR | HTA11_83_2000001011 | Human | Colorectum | SER | 1.41e-10 | 4.74e-01 | -0.1526 |
| 6697 | SPR | HTA11_696_2000001011 | Human | Colorectum | AD | 1.38e-18 | 4.38e-01 | -0.1464 |
| 6697 | SPR | HTA11_866_2000001011 | Human | Colorectum | AD | 1.14e-07 | 2.54e-01 | -0.1001 |
| 6697 | SPR | HTA11_1391_2000001011 | Human | Colorectum | AD | 2.26e-15 | 4.78e-01 | -0.059 |
| 6697 | SPR | HTA11_2992_2000001011 | Human | Colorectum | SER | 1.78e-08 | 4.70e-01 | -0.1706 |
| 6697 | SPR | HTA11_5212_2000001011 | Human | Colorectum | AD | 1.30e-10 | 5.49e-01 | -0.2061 |
| 6697 | SPR | HTA11_5216_2000001011 | Human | Colorectum | SER | 3.30e-07 | 6.16e-01 | -0.1462 |
| 6697 | SPR | HTA11_546_2000001011 | Human | Colorectum | AD | 1.94e-02 | 2.83e-01 | -0.0842 |
| 6697 | SPR | HTA11_7862_2000001011 | Human | Colorectum | AD | 1.64e-06 | 3.85e-01 | -0.0179 |
| 6697 | SPR | HTA11_866_3004761011 | Human | Colorectum | AD | 1.23e-11 | 3.94e-01 | 0.096 |
| 6697 | SPR | HTA11_4255_2000001011 | Human | Colorectum | SER | 2.10e-02 | 3.00e-01 | 0.0446 |
| 6697 | SPR | HTA11_8622_2000001021 | Human | Colorectum | SER | 1.18e-08 | 4.57e-01 | 0.0528 |
| Page: 1 2 3 4 5 6 7 |
| Tissue | Expression Dynamics | Abbreviation |
| Colorectum (GSE201348) |  | FAP: Familial adenomatous polyposis |
| CRC: Colorectal cancer | ||
| Colorectum (HTA11) |  | AD: Adenomas |
| SER: Sessile serrated lesions | ||
| MSI-H: Microsatellite-high colorectal cancer | ||
| MSS: Microsatellite stable colorectal cancer | ||
| Esophagus |  | ESCC: Esophageal squamous cell carcinoma |
| HGIN: High-grade intraepithelial neoplasias | ||
| LGIN: Low-grade intraepithelial neoplasias | ||
| Liver | 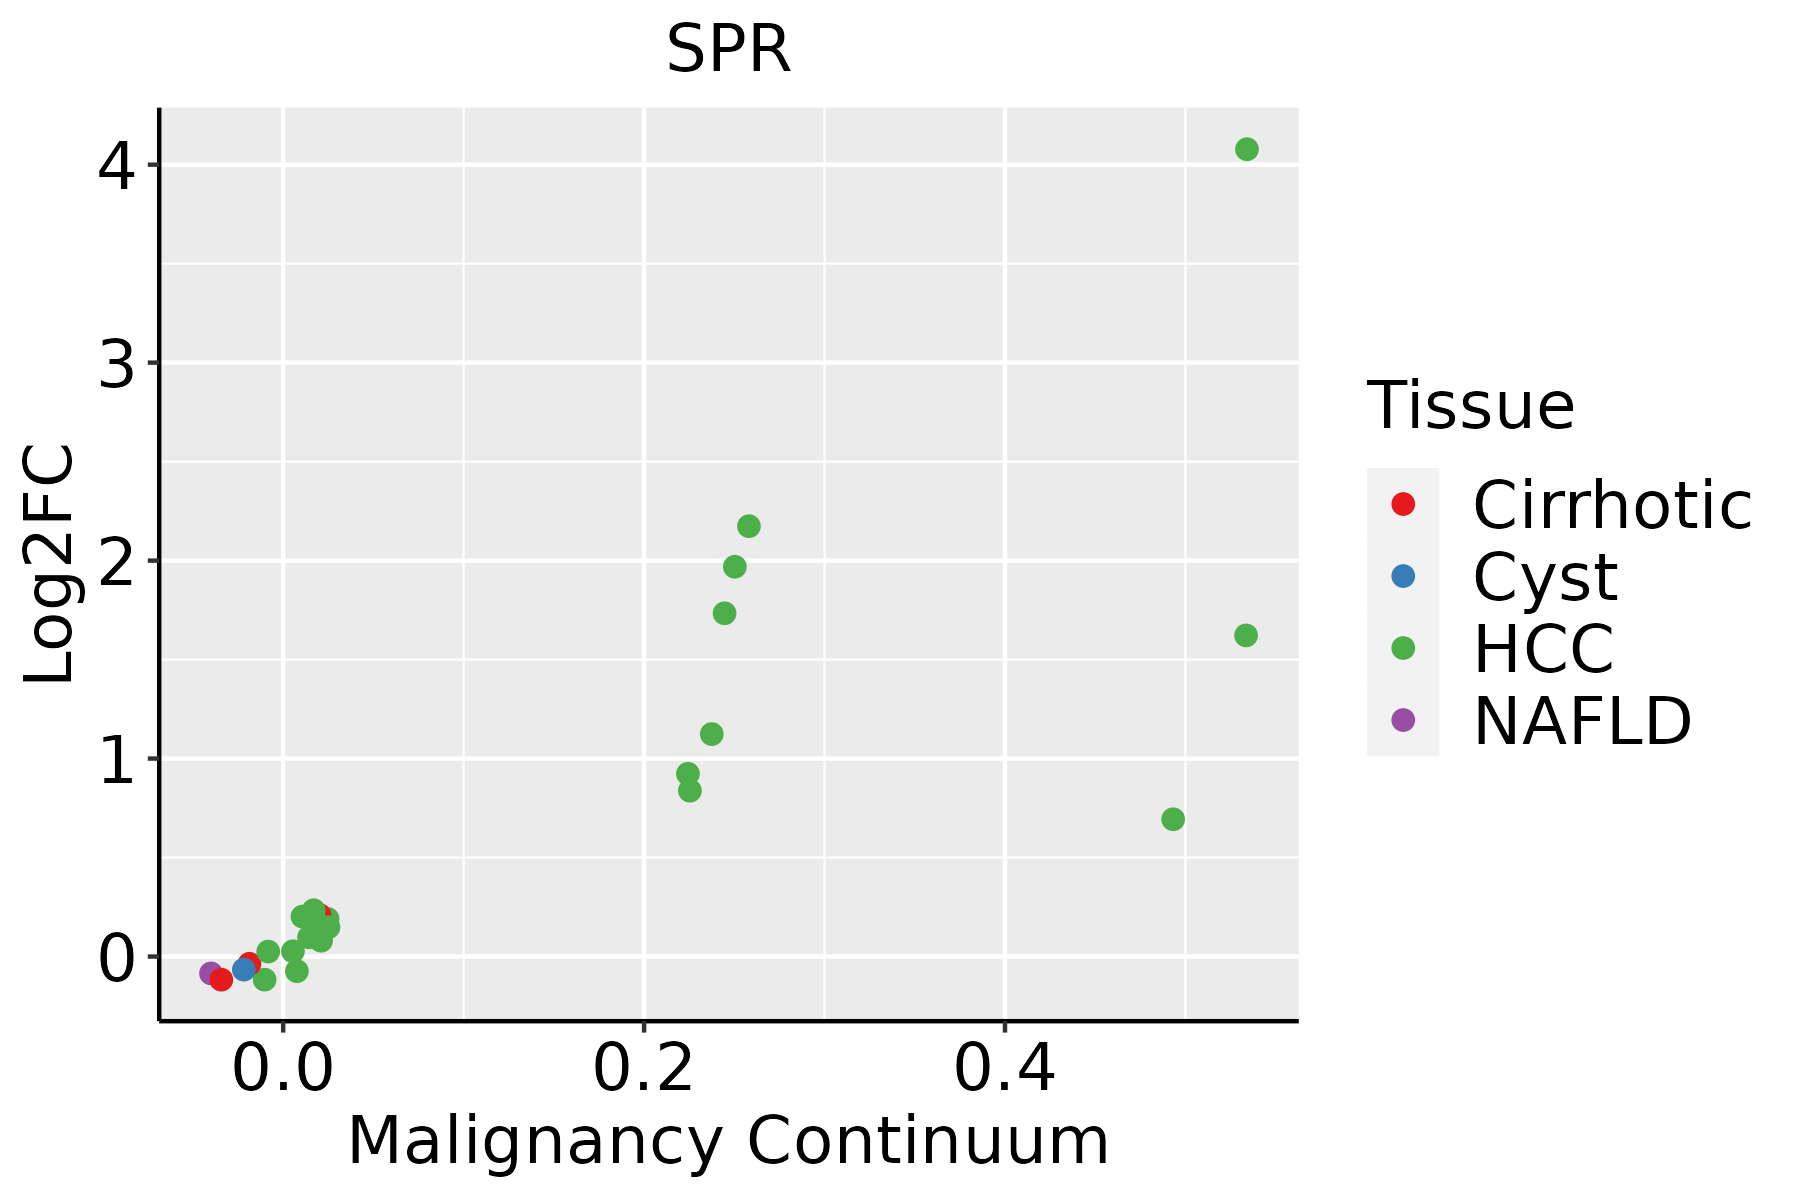 | HCC: Hepatocellular carcinoma |
| NAFLD: Non-alcoholic fatty liver disease | ||
| Oral Cavity | 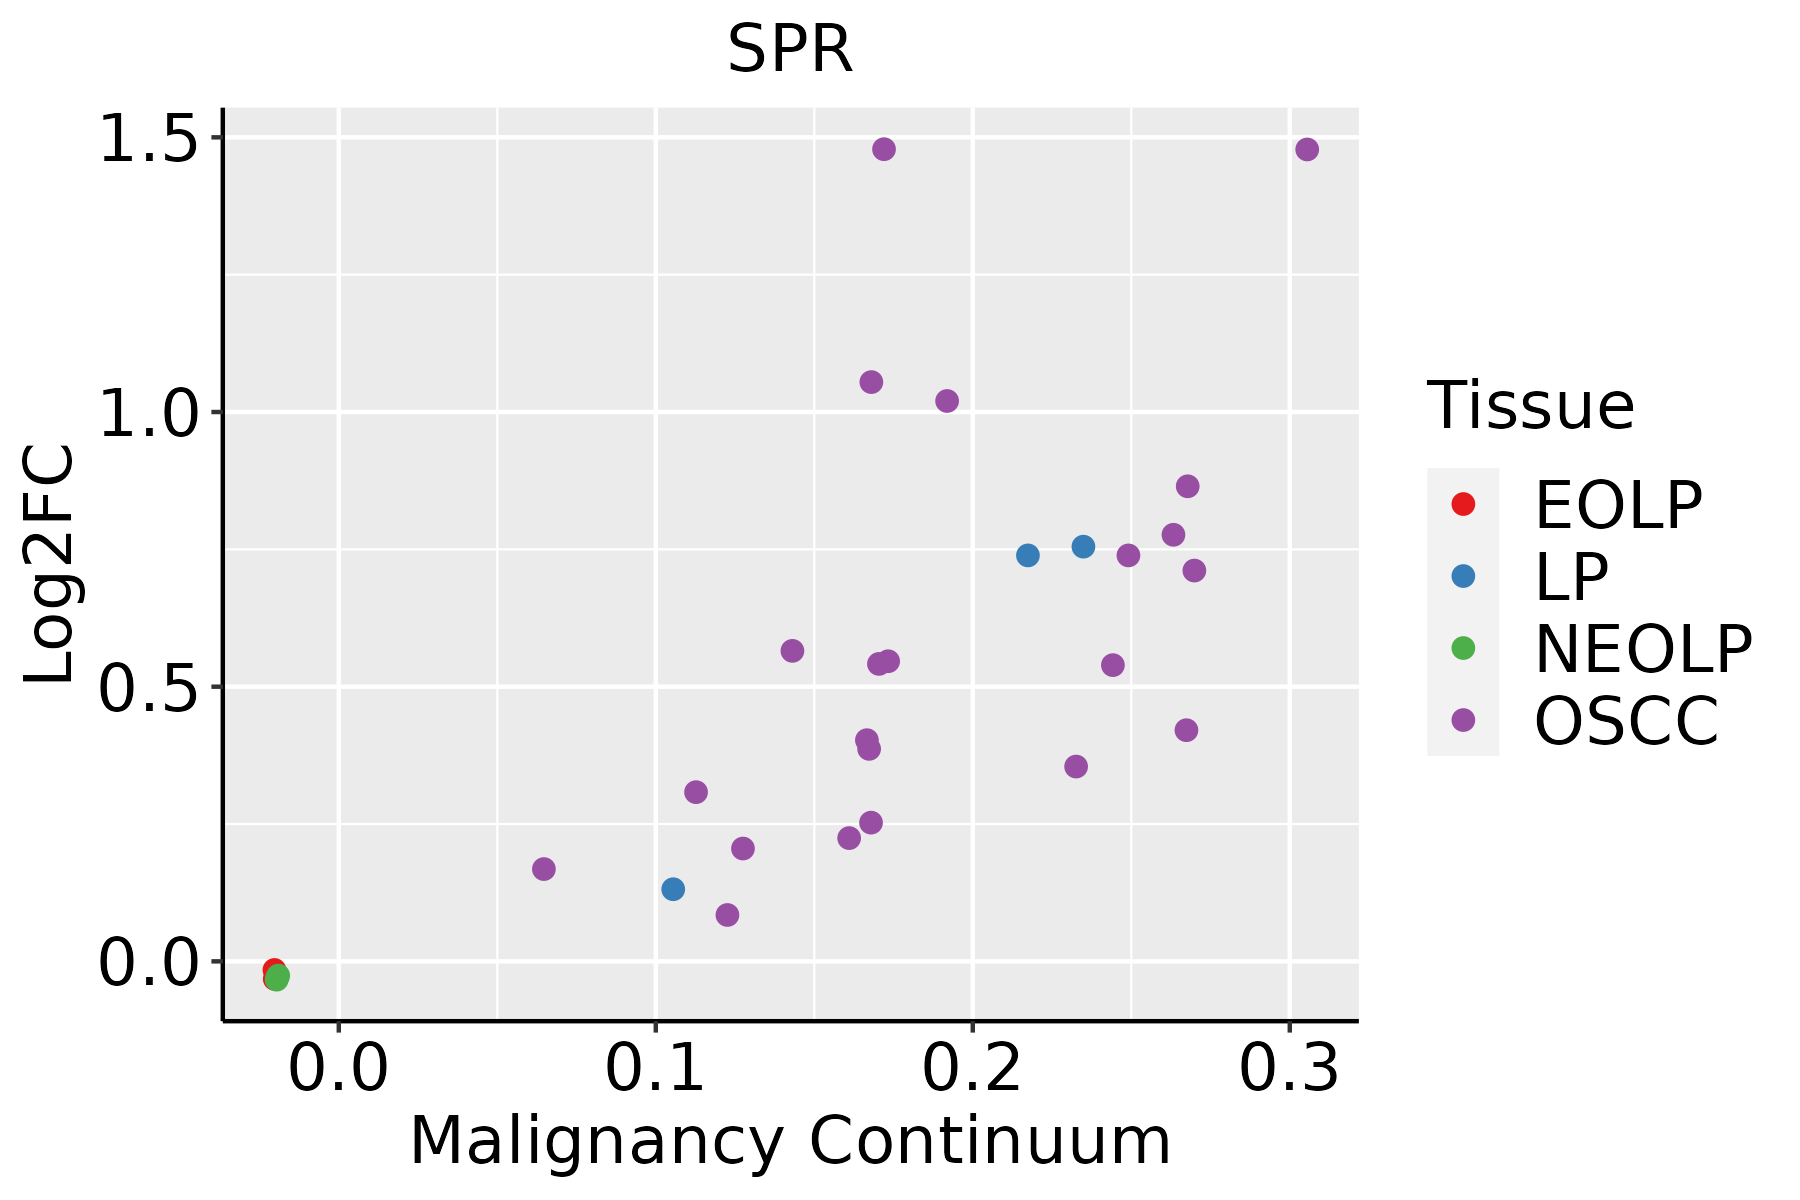 | EOLP: Erosive Oral lichen planus |
| LP: leukoplakia | ||
| NEOLP: Non-erosive oral lichen planus | ||
| OSCC: Oral squamous cell carcinoma | ||
| Skin | 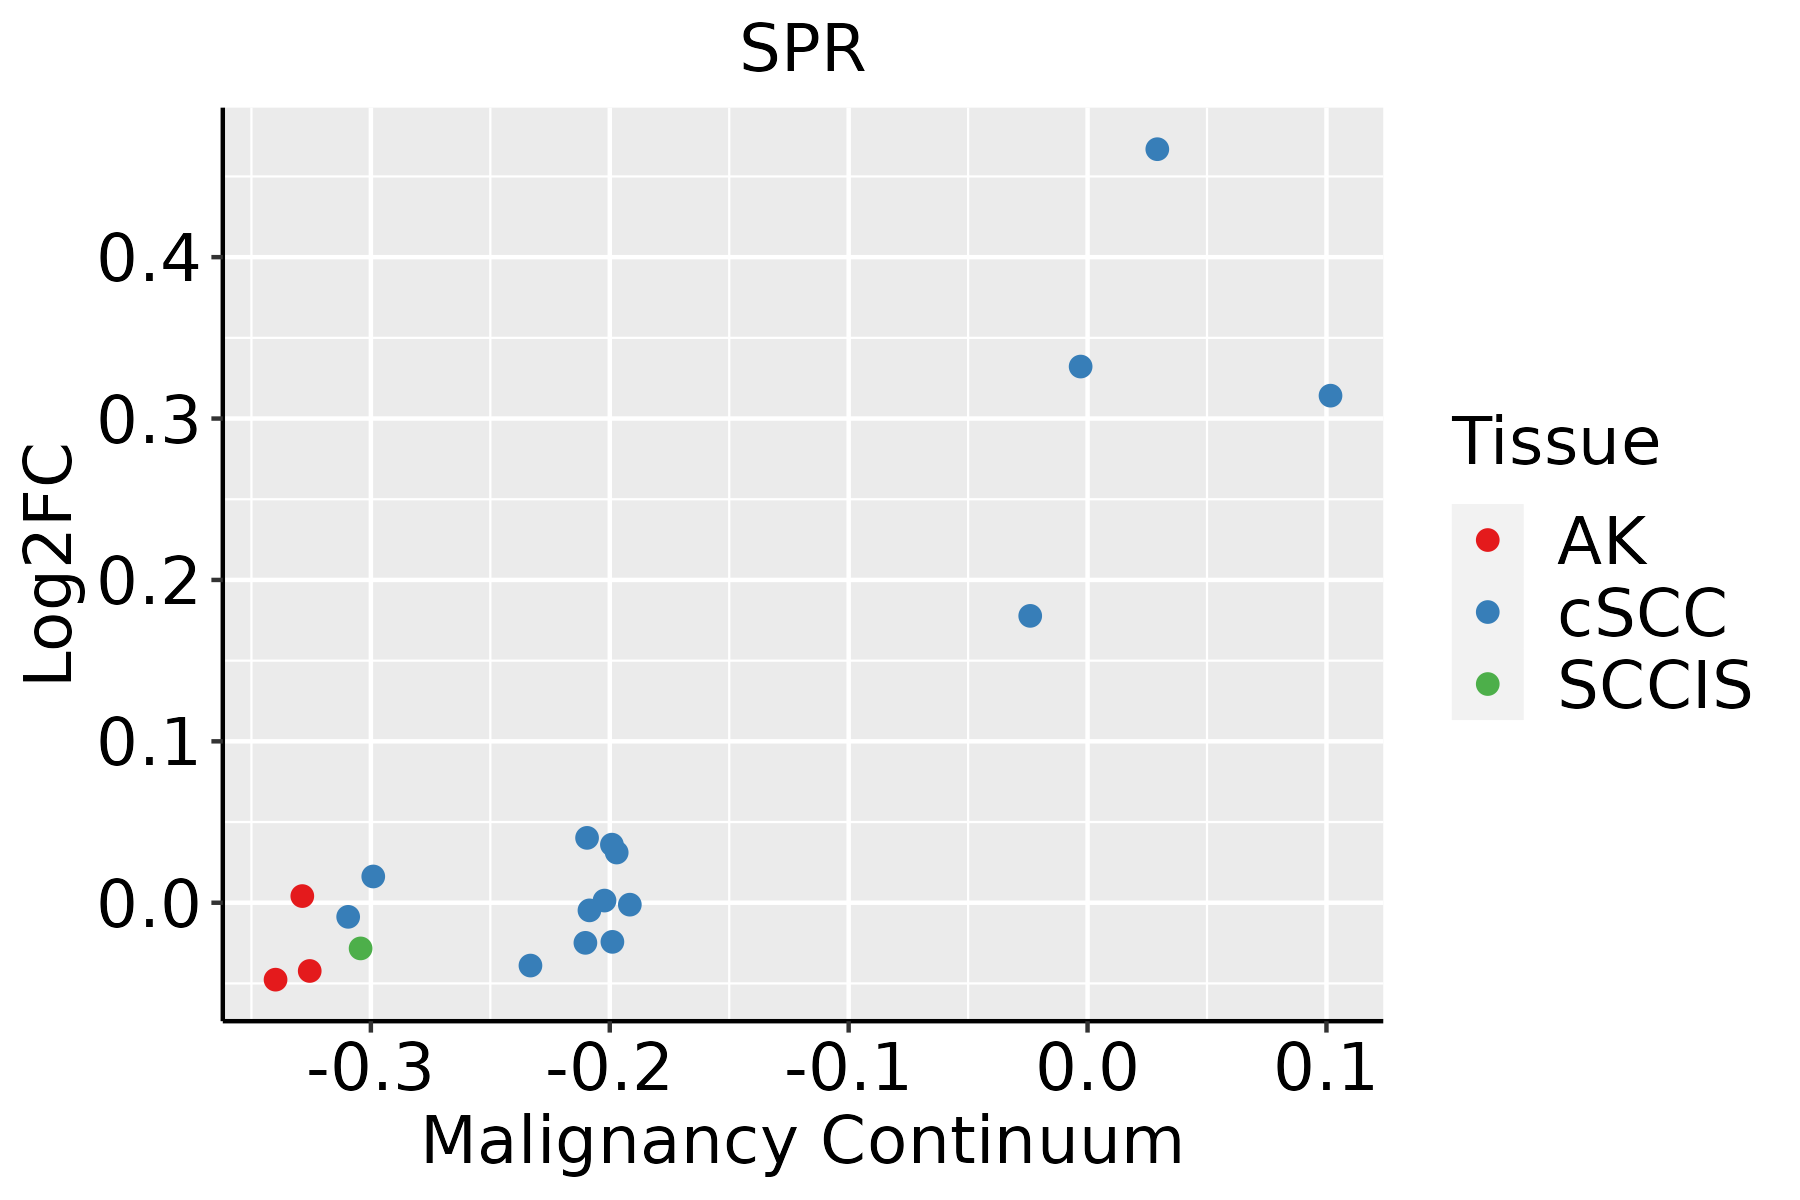 | AK: Actinic keratosis |
| cSCC: Cutaneous squamous cell carcinoma | ||
| SCCIS:squamous cell carcinoma in situ |
| ∗log2FC in expression of this searched gene in stem-like cells from each diseased tissue sample relative to stem-like cells in normal samples in each tissue plotted against the malignancy continuum. Samples are colored based on if they are from different disease stage. |
Top |
Malignant transformation related pathway analysis |
| Find out the enriched GO biological processes and KEGG pathways involved in transition from healthy to precancer to cancer |
| Tissue | Disease Stage | Enriched GO biological Processes |
| Colorectum | AD |  |
| Colorectum | SER |  |
| Colorectum | MSS |  |
| Colorectum | MSI-H |  |
| Colorectum | FAP |  |
| ∗Top 15 enriched GO BP terms are showed in the bar plot of each disease state in each tissue. Each row represents a significant GO biological process which is colored according to the -log10(p.adjust). |
| Page: 1 2 3 4 5 6 7 8 9 |
| GO ID | Tissue | Disease Stage | Description | Gene Ratio | Bg Ratio | pvalue | p.adjust | Count |
| GO:004206010 | Cervix | CC | wound healing | 109/2311 | 422/18723 | 1.84e-14 | 1.57e-11 | 109 |
| GO:00085446 | Cervix | CC | epidermis development | 83/2311 | 324/18723 | 3.91e-11 | 8.54e-09 | 83 |
| GO:00435884 | Cervix | CC | skin development | 71/2311 | 263/18723 | 8.04e-11 | 1.46e-08 | 71 |
| GO:00302164 | Cervix | CC | keratinocyte differentiation | 42/2311 | 139/18723 | 1.74e-08 | 1.28e-06 | 42 |
| GO:00099137 | Cervix | CC | epidermal cell differentiation | 53/2311 | 202/18723 | 5.48e-08 | 3.25e-06 | 53 |
| GO:00181493 | Cervix | CC | peptide cross-linking | 10/2311 | 35/18723 | 7.99e-03 | 4.18e-02 | 10 |
| GO:000854413 | Cervix | HSIL_HPV | epidermis development | 38/737 | 324/18723 | 1.92e-09 | 3.23e-07 | 38 |
| GO:003021611 | Cervix | HSIL_HPV | keratinocyte differentiation | 22/737 | 139/18723 | 2.53e-08 | 2.18e-06 | 22 |
| GO:004358813 | Cervix | HSIL_HPV | skin development | 31/737 | 263/18723 | 5.32e-08 | 3.89e-06 | 31 |
| GO:000991313 | Cervix | HSIL_HPV | epidermal cell differentiation | 26/737 | 202/18723 | 1.10e-07 | 7.15e-06 | 26 |
| GO:004206015 | Cervix | HSIL_HPV | wound healing | 40/737 | 422/18723 | 2.80e-07 | 1.61e-05 | 40 |
| GO:00181491 | Cervix | HSIL_HPV | peptide cross-linking | 8/737 | 35/18723 | 5.08e-05 | 1.26e-03 | 8 |
| GO:0072331 | Colorectum | AD | signal transduction by p53 class mediator | 58/3918 | 163/18723 | 1.04e-05 | 2.40e-04 | 58 |
| GO:0010563 | Colorectum | AD | negative regulation of phosphorus metabolic process | 130/3918 | 442/18723 | 1.26e-05 | 2.76e-04 | 130 |
| GO:0045936 | Colorectum | AD | negative regulation of phosphate metabolic process | 129/3918 | 441/18723 | 1.81e-05 | 3.76e-04 | 129 |
| GO:0051348 | Colorectum | AD | negative regulation of transferase activity | 85/3918 | 268/18723 | 2.07e-05 | 4.19e-04 | 85 |
| GO:0001667 | Colorectum | AD | ameboidal-type cell migration | 137/3918 | 475/18723 | 2.17e-05 | 4.33e-04 | 137 |
| GO:0006066 | Colorectum | AD | alcohol metabolic process | 106/3918 | 353/18723 | 3.02e-05 | 5.57e-04 | 106 |
| GO:2001020 | Colorectum | AD | regulation of response to DNA damage stimulus | 71/3918 | 219/18723 | 4.38e-05 | 7.65e-04 | 71 |
| GO:1901796 | Colorectum | AD | regulation of signal transduction by p53 class mediator | 36/3918 | 93/18723 | 6.58e-05 | 1.07e-03 | 36 |
| Page: 1 2 3 4 5 6 7 8 9 10 11 12 13 14 15 16 17 18 19 20 21 22 23 24 25 26 27 28 29 30 31 32 33 34 35 36 37 38 39 40 41 42 43 44 45 46 47 48 49 50 51 |
| Pathway ID | Tissue | Disease Stage | Description | Gene Ratio | Bg Ratio | pvalue | p.adjust | qvalue | Count |
| hsa012405 | Esophagus | ESCC | Biosynthesis of cofactors | 97/4205 | 153/8465 | 3.88e-04 | 1.35e-03 | 6.94e-04 | 97 |
| hsa0124012 | Esophagus | ESCC | Biosynthesis of cofactors | 97/4205 | 153/8465 | 3.88e-04 | 1.35e-03 | 6.94e-04 | 97 |
| hsa01240 | Liver | Cirrhotic | Biosynthesis of cofactors | 66/2530 | 153/8465 | 3.11e-04 | 1.99e-03 | 1.23e-03 | 66 |
| hsa012401 | Liver | Cirrhotic | Biosynthesis of cofactors | 66/2530 | 153/8465 | 3.11e-04 | 1.99e-03 | 1.23e-03 | 66 |
| hsa012402 | Liver | HCC | Biosynthesis of cofactors | 103/4020 | 153/8465 | 4.67e-07 | 5.05e-06 | 2.81e-06 | 103 |
| hsa012403 | Liver | HCC | Biosynthesis of cofactors | 103/4020 | 153/8465 | 4.67e-07 | 5.05e-06 | 2.81e-06 | 103 |
| hsa012404 | Oral cavity | OSCC | Biosynthesis of cofactors | 88/3704 | 153/8465 | 3.84e-04 | 1.20e-03 | 6.12e-04 | 88 |
| hsa0124011 | Oral cavity | OSCC | Biosynthesis of cofactors | 88/3704 | 153/8465 | 3.84e-04 | 1.20e-03 | 6.12e-04 | 88 |
| hsa0124021 | Oral cavity | LP | Biosynthesis of cofactors | 57/2418 | 153/8465 | 1.17e-02 | 3.91e-02 | 2.52e-02 | 57 |
| hsa0124031 | Oral cavity | LP | Biosynthesis of cofactors | 57/2418 | 153/8465 | 1.17e-02 | 3.91e-02 | 2.52e-02 | 57 |
| Page: 1 |
Top |
Cell-cell communication analysis |
| Identification of potential cell-cell interactions between two cell types and their ligand-receptor pairs for different disease states |
| Ligand | Receptor | LRpair | Pathway | Tissue | Disease Stage |
| Page: 1 |
Top |
Single-cell gene regulatory network inference analysis |
| Find out the significant the regulons (TFs) and the target genes of each regulon across cell types for different disease states |
| TF | Cell Type | Tissue | Disease Stage | Target Gene | RSS | Regulon Activity |
| SPR | LUM | Prostate | ADJ | SERPINH1,LSAMP-AS1,ZFAND2A, etc. | 6.68e-01 |  |
| SPR | M2MAC | Skin | cSCC | LIPA,RCAN1,CHCHD10, etc. | 2.78e-01 |  |
| ∗The dot plots of a searched regulon are shown for all cell subpopulations in each disease state of each tissue based on the regulon specific score inferred using pySCENIC and by calculating the average expression. |
| Page: 1 |
Top |
Somatic mutation of malignant transformation related genes |
| Annotation of somatic variants for genes involved in malignant transformation |
| Hugo Symbol | Variant Class | Variant Classification | dbSNP RS | HGVSc | HGVSp | HGVSp Short | SWISSPROT | BIOTYPE | SIFT | PolyPhen | Tumor Sample Barcode | Tissue | Histology | Sex | Age | Stage | Therapy Types | Drugs | Outcome |
| SPR | SNV | Missense_Mutation | c.561N>T | p.Glu187Asp | p.E187D | P35270 | protein_coding | deleterious(0) | probably_damaging(0.959) | TCGA-A6-2686-01 | Colorectum | colon adenocarcinoma | Female | >=65 | I/II | Unknown | Unknown | SD | |
| SPR | SNV | Missense_Mutation | c.392N>G | p.Met131Arg | p.M131R | P35270 | protein_coding | deleterious(0.03) | possibly_damaging(0.874) | TCGA-AA-3492-01 | Colorectum | colon adenocarcinoma | Female | >=65 | I/II | Unknown | Unknown | SD | |
| SPR | SNV | Missense_Mutation | c.535N>G | p.Met179Val | p.M179V | P35270 | protein_coding | deleterious(0) | probably_damaging(0.957) | TCGA-D5-6928-01 | Colorectum | colon adenocarcinoma | Male | >=65 | I/II | Unknown | Unknown | SD | |
| SPR | SNV | Missense_Mutation | c.166N>A | p.Ala56Thr | p.A56T | P35270 | protein_coding | tolerated(0.19) | benign(0.041) | TCGA-NH-A5IV-01 | Colorectum | colon adenocarcinoma | Female | >=65 | I/II | Unknown | Unknown | SD | |
| SPR | SNV | Missense_Mutation | novel | c.406N>G | p.Ser136Ala | p.S136A | P35270 | protein_coding | tolerated(0.8) | benign(0.042) | TCGA-A5-A0G1-01 | Endometrium | uterine corpus endometrioid carcinoma | Female | >=65 | I/II | Unknown | Unknown | SD |
| SPR | SNV | Missense_Mutation | novel | c.599C>A | p.Pro200His | p.P200H | P35270 | protein_coding | deleterious(0.01) | probably_damaging(0.993) | TCGA-AX-A0J1-01 | Endometrium | uterine corpus endometrioid carcinoma | Female | >=65 | I/II | Unknown | Unknown | SD |
| SPR | SNV | Missense_Mutation | novel | c.479C>T | p.Ala160Val | p.A160V | P35270 | protein_coding | deleterious(0) | probably_damaging(0.996) | TCGA-AX-A2HD-01 | Endometrium | uterine corpus endometrioid carcinoma | Female | >=65 | III/IV | Unknown | Unknown | SD |
| SPR | SNV | Missense_Mutation | novel | c.308N>A | p.Ser103Tyr | p.S103Y | P35270 | protein_coding | deleterious(0) | possibly_damaging(0.804) | TCGA-B5-A3FA-01 | Endometrium | uterine corpus endometrioid carcinoma | Female | >=65 | I/II | Unknown | Unknown | SD |
| SPR | SNV | Missense_Mutation | rs767434287 | c.467N>T | p.Ser156Leu | p.S156L | P35270 | protein_coding | deleterious(0) | probably_damaging(1) | TCGA-D1-A103-01 | Endometrium | uterine corpus endometrioid carcinoma | Female | >=65 | I/II | Unknown | Unknown | SD |
| SPR | SNV | Missense_Mutation | novel | c.529N>T | p.Arg177Cys | p.R177C | P35270 | protein_coding | deleterious(0) | probably_damaging(1) | TCGA-EY-A1G8-01 | Endometrium | uterine corpus endometrioid carcinoma | Female | >=65 | I/II | Unknown | Unknown | SD |
| Page: 1 2 |
Top |
Related drugs of malignant transformation related genes |
| Identification of chemicals and drugs interact with genes involved in malignant transfromation |
| (DGIdb 4.0) |
| Entrez ID | Symbol | Category | Interaction Types | Drug Claim Name | Drug Name | PMIDs |
| 6697 | SPR | DRUGGABLE GENOME, SHORT CHAIN DEHYDROGENASE REDUCTASE, ENZYME | antagonist | CHEMBL1471 | APREPITANT | |
| 6697 | SPR | DRUGGABLE GENOME, SHORT CHAIN DEHYDROGENASE REDUCTASE, ENZYME | antagonist | CHEMBL105060 | DNK333 | |
| 6697 | SPR | DRUGGABLE GENOME, SHORT CHAIN DEHYDROGENASE REDUCTASE, ENZYME | antagonist | CHEMBL3544947 | BURAPITANT | |
| 6697 | SPR | DRUGGABLE GENOME, SHORT CHAIN DEHYDROGENASE REDUCTASE, ENZYME | antagonist | CHEMBL2104927 | FIGOPITANT | |
| 6697 | SPR | DRUGGABLE GENOME, SHORT CHAIN DEHYDROGENASE REDUCTASE, ENZYME | antagonist | CHEMBL2104992 | VESTIPITANT MESYLATE | |
| 6697 | SPR | DRUGGABLE GENOME, SHORT CHAIN DEHYDROGENASE REDUCTASE, ENZYME | antagonist | CHEMBL1201782 | FOSAPREPITANT DIMEGLUMINE | |
| 6697 | SPR | DRUGGABLE GENOME, SHORT CHAIN DEHYDROGENASE REDUCTASE, ENZYME | antagonist | CHEMBL3544984 | TRADIPITANT | |
| 6697 | SPR | DRUGGABLE GENOME, SHORT CHAIN DEHYDROGENASE REDUCTASE, ENZYME | antagonist | CHEMBL522302 | VOFOPITANT | |
| 6697 | SPR | DRUGGABLE GENOME, SHORT CHAIN DEHYDROGENASE REDUCTASE, ENZYME | antagonist | CHEMBL2105667 | ORVEPITANT | |
| 6697 | SPR | DRUGGABLE GENOME, SHORT CHAIN DEHYDROGENASE REDUCTASE, ENZYME | antagonist | CHEMBL515966 | EZLOPITANT |
| Page: 1 2 |

Copyright 2023-Present -The University of Texas Health Science Center at Houston |