
|
|||||
|
 | |
| |
| |
| |
| |
| |
|
Gene: SPPL3 |
Gene summary for SPPL3 |
| Gene information | Species | Human | Gene symbol | SPPL3 | Gene ID | 121665 |
| Gene name | signal peptide peptidase like 3 | |
| Gene Alias | IMP2 | |
| Cytomap | 12q24.31 | |
| Gene Type | protein-coding | GO ID | GO:0002253 | UniProtAcc | Q8TCT6 |
Top |
Malignant transformation analysis |
| Identification of the aberrant gene expression in precancerous and cancerous lesions by comparing the gene expression of stem-like cells in diseased tissues with normal stem cells |
| Entrez ID | Symbol | Replicates | Species | Organ | Tissue | Adj P-value | Log2FC | Malignancy |
| 121665 | SPPL3 | CCI_1 | Human | Cervix | CC | 1.94e-09 | 9.92e-01 | 0.528 |
| 121665 | SPPL3 | CCI_2 | Human | Cervix | CC | 1.31e-10 | 1.16e+00 | 0.5249 |
| 121665 | SPPL3 | CCI_3 | Human | Cervix | CC | 2.97e-14 | 1.02e+00 | 0.516 |
| 121665 | SPPL3 | sample3 | Human | Cervix | CC | 4.47e-06 | 1.85e-01 | 0.1387 |
| 121665 | SPPL3 | T3 | Human | Cervix | CC | 1.28e-02 | 1.56e-01 | 0.1389 |
| 121665 | SPPL3 | HTA11_3410_2000001011 | Human | Colorectum | AD | 1.10e-11 | -4.89e-01 | 0.0155 |
| 121665 | SPPL3 | HTA11_3361_2000001011 | Human | Colorectum | AD | 2.27e-03 | -4.12e-01 | -0.1207 |
| 121665 | SPPL3 | HTA11_10711_2000001011 | Human | Colorectum | AD | 2.51e-04 | -2.87e-01 | 0.0338 |
| 121665 | SPPL3 | HTA11_7696_3000711011 | Human | Colorectum | AD | 2.44e-03 | -2.87e-01 | 0.0674 |
| 121665 | SPPL3 | HTA11_99999974143_84620 | Human | Colorectum | MSS | 1.09e-21 | -5.53e-01 | 0.3005 |
| 121665 | SPPL3 | A001-C-207 | Human | Colorectum | FAP | 2.55e-02 | -2.39e-01 | 0.1278 |
| 121665 | SPPL3 | A015-C-203 | Human | Colorectum | FAP | 1.21e-32 | -6.28e-01 | -0.1294 |
| 121665 | SPPL3 | A015-C-204 | Human | Colorectum | FAP | 3.66e-04 | -2.84e-01 | -0.0228 |
| 121665 | SPPL3 | A014-C-040 | Human | Colorectum | FAP | 4.71e-08 | -6.78e-01 | -0.1184 |
| 121665 | SPPL3 | A002-C-201 | Human | Colorectum | FAP | 5.55e-18 | -5.97e-01 | 0.0324 |
| 121665 | SPPL3 | A001-C-119 | Human | Colorectum | FAP | 3.67e-10 | -6.13e-01 | -0.1557 |
| 121665 | SPPL3 | A001-C-108 | Human | Colorectum | FAP | 2.21e-21 | -4.95e-01 | -0.0272 |
| 121665 | SPPL3 | A002-C-021 | Human | Colorectum | FAP | 2.29e-02 | -5.28e-02 | 0.1171 |
| 121665 | SPPL3 | A002-C-205 | Human | Colorectum | FAP | 6.53e-31 | -7.28e-01 | -0.1236 |
| 121665 | SPPL3 | A001-C-104 | Human | Colorectum | FAP | 7.12e-11 | -4.96e-01 | 0.0184 |
| Page: 1 2 3 4 5 6 7 8 9 10 11 |
| Tissue | Expression Dynamics | Abbreviation |
| Cervix | 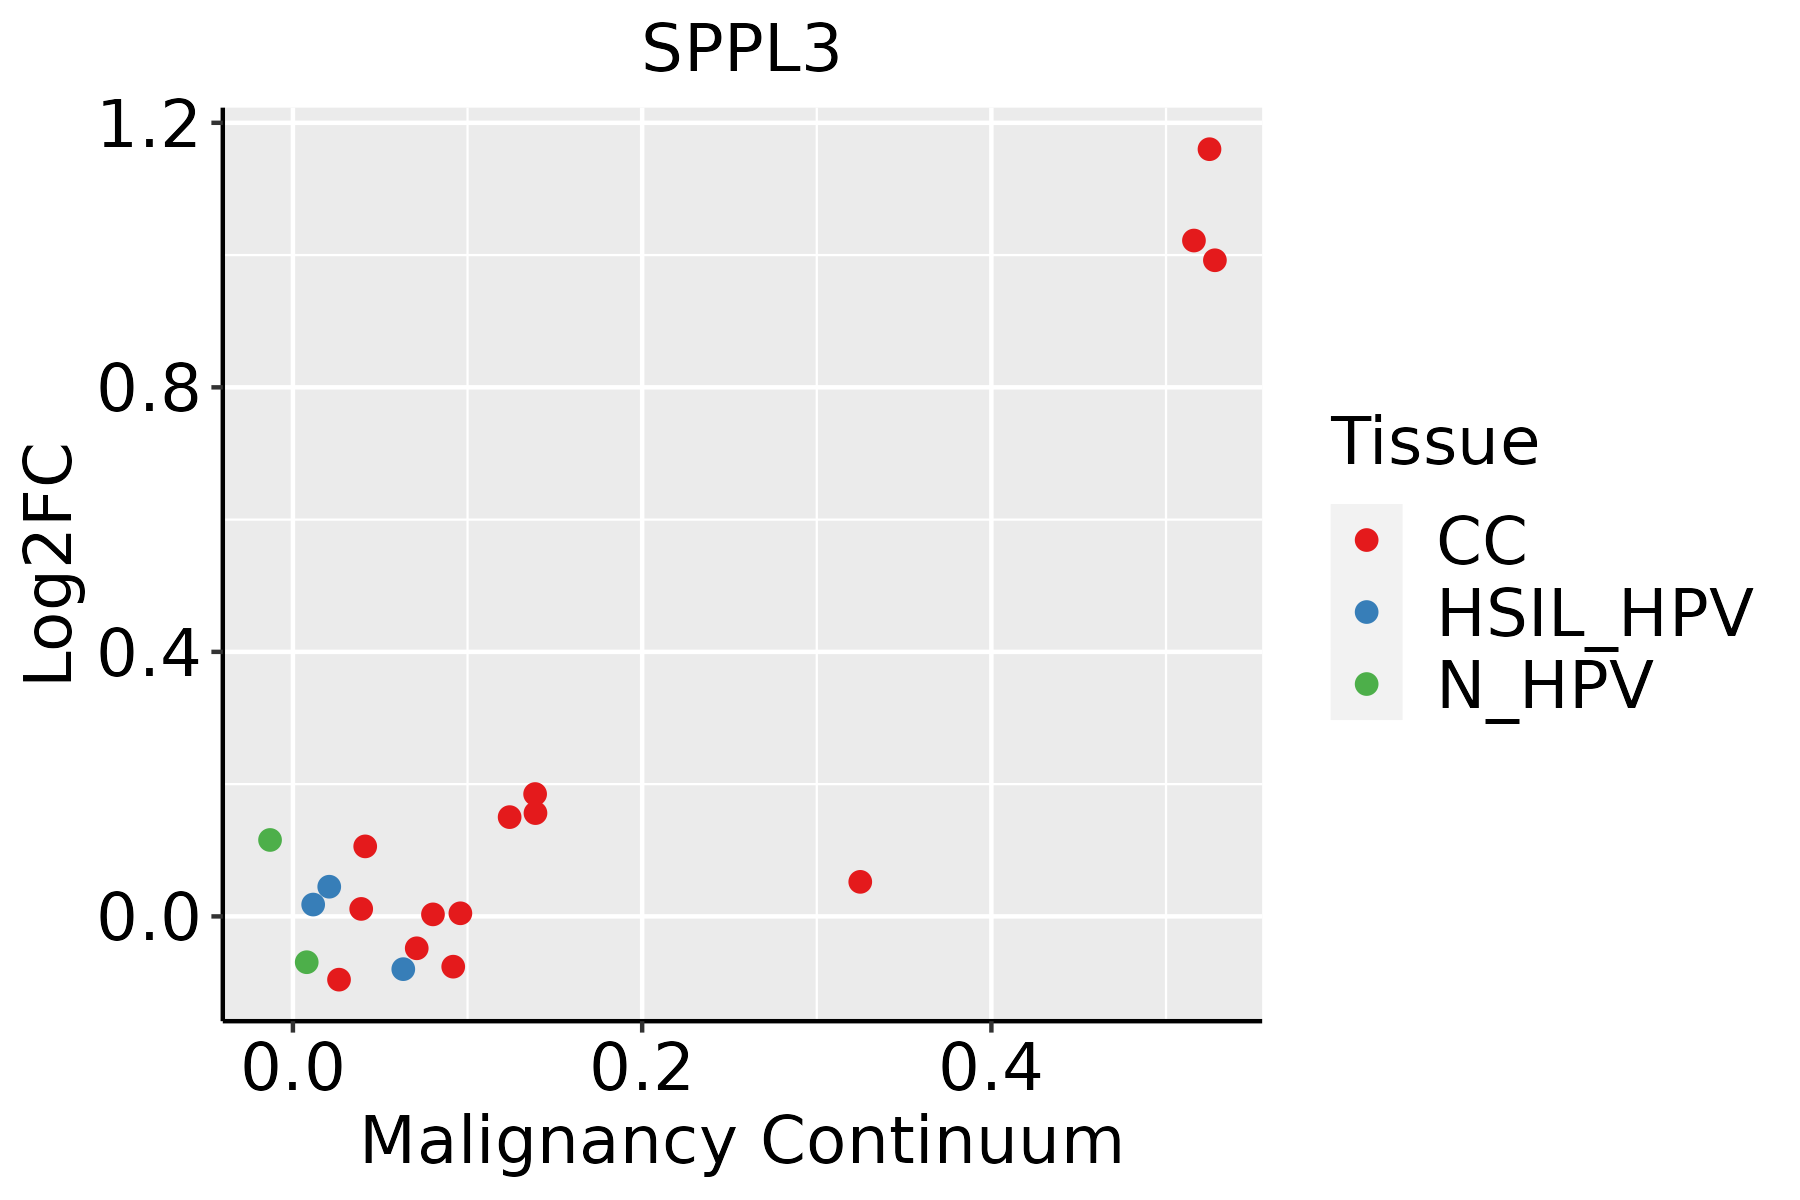 | CC: Cervix cancer |
| HSIL_HPV: HPV-infected high-grade squamous intraepithelial lesions | ||
| N_HPV: HPV-infected normal cervix | ||
| Colorectum (GSE201348) |  | FAP: Familial adenomatous polyposis |
| CRC: Colorectal cancer | ||
| Colorectum (HTA11) |  | AD: Adenomas |
| SER: Sessile serrated lesions | ||
| MSI-H: Microsatellite-high colorectal cancer | ||
| MSS: Microsatellite stable colorectal cancer | ||
| Endometrium | 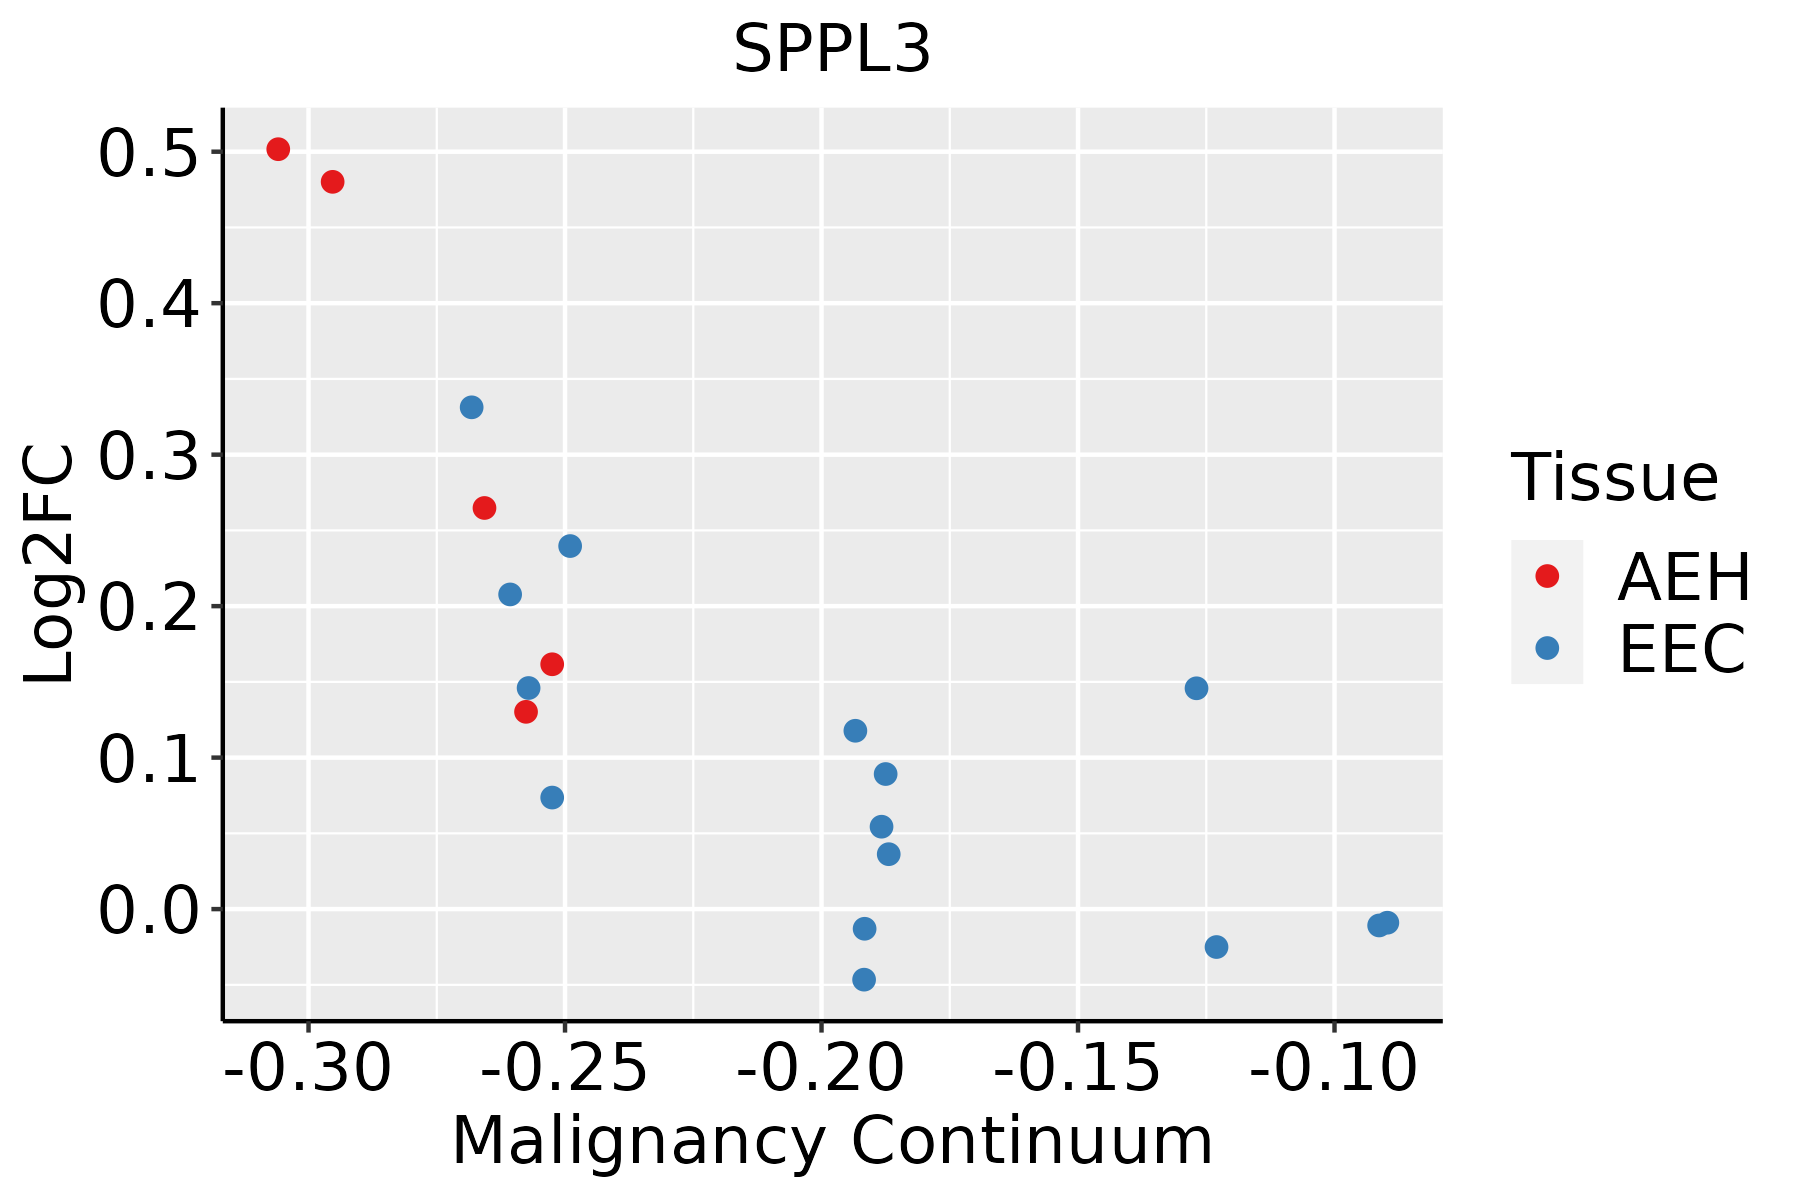 | AEH: Atypical endometrial hyperplasia |
| EEC: Endometrioid Cancer | ||
| Esophagus | 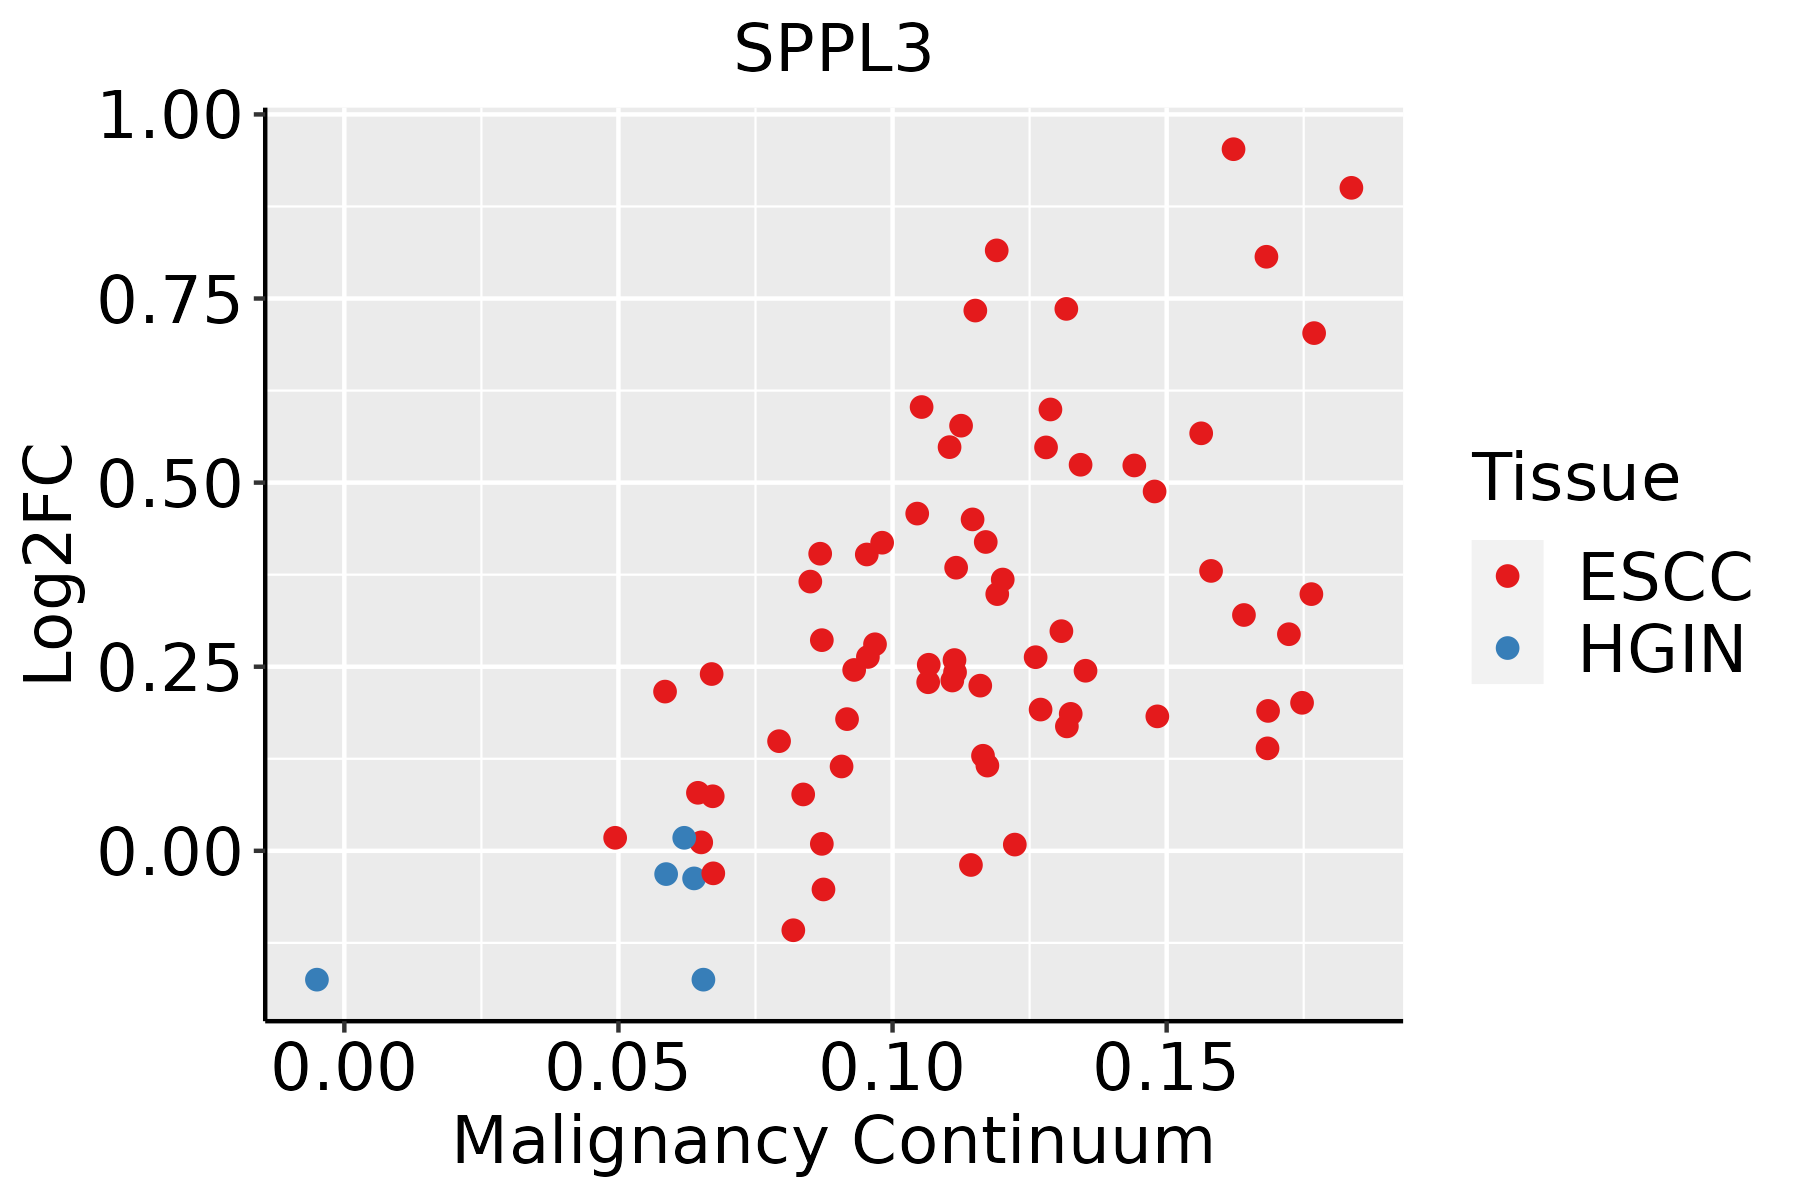 | ESCC: Esophageal squamous cell carcinoma |
| HGIN: High-grade intraepithelial neoplasias | ||
| LGIN: Low-grade intraepithelial neoplasias | ||
| Liver | 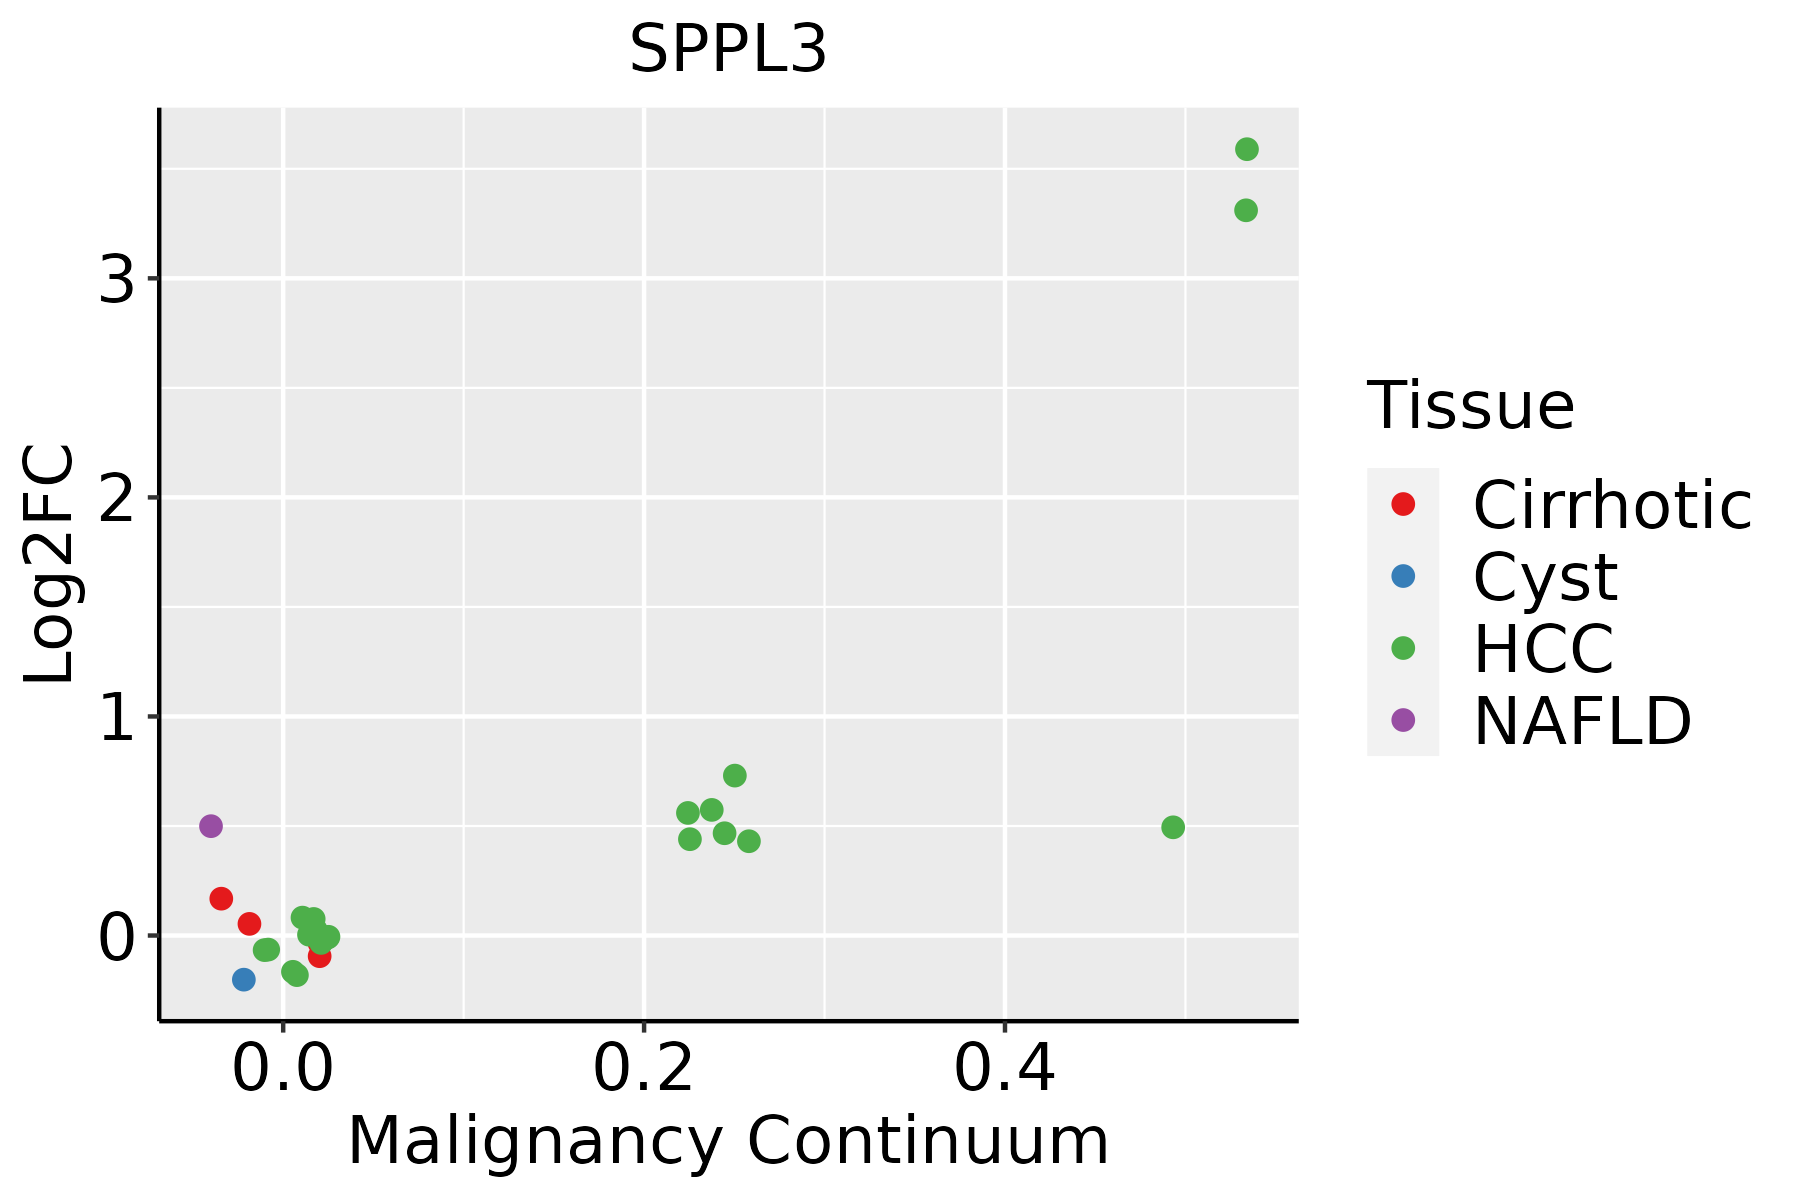 | HCC: Hepatocellular carcinoma |
| NAFLD: Non-alcoholic fatty liver disease | ||
| Lung | 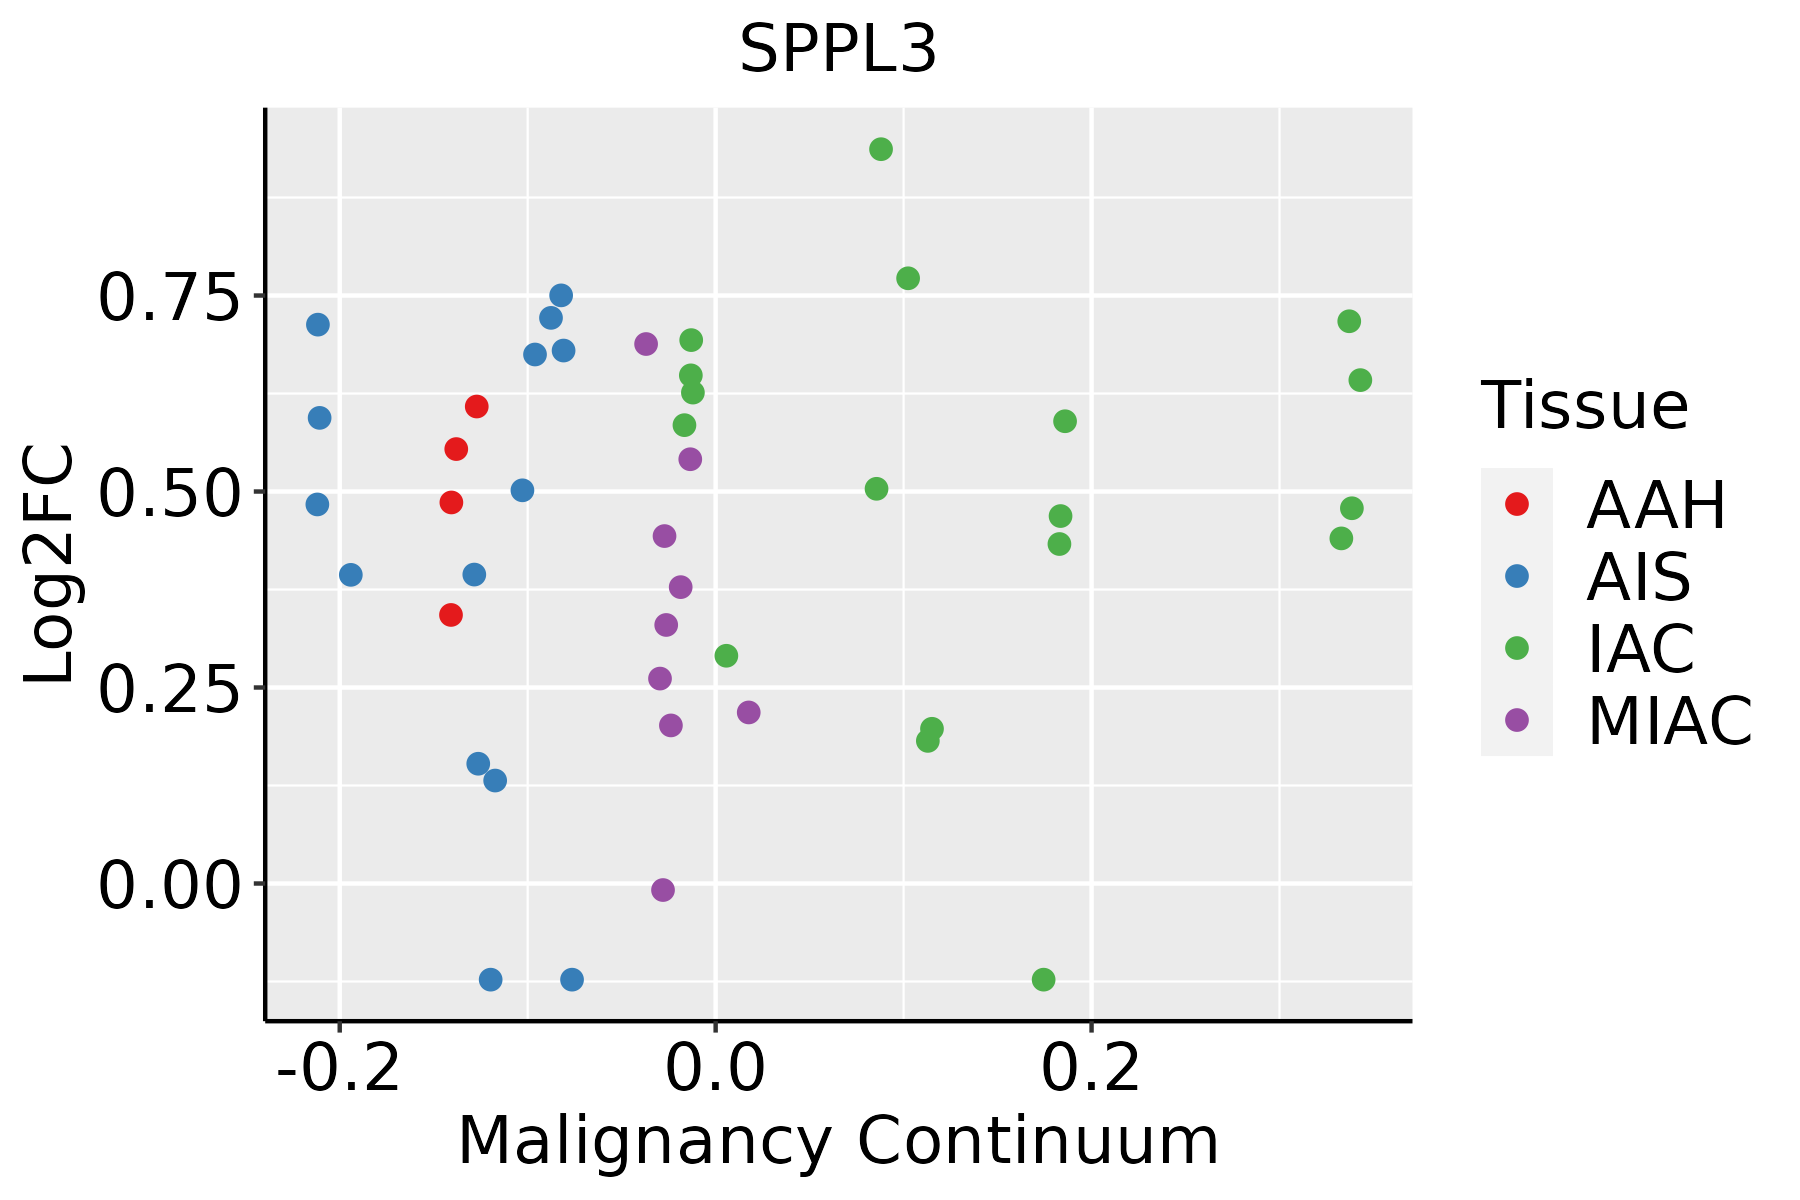 | AAH: Atypical adenomatous hyperplasia |
| AIS: Adenocarcinoma in situ | ||
| IAC: Invasive lung adenocarcinoma | ||
| MIA: Minimally invasive adenocarcinoma | ||
| Oral Cavity | 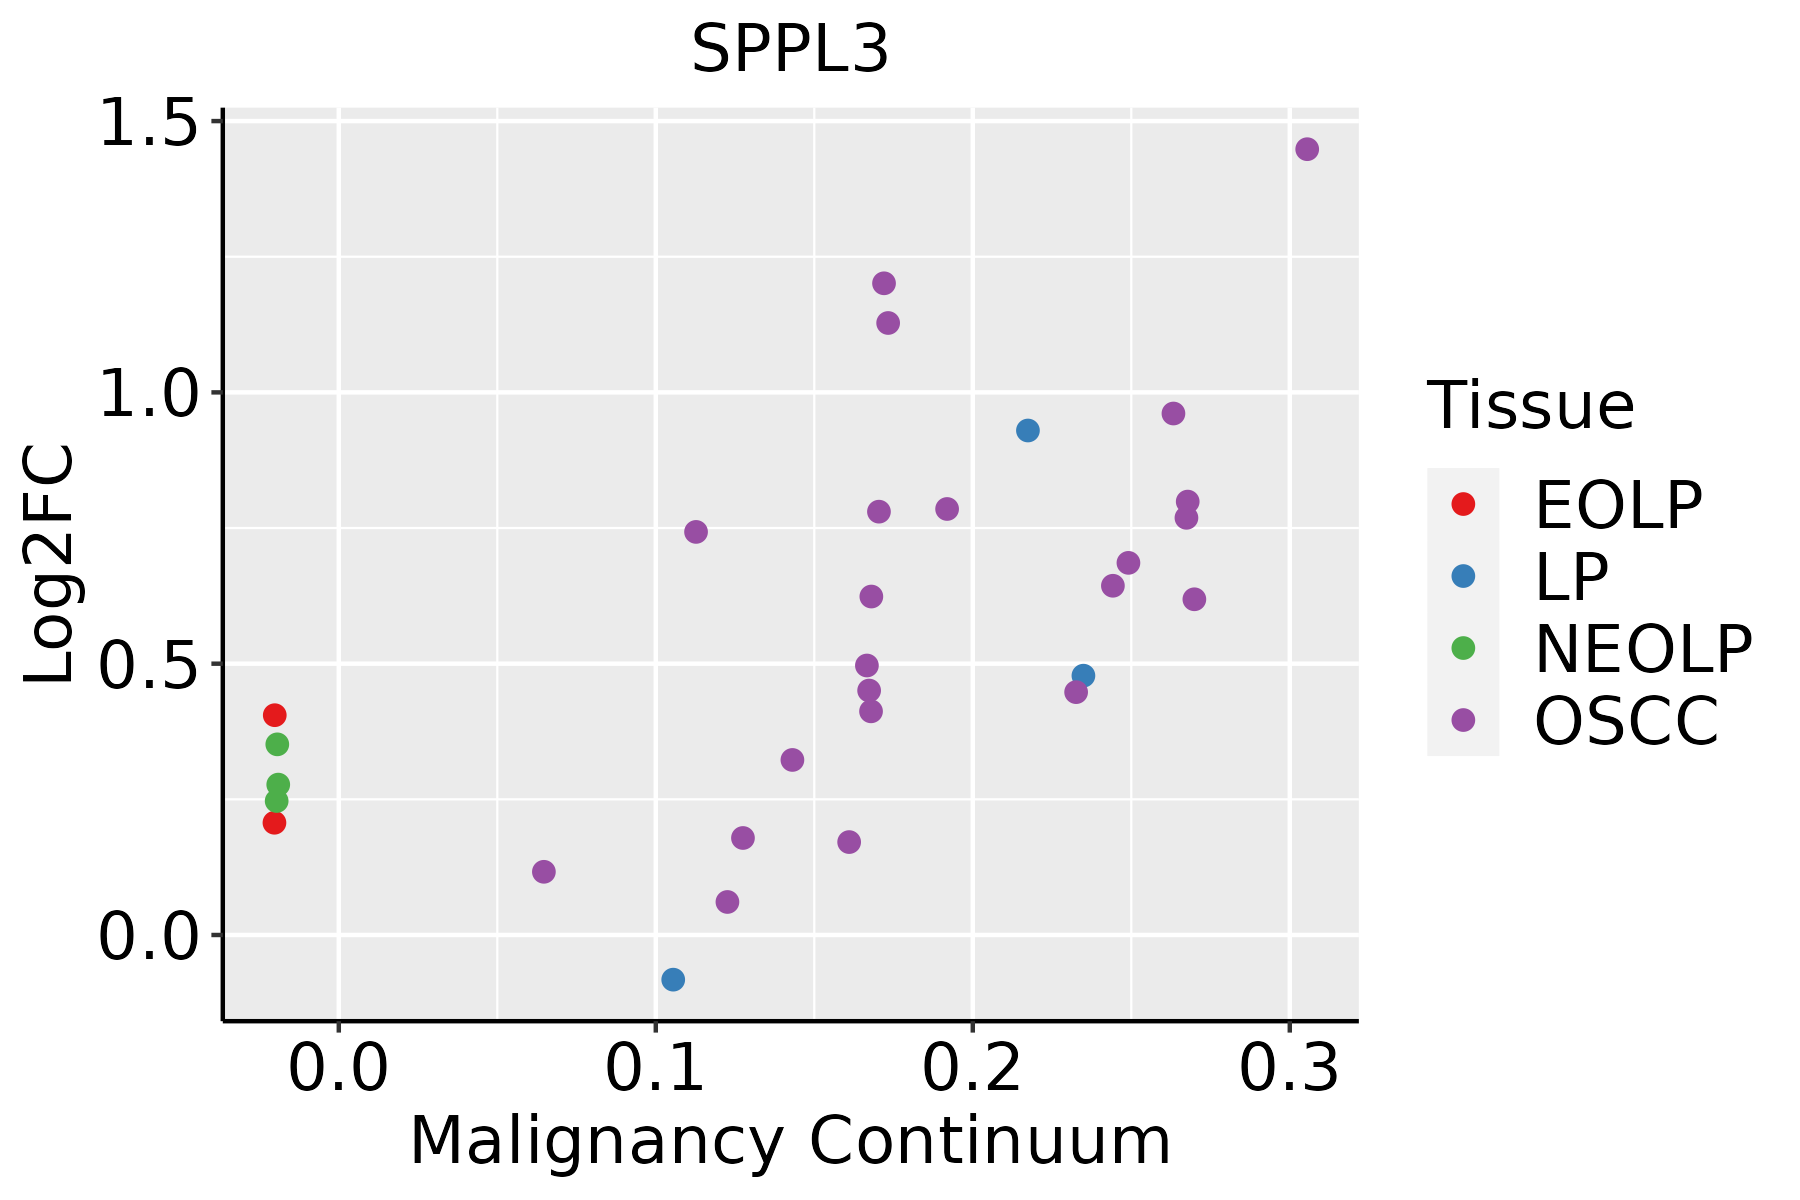 | EOLP: Erosive Oral lichen planus |
| LP: leukoplakia | ||
| NEOLP: Non-erosive oral lichen planus | ||
| OSCC: Oral squamous cell carcinoma | ||
| Prostate |  | BPH: Benign Prostatic Hyperplasia |
| Skin | 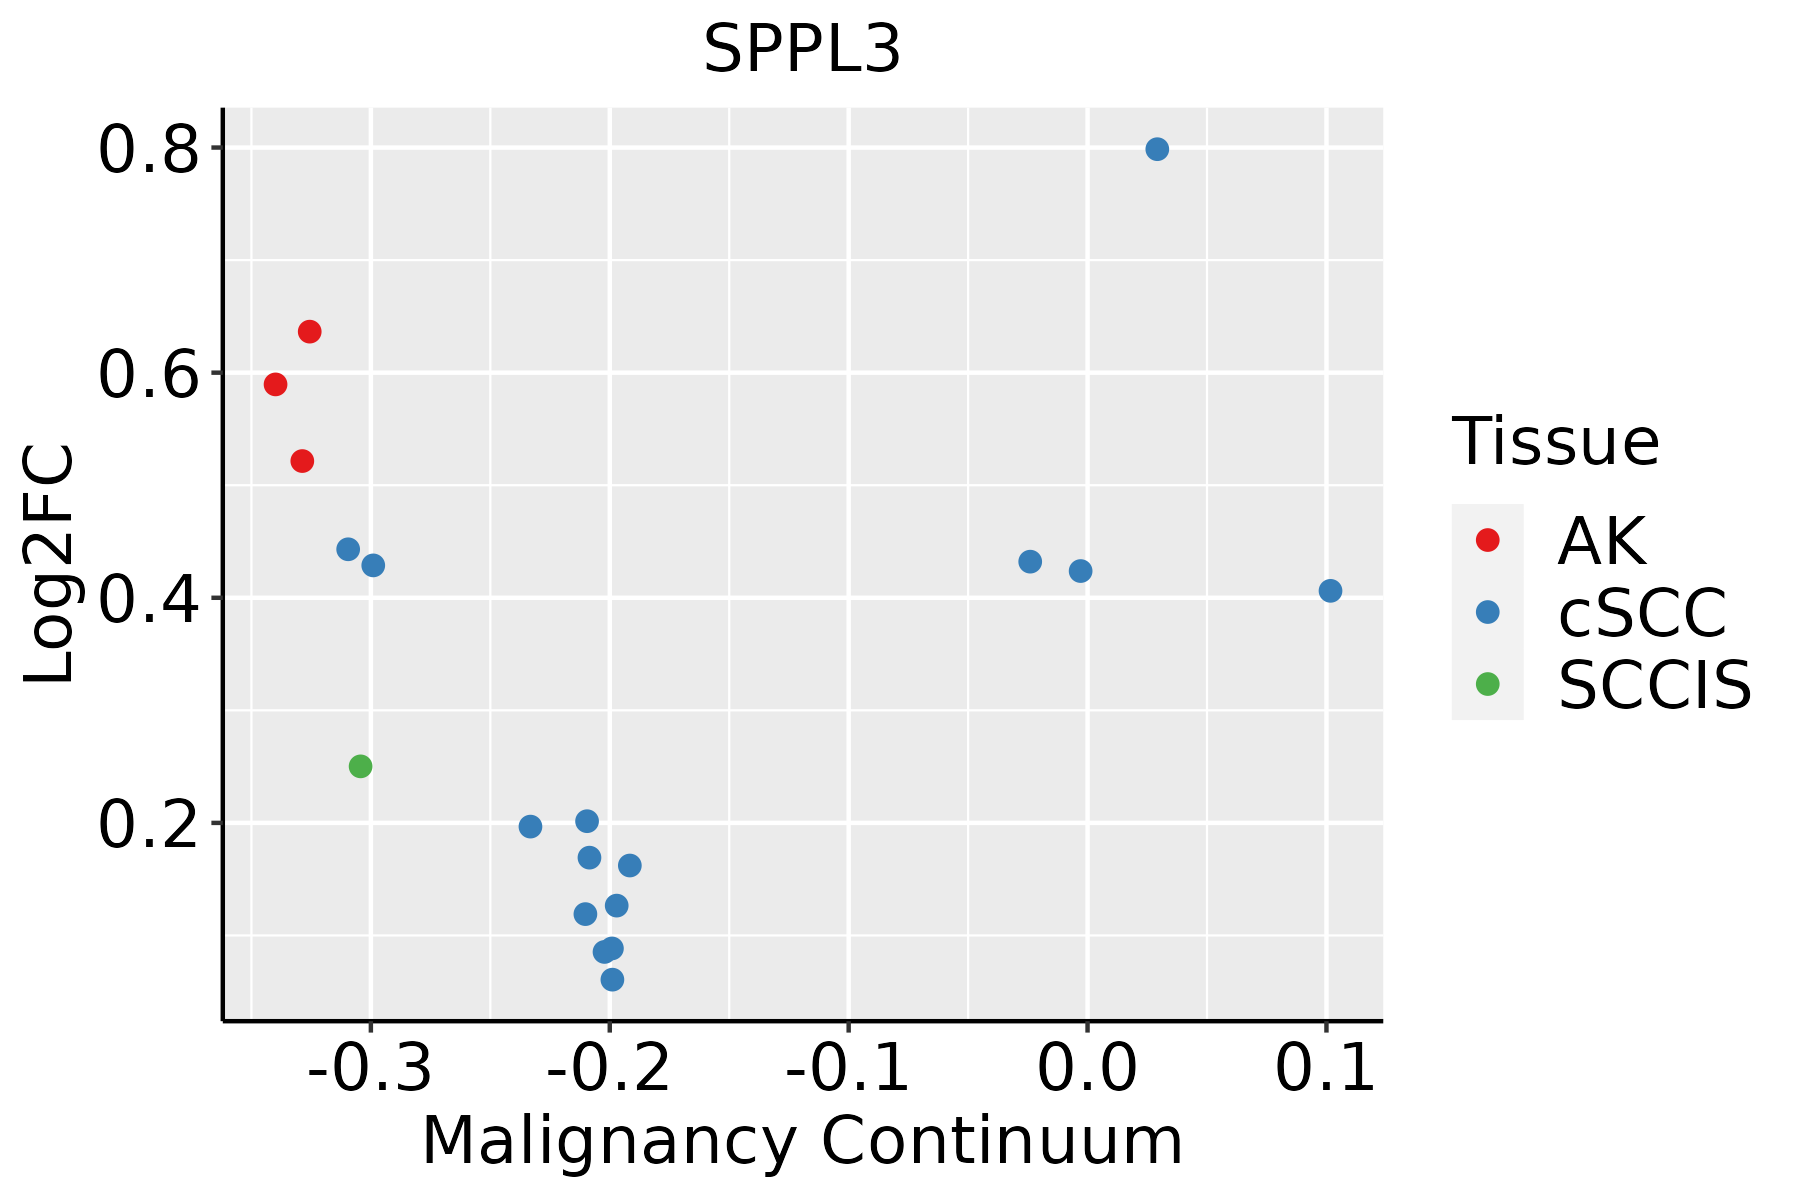 | AK: Actinic keratosis |
| cSCC: Cutaneous squamous cell carcinoma | ||
| SCCIS:squamous cell carcinoma in situ | ||
| Thyroid |  | ATC: Anaplastic thyroid cancer |
| HT: Hashimoto's thyroiditis | ||
| PTC: Papillary thyroid cancer |
| ∗log2FC in expression of this searched gene in stem-like cells from each diseased tissue sample relative to stem-like cells in normal samples in each tissue plotted against the malignancy continuum. Samples are colored based on if they are from different disease stage. |
Top |
Malignant transformation related pathway analysis |
| Find out the enriched GO biological processes and KEGG pathways involved in transition from healthy to precancer to cancer |
| Tissue | Disease Stage | Enriched GO biological Processes |
| Colorectum | AD |  |
| Colorectum | SER |  |
| Colorectum | MSS |  |
| Colorectum | MSI-H |  |
| Colorectum | FAP |  |
| ∗Top 15 enriched GO BP terms are showed in the bar plot of each disease state in each tissue. Each row represents a significant GO biological process which is colored according to the -log10(p.adjust). |
| Page: 1 2 3 4 5 6 7 8 9 |
| GO ID | Tissue | Disease Stage | Description | Gene Ratio | Bg Ratio | pvalue | p.adjust | Count |
| GO:005109810 | Cervix | CC | regulation of binding | 80/2311 | 363/18723 | 1.32e-07 | 6.42e-06 | 80 |
| GO:00027644 | Cervix | CC | immune response-regulating signaling pathway | 97/2311 | 468/18723 | 1.49e-07 | 7.07e-06 | 97 |
| GO:005109910 | Cervix | CC | positive regulation of binding | 42/2311 | 173/18723 | 1.07e-05 | 2.33e-04 | 42 |
| GO:00064708 | Cervix | CC | protein dephosphorylation | 60/2311 | 281/18723 | 1.33e-05 | 2.68e-04 | 60 |
| GO:00064657 | Cervix | CC | signal peptide processing | 8/2311 | 14/18723 | 8.01e-05 | 1.09e-03 | 8 |
| GO:00022533 | Cervix | CC | activation of immune response | 72/2311 | 375/18723 | 8.26e-05 | 1.11e-03 | 72 |
| GO:003530310 | Cervix | CC | regulation of dephosphorylation | 31/2311 | 128/18723 | 1.52e-04 | 1.83e-03 | 31 |
| GO:003530410 | Cervix | CC | regulation of protein dephosphorylation | 24/2311 | 90/18723 | 1.73e-04 | 2.04e-03 | 24 |
| GO:00433939 | Cervix | CC | regulation of protein binding | 42/2311 | 196/18723 | 2.27e-04 | 2.55e-03 | 42 |
| GO:00516048 | Cervix | CC | protein maturation | 56/2311 | 294/18723 | 5.90e-04 | 5.59e-03 | 56 |
| GO:0002768 | Cervix | CC | immune response-regulating cell surface receptor signaling pathway | 59/2311 | 315/18723 | 6.64e-04 | 6.11e-03 | 59 |
| GO:00163117 | Cervix | CC | dephosphorylation | 73/2311 | 417/18723 | 1.23e-03 | 9.87e-03 | 73 |
| GO:00320927 | Cervix | CC | positive regulation of protein binding | 21/2311 | 85/18723 | 1.27e-03 | 1.01e-02 | 21 |
| GO:00508524 | Cervix | CC | T cell receptor signaling pathway | 27/2311 | 123/18723 | 1.93e-03 | 1.42e-02 | 27 |
| GO:0051098 | Colorectum | AD | regulation of binding | 126/3918 | 363/18723 | 6.01e-10 | 4.88e-08 | 126 |
| GO:0051099 | Colorectum | AD | positive regulation of binding | 66/3918 | 173/18723 | 1.47e-07 | 6.64e-06 | 66 |
| GO:0043393 | Colorectum | AD | regulation of protein binding | 68/3918 | 196/18723 | 5.17e-06 | 1.34e-04 | 68 |
| GO:0016311 | Colorectum | AD | dephosphorylation | 123/3918 | 417/18723 | 1.84e-05 | 3.82e-04 | 123 |
| GO:0006470 | Colorectum | AD | protein dephosphorylation | 88/3918 | 281/18723 | 2.56e-05 | 4.89e-04 | 88 |
| GO:0035303 | Colorectum | AD | regulation of dephosphorylation | 46/3918 | 128/18723 | 6.20e-05 | 1.04e-03 | 46 |
| Page: 1 2 3 4 5 6 7 8 9 10 11 12 13 14 15 16 |
| Pathway ID | Tissue | Disease Stage | Description | Gene Ratio | Bg Ratio | pvalue | p.adjust | qvalue | Count |
| Page: 1 |
Top |
Cell-cell communication analysis |
| Identification of potential cell-cell interactions between two cell types and their ligand-receptor pairs for different disease states |
| Ligand | Receptor | LRpair | Pathway | Tissue | Disease Stage |
| Page: 1 |
Top |
Single-cell gene regulatory network inference analysis |
| Find out the significant the regulons (TFs) and the target genes of each regulon across cell types for different disease states |
| TF | Cell Type | Tissue | Disease Stage | Target Gene | RSS | Regulon Activity |
| ∗The dot plots of a searched regulon are shown for all cell subpopulations in each disease state of each tissue based on the regulon specific score inferred using pySCENIC and by calculating the average expression. |
| Page: 1 |
Top |
Somatic mutation of malignant transformation related genes |
| Annotation of somatic variants for genes involved in malignant transformation |
| Hugo Symbol | Variant Class | Variant Classification | dbSNP RS | HGVSc | HGVSp | HGVSp Short | SWISSPROT | BIOTYPE | SIFT | PolyPhen | Tumor Sample Barcode | Tissue | Histology | Sex | Age | Stage | Therapy Types | Drugs | Outcome |
| SPPL3 | SNV | Missense_Mutation | c.1094G>A | p.Arg365Gln | p.R365Q | Q8TCT6 | protein_coding | tolerated(0.1) | possibly_damaging(0.726) | TCGA-AN-A0FX-01 | Breast | breast invasive carcinoma | Female | <65 | I/II | Unknown | Unknown | SD | |
| SPPL3 | SNV | Missense_Mutation | rs748637155 | c.545G>C | p.Arg182Pro | p.R182P | Q8TCT6 | protein_coding | deleterious(0) | probably_damaging(0.996) | TCGA-AR-A0TQ-01 | Breast | breast invasive carcinoma | Female | <65 | III/IV | Chemotherapy | doxorubicin | SD |
| SPPL3 | SNV | Missense_Mutation | c.101N>T | p.Arg34Met | p.R34M | Q8TCT6 | protein_coding | deleterious(0) | benign(0.293) | TCGA-BH-A0C0-01 | Breast | breast invasive carcinoma | Female | <65 | I/II | Chemotherapy | carboplatin | SD | |
| SPPL3 | SNV | Missense_Mutation | c.92N>A | p.Gly31Asp | p.G31D | Q8TCT6 | protein_coding | deleterious(0) | benign(0.039) | TCGA-BH-A18Q-01 | Breast | breast invasive carcinoma | Female | <65 | I/II | Unknown | Unknown | SD | |
| SPPL3 | SNV | Missense_Mutation | c.248N>G | p.Ser83Cys | p.S83C | Q8TCT6 | protein_coding | deleterious(0) | probably_damaging(0.989) | TCGA-E9-A1ND-01 | Breast | breast invasive carcinoma | Female | >=65 | I/II | Hormone Therapy | aromasin | SD | |
| SPPL3 | SNV | Missense_Mutation | novel | c.816C>G | p.Ile272Met | p.I272M | Q8TCT6 | protein_coding | tolerated(0.55) | probably_damaging(0.943) | TCGA-UU-A93S-01 | Breast | breast invasive carcinoma | Female | <65 | III/IV | Unknown | Unknown | PD |
| SPPL3 | insertion | In_Frame_Ins | novel | c.45_46insTCTATTCTG | p.Ser16_Gln17insIleLeuSer | p.S16_Q17insILS | Q8TCT6 | protein_coding | TCGA-DS-A1OC-01 | Cervix | cervical & endocervical cancer | Female | <65 | I/II | Chemotherapy | gemcitabine | SD | ||
| SPPL3 | SNV | Missense_Mutation | c.101N>A | p.Arg34Lys | p.R34K | Q8TCT6 | protein_coding | deleterious(0.01) | benign(0.192) | TCGA-A6-2672-01 | Colorectum | colon adenocarcinoma | Female | >=65 | III/IV | Unknown | Unknown | SD | |
| SPPL3 | SNV | Missense_Mutation | novel | c.545N>A | p.Arg182His | p.R182H | Q8TCT6 | protein_coding | deleterious(0) | probably_damaging(0.995) | TCGA-AA-3877-01 | Colorectum | colon adenocarcinoma | Female | >=65 | I/II | Unknown | Unknown | SD |
| SPPL3 | SNV | Missense_Mutation | c.985N>A | p.Ala329Thr | p.A329T | Q8TCT6 | protein_coding | deleterious(0.02) | probably_damaging(0.992) | TCGA-AA-A00N-01 | Colorectum | colon adenocarcinoma | Male | >=65 | I/II | Unknown | Unknown | PD |
| Page: 1 2 3 4 |
Top |
Related drugs of malignant transformation related genes |
| Identification of chemicals and drugs interact with genes involved in malignant transfromation |
| (DGIdb 4.0) |
| Entrez ID | Symbol | Category | Interaction Types | Drug Claim Name | Drug Name | PMIDs |
| Page: 1 |

Copyright 2023-Present -The University of Texas Health Science Center at Houston |