
|
|||||
|
 | |
| |
| |
| |
| |
| |
|
Gene: SPPL2B |
Gene summary for SPPL2B |
| Gene information | Species | Human | Gene symbol | SPPL2B | Gene ID | 56928 |
| Gene name | signal peptide peptidase like 2B | |
| Gene Alias | IMP-4 | |
| Cytomap | 19p13.3 | |
| Gene Type | protein-coding | GO ID | GO:0001959 | UniProtAcc | Q8TCT7 |
Top |
Malignant transformation analysis |
| Identification of the aberrant gene expression in precancerous and cancerous lesions by comparing the gene expression of stem-like cells in diseased tissues with normal stem cells |
| Entrez ID | Symbol | Replicates | Species | Organ | Tissue | Adj P-value | Log2FC | Malignancy |
| 56928 | SPPL2B | LZE7T | Human | Esophagus | ESCC | 1.32e-05 | 1.96e-01 | 0.0667 |
| 56928 | SPPL2B | LZE8T | Human | Esophagus | ESCC | 2.04e-05 | 1.55e-01 | 0.067 |
| 56928 | SPPL2B | LZE20T | Human | Esophagus | ESCC | 3.64e-03 | 7.29e-02 | 0.0662 |
| 56928 | SPPL2B | LZE22T | Human | Esophagus | ESCC | 1.01e-03 | 1.87e-01 | 0.068 |
| 56928 | SPPL2B | LZE24T | Human | Esophagus | ESCC | 9.22e-16 | 2.63e-01 | 0.0596 |
| 56928 | SPPL2B | LZE21T | Human | Esophagus | ESCC | 3.34e-03 | 1.47e-01 | 0.0655 |
| 56928 | SPPL2B | P1T-E | Human | Esophagus | ESCC | 3.46e-09 | 2.61e-01 | 0.0875 |
| 56928 | SPPL2B | P2T-E | Human | Esophagus | ESCC | 3.73e-10 | 2.10e-01 | 0.1177 |
| 56928 | SPPL2B | P4T-E | Human | Esophagus | ESCC | 2.24e-10 | 1.87e-01 | 0.1323 |
| 56928 | SPPL2B | P5T-E | Human | Esophagus | ESCC | 8.79e-07 | 6.87e-02 | 0.1327 |
| 56928 | SPPL2B | P8T-E | Human | Esophagus | ESCC | 1.04e-04 | 1.68e-01 | 0.0889 |
| 56928 | SPPL2B | P9T-E | Human | Esophagus | ESCC | 1.04e-09 | 1.93e-01 | 0.1131 |
| 56928 | SPPL2B | P10T-E | Human | Esophagus | ESCC | 2.07e-17 | 3.42e-01 | 0.116 |
| 56928 | SPPL2B | P11T-E | Human | Esophagus | ESCC | 3.67e-08 | 2.02e-01 | 0.1426 |
| 56928 | SPPL2B | P12T-E | Human | Esophagus | ESCC | 2.61e-19 | 3.21e-01 | 0.1122 |
| 56928 | SPPL2B | P15T-E | Human | Esophagus | ESCC | 4.83e-20 | 3.11e-01 | 0.1149 |
| 56928 | SPPL2B | P16T-E | Human | Esophagus | ESCC | 1.55e-10 | 2.60e-01 | 0.1153 |
| 56928 | SPPL2B | P17T-E | Human | Esophagus | ESCC | 2.34e-06 | 2.34e-01 | 0.1278 |
| 56928 | SPPL2B | P19T-E | Human | Esophagus | ESCC | 1.16e-05 | 2.47e-01 | 0.1662 |
| 56928 | SPPL2B | P20T-E | Human | Esophagus | ESCC | 2.81e-12 | 1.49e-01 | 0.1124 |
| Page: 1 2 3 4 |
| Tissue | Expression Dynamics | Abbreviation |
| Esophagus | 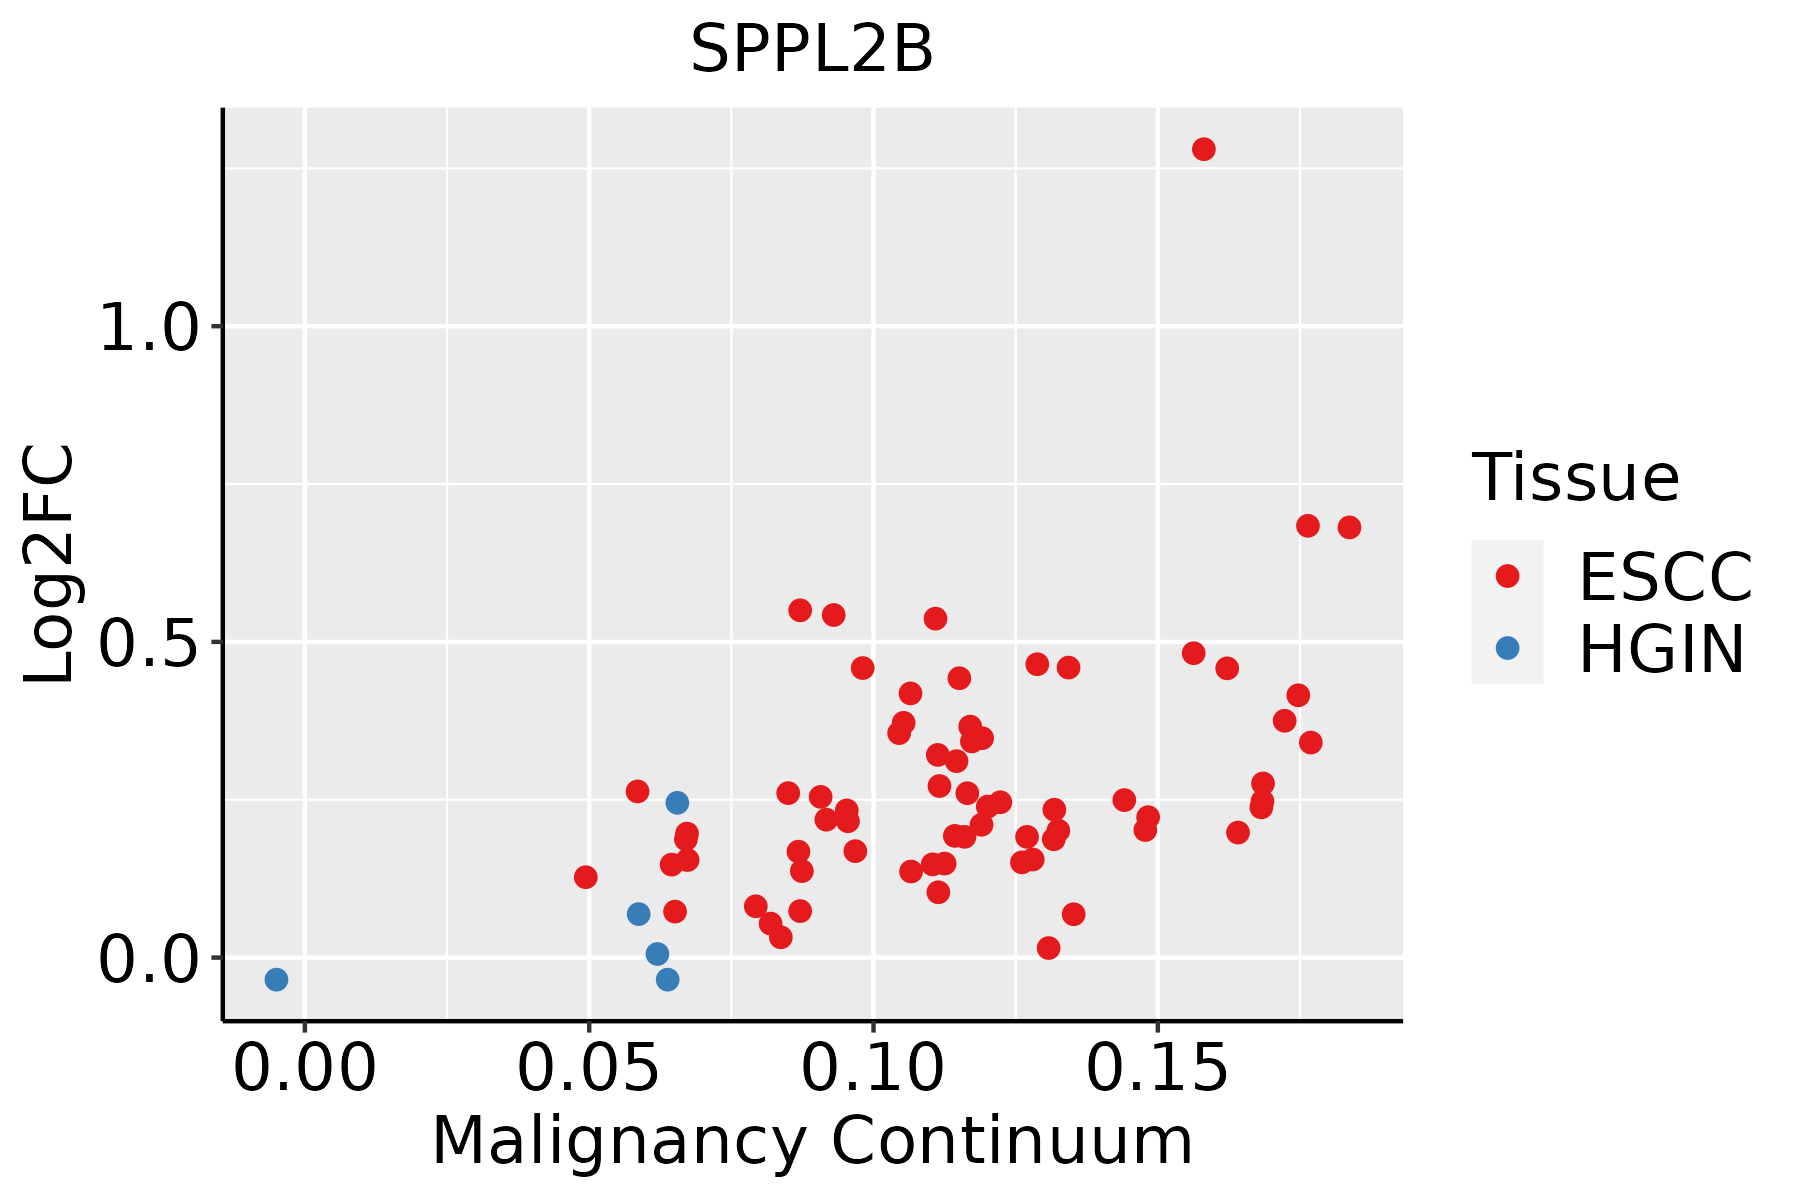 | ESCC: Esophageal squamous cell carcinoma |
| HGIN: High-grade intraepithelial neoplasias | ||
| LGIN: Low-grade intraepithelial neoplasias | ||
| Thyroid | 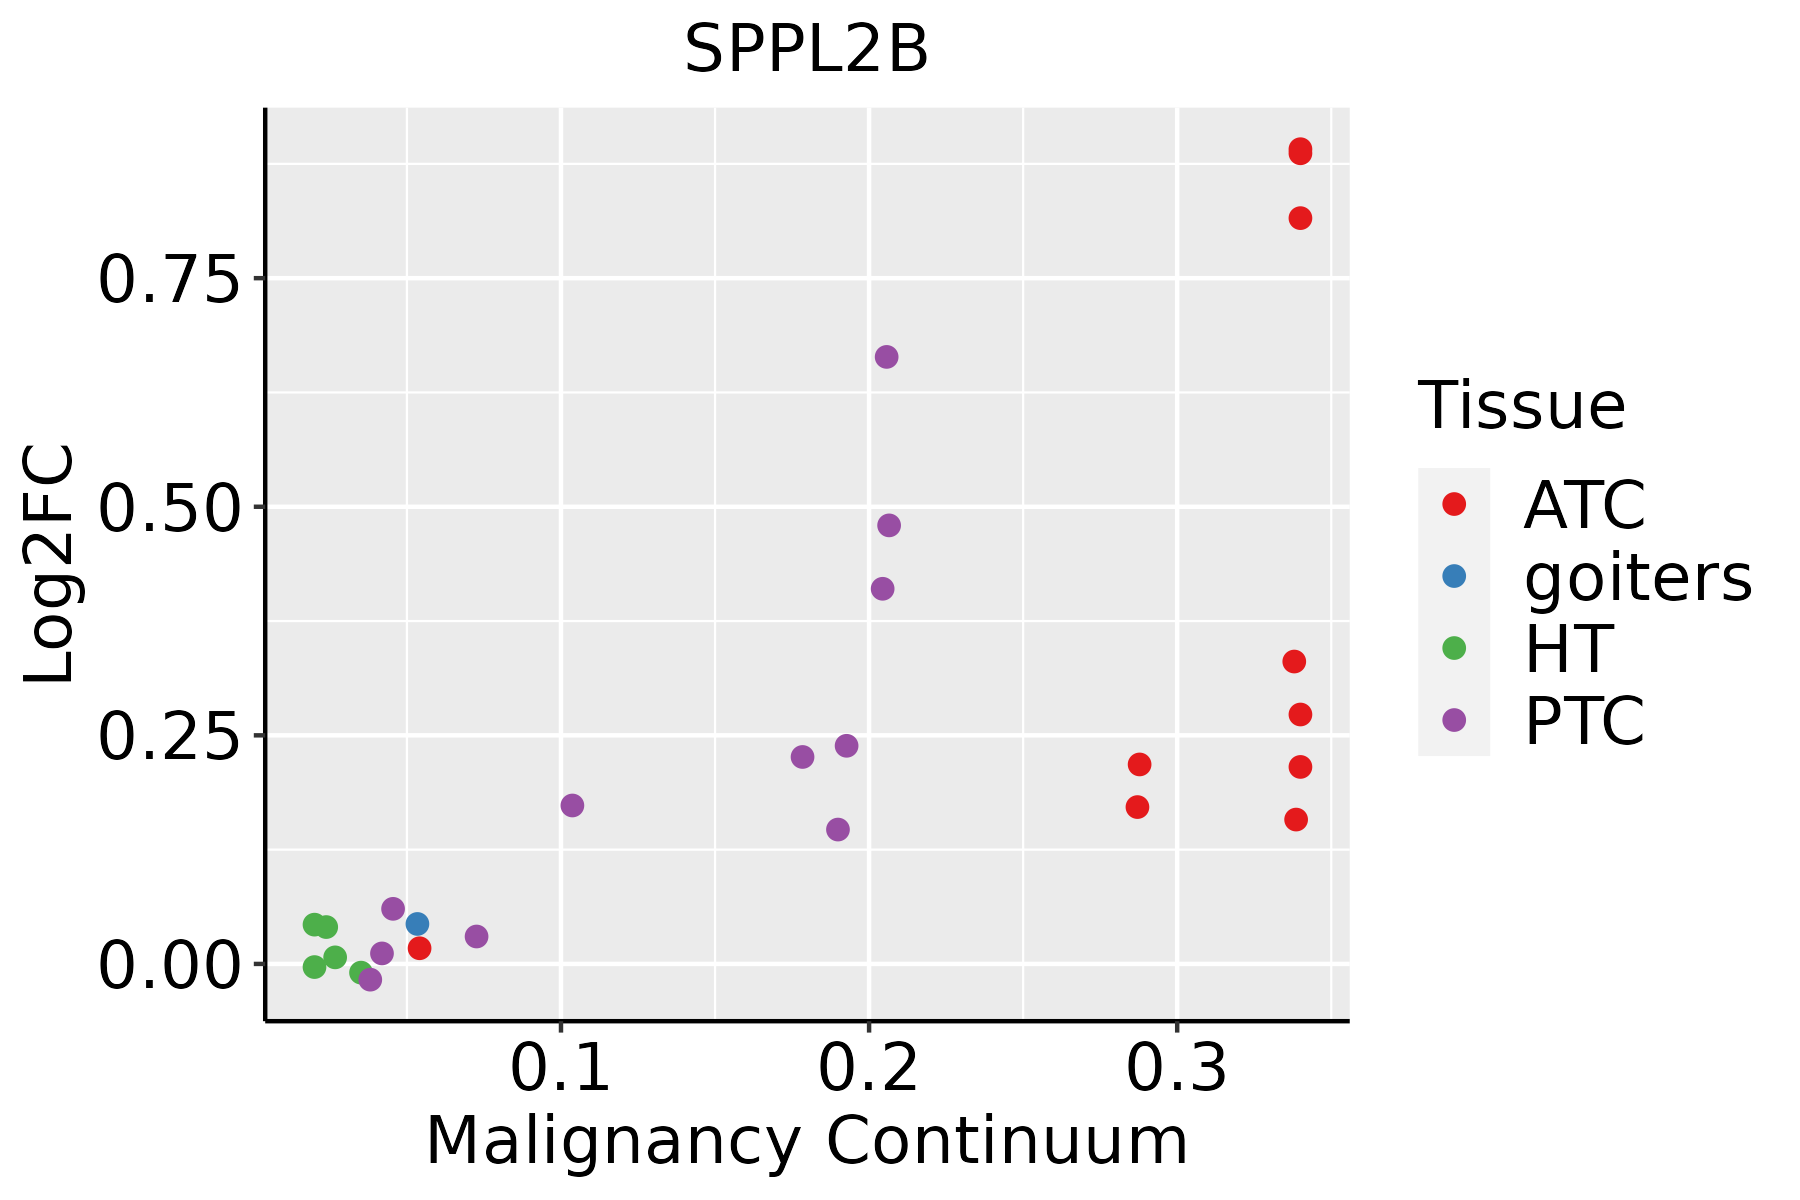 | ATC: Anaplastic thyroid cancer |
| HT: Hashimoto's thyroiditis | ||
| PTC: Papillary thyroid cancer |
| ∗log2FC in expression of this searched gene in stem-like cells from each diseased tissue sample relative to stem-like cells in normal samples in each tissue plotted against the malignancy continuum. Samples are colored based on if they are from different disease stage. |
Top |
Malignant transformation related pathway analysis |
| Find out the enriched GO biological processes and KEGG pathways involved in transition from healthy to precancer to cancer |
| Tissue | Disease Stage | Enriched GO biological Processes |
| Colorectum | AD |  |
| Colorectum | SER |  |
| Colorectum | MSS |  |
| Colorectum | MSI-H |  |
| Colorectum | FAP |  |
| ∗Top 15 enriched GO BP terms are showed in the bar plot of each disease state in each tissue. Each row represents a significant GO biological process which is colored according to the -log10(p.adjust). |
| Page: 1 2 3 4 5 6 7 8 9 |
| GO ID | Tissue | Disease Stage | Description | Gene Ratio | Bg Ratio | pvalue | p.adjust | Count |
| GO:00607595 | Esophagus | ESCC | regulation of response to cytokine stimulus | 103/8552 | 162/18723 | 3.14e-06 | 3.53e-05 | 103 |
| GO:003320914 | Esophagus | ESCC | tumor necrosis factor-mediated signaling pathway | 67/8552 | 99/18723 | 7.87e-06 | 7.72e-05 | 67 |
| GO:00019595 | Esophagus | ESCC | regulation of cytokine-mediated signaling pathway | 95/8552 | 150/18723 | 9.48e-06 | 9.04e-05 | 95 |
| GO:003461220 | Esophagus | ESCC | response to tumor necrosis factor | 149/8552 | 253/18723 | 1.47e-05 | 1.33e-04 | 149 |
| GO:007135620 | Esophagus | ESCC | cellular response to tumor necrosis factor | 132/8552 | 229/18723 | 1.69e-04 | 1.11e-03 | 132 |
| GO:00065095 | Esophagus | ESCC | membrane protein ectodomain proteolysis | 31/8552 | 43/18723 | 4.04e-04 | 2.30e-03 | 31 |
| GO:00336195 | Esophagus | ESCC | membrane protein proteolysis | 39/8552 | 57/18723 | 4.34e-04 | 2.44e-03 | 39 |
| GO:00108033 | Esophagus | ESCC | regulation of tumor necrosis factor-mediated signaling pathway | 31/8552 | 47/18723 | 4.01e-03 | 1.62e-02 | 31 |
| GO:00336197 | Thyroid | PTC | membrane protein proteolysis | 36/5968 | 57/18723 | 1.16e-06 | 1.69e-05 | 36 |
| GO:000650913 | Thyroid | PTC | membrane protein ectodomain proteolysis | 27/5968 | 43/18723 | 2.96e-05 | 2.85e-04 | 27 |
| GO:0034612111 | Thyroid | PTC | response to tumor necrosis factor | 109/5968 | 253/18723 | 1.08e-04 | 8.69e-04 | 109 |
| GO:0071356111 | Thyroid | PTC | cellular response to tumor necrosis factor | 96/5968 | 229/18723 | 8.24e-04 | 5.10e-03 | 96 |
| GO:00607597 | Thyroid | PTC | regulation of response to cytokine stimulus | 70/5968 | 162/18723 | 1.54e-03 | 8.58e-03 | 70 |
| GO:00019596 | Thyroid | PTC | regulation of cytokine-mediated signaling pathway | 64/5968 | 150/18723 | 3.43e-03 | 1.66e-02 | 64 |
| GO:003320916 | Thyroid | PTC | tumor necrosis factor-mediated signaling pathway | 44/5968 | 99/18723 | 5.77e-03 | 2.60e-02 | 44 |
| GO:003361914 | Thyroid | ATC | membrane protein proteolysis | 35/6293 | 57/18723 | 1.58e-05 | 1.46e-04 | 35 |
| GO:003461228 | Thyroid | ATC | response to tumor necrosis factor | 116/6293 | 253/18723 | 3.22e-05 | 2.68e-04 | 116 |
| GO:000650922 | Thyroid | ATC | membrane protein ectodomain proteolysis | 27/6293 | 43/18723 | 8.44e-05 | 6.30e-04 | 27 |
| GO:006075912 | Thyroid | ATC | regulation of response to cytokine stimulus | 76/6293 | 162/18723 | 2.92e-04 | 1.85e-03 | 76 |
| GO:000195912 | Thyroid | ATC | regulation of cytokine-mediated signaling pathway | 71/6293 | 150/18723 | 3.28e-04 | 2.04e-03 | 71 |
| Page: 1 2 |
| Pathway ID | Tissue | Disease Stage | Description | Gene Ratio | Bg Ratio | pvalue | p.adjust | qvalue | Count |
| Page: 1 |
Top |
Cell-cell communication analysis |
| Identification of potential cell-cell interactions between two cell types and their ligand-receptor pairs for different disease states |
| Ligand | Receptor | LRpair | Pathway | Tissue | Disease Stage |
| Page: 1 |
Top |
Single-cell gene regulatory network inference analysis |
| Find out the significant the regulons (TFs) and the target genes of each regulon across cell types for different disease states |
| TF | Cell Type | Tissue | Disease Stage | Target Gene | RSS | Regulon Activity |
| ∗The dot plots of a searched regulon are shown for all cell subpopulations in each disease state of each tissue based on the regulon specific score inferred using pySCENIC and by calculating the average expression. |
| Page: 1 |
Top |
Somatic mutation of malignant transformation related genes |
| Annotation of somatic variants for genes involved in malignant transformation |
| Hugo Symbol | Variant Class | Variant Classification | dbSNP RS | HGVSc | HGVSp | HGVSp Short | SWISSPROT | BIOTYPE | SIFT | PolyPhen | Tumor Sample Barcode | Tissue | Histology | Sex | Age | Stage | Therapy Types | Drugs | Outcome |
| SPPL2B | SNV | Missense_Mutation | rs372155490 | c.665N>T | p.Thr222Met | p.T222M | Q8TCT7 | protein_coding | deleterious(0.01) | probably_damaging(0.986) | TCGA-A1-A0SK-01 | Breast | breast invasive carcinoma | Female | <65 | I/II | Unknown | Unknown | PD |
| SPPL2B | deletion | Frame_Shift_Del | novel | c.383delG | p.Gly128ValfsTer32 | p.G128Vfs*32 | Q8TCT7 | protein_coding | TCGA-EA-A410-01 | Cervix | cervical & endocervical cancer | Female | <65 | I/II | Unknown | Unknown | SD | ||
| SPPL2B | SNV | Missense_Mutation | novel | c.1114N>T | p.Ser372Cys | p.S372C | Q8TCT7 | protein_coding | deleterious(0.04) | benign(0.125) | TCGA-AA-3713-01 | Colorectum | colon adenocarcinoma | Male | >=65 | III/IV | Chemotherapy | 5-fluorouracil | PR |
| SPPL2B | SNV | Missense_Mutation | novel | c.267G>T | p.Gln89His | p.Q89H | Q8TCT7 | protein_coding | deleterious(0.04) | possibly_damaging(0.827) | TCGA-AA-A010-01 | Colorectum | colon adenocarcinoma | Female | <65 | I/II | Chemotherapy | folinic | CR |
| SPPL2B | SNV | Missense_Mutation | novel | c.1183A>G | p.Met395Val | p.M395V | Q8TCT7 | protein_coding | tolerated(0.24) | benign(0.338) | TCGA-AA-A022-01 | Colorectum | colon adenocarcinoma | Female | >=65 | I/II | Unknown | Unknown | SD |
| SPPL2B | SNV | Missense_Mutation | novel | c.139N>T | p.Leu47Phe | p.L47F | Q8TCT7 | protein_coding | tolerated(0.1) | benign(0.098) | TCGA-AD-A5EJ-01 | Colorectum | colon adenocarcinoma | Female | >=65 | I/II | Unknown | Unknown | SD |
| SPPL2B | SNV | Missense_Mutation | novel | c.995T>C | p.Phe332Ser | p.F332S | Q8TCT7 | protein_coding | deleterious(0.01) | probably_damaging(1) | TCGA-CA-6717-01 | Colorectum | colon adenocarcinoma | Male | <65 | I/II | Chemotherapy | oxaliplatin | CR |
| SPPL2B | SNV | Missense_Mutation | novel | c.341N>A | p.Gly114Glu | p.G114E | Q8TCT7 | protein_coding | deleterious(0) | probably_damaging(0.998) | TCGA-CK-4951-01 | Colorectum | colon adenocarcinoma | Female | >=65 | I/II | Unknown | Unknown | PD |
| SPPL2B | SNV | Missense_Mutation | novel | c.1444N>A | p.Leu482Met | p.L482M | Q8TCT7 | protein_coding | deleterious(0) | probably_damaging(0.993) | TCGA-F4-6856-01 | Colorectum | colon adenocarcinoma | Male | <65 | I/II | Ancillary | leucovorin | CR |
| SPPL2B | SNV | Missense_Mutation | novel | c.1565N>G | p.Gln522Arg | p.Q522R | Q8TCT7 | protein_coding | tolerated(0.17) | benign(0.342) | TCGA-G4-6304-01 | Colorectum | colon adenocarcinoma | Female | >=65 | I/II | Chemotherapy | fluorouracil | PD |
| Page: 1 2 3 4 5 6 |
Top |
Related drugs of malignant transformation related genes |
| Identification of chemicals and drugs interact with genes involved in malignant transfromation |
| (DGIdb 4.0) |
| Entrez ID | Symbol | Category | Interaction Types | Drug Claim Name | Drug Name | PMIDs |
| Page: 1 |

Copyright 2023-Present -The University of Texas Health Science Center at Houston |