
|
|||||
|
 | |
| |
| |
| |
| |
| |
|
Gene: SPPL2A |
Gene summary for SPPL2A |
| Gene information | Species | Human | Gene symbol | SPPL2A | Gene ID | 84888 |
| Gene name | signal peptide peptidase like 2A | |
| Gene Alias | IMP3 | |
| Cytomap | 15q21.2 | |
| Gene Type | protein-coding | GO ID | GO:0001959 | UniProtAcc | Q8TCT8 |
Top |
Malignant transformation analysis |
| Identification of the aberrant gene expression in precancerous and cancerous lesions by comparing the gene expression of stem-like cells in diseased tissues with normal stem cells |
| Entrez ID | Symbol | Replicates | Species | Organ | Tissue | Adj P-value | Log2FC | Malignancy |
| 84888 | SPPL2A | HTA11_347_2000001011 | Human | Colorectum | AD | 9.65e-19 | 7.54e-01 | -0.1954 |
| 84888 | SPPL2A | HTA11_411_2000001011 | Human | Colorectum | SER | 1.17e-06 | 8.56e-01 | -0.2602 |
| 84888 | SPPL2A | HTA11_99999971662_82457 | Human | Colorectum | MSS | 1.02e-05 | -3.54e-01 | 0.3859 |
| 84888 | SPPL2A | HTA11_99999974143_84620 | Human | Colorectum | MSS | 3.66e-05 | -3.84e-01 | 0.3005 |
| 84888 | SPPL2A | A001-C-207 | Human | Colorectum | FAP | 3.32e-02 | -2.61e-01 | 0.1278 |
| 84888 | SPPL2A | A015-C-203 | Human | Colorectum | FAP | 2.78e-21 | -3.01e-01 | -0.1294 |
| 84888 | SPPL2A | A015-C-204 | Human | Colorectum | FAP | 4.39e-03 | -1.73e-01 | -0.0228 |
| 84888 | SPPL2A | A014-C-040 | Human | Colorectum | FAP | 6.15e-03 | -4.31e-01 | -0.1184 |
| 84888 | SPPL2A | A002-C-201 | Human | Colorectum | FAP | 3.36e-08 | -2.35e-01 | 0.0324 |
| 84888 | SPPL2A | A002-C-203 | Human | Colorectum | FAP | 5.57e-06 | -1.78e-01 | 0.2786 |
| 84888 | SPPL2A | A001-C-119 | Human | Colorectum | FAP | 3.82e-02 | -2.35e-01 | -0.1557 |
| 84888 | SPPL2A | A001-C-108 | Human | Colorectum | FAP | 1.82e-14 | -2.54e-01 | -0.0272 |
| 84888 | SPPL2A | A002-C-205 | Human | Colorectum | FAP | 1.31e-15 | -3.95e-01 | -0.1236 |
| 84888 | SPPL2A | A001-C-104 | Human | Colorectum | FAP | 1.16e-06 | -2.84e-01 | 0.0184 |
| 84888 | SPPL2A | A015-C-005 | Human | Colorectum | FAP | 2.60e-03 | -2.88e-01 | -0.0336 |
| 84888 | SPPL2A | A015-C-006 | Human | Colorectum | FAP | 6.12e-13 | -4.92e-01 | -0.0994 |
| 84888 | SPPL2A | A015-C-106 | Human | Colorectum | FAP | 8.04e-10 | -2.44e-01 | -0.0511 |
| 84888 | SPPL2A | A002-C-114 | Human | Colorectum | FAP | 1.18e-08 | -2.62e-01 | -0.1561 |
| 84888 | SPPL2A | A015-C-104 | Human | Colorectum | FAP | 9.79e-23 | -3.00e-01 | -0.1899 |
| 84888 | SPPL2A | A001-C-014 | Human | Colorectum | FAP | 1.36e-12 | -2.89e-01 | 0.0135 |
| Page: 1 2 3 4 5 6 7 8 |
| Tissue | Expression Dynamics | Abbreviation |
| Colorectum (GSE201348) |  | FAP: Familial adenomatous polyposis |
| CRC: Colorectal cancer | ||
| Colorectum (HTA11) |  | AD: Adenomas |
| SER: Sessile serrated lesions | ||
| MSI-H: Microsatellite-high colorectal cancer | ||
| MSS: Microsatellite stable colorectal cancer | ||
| Esophagus | 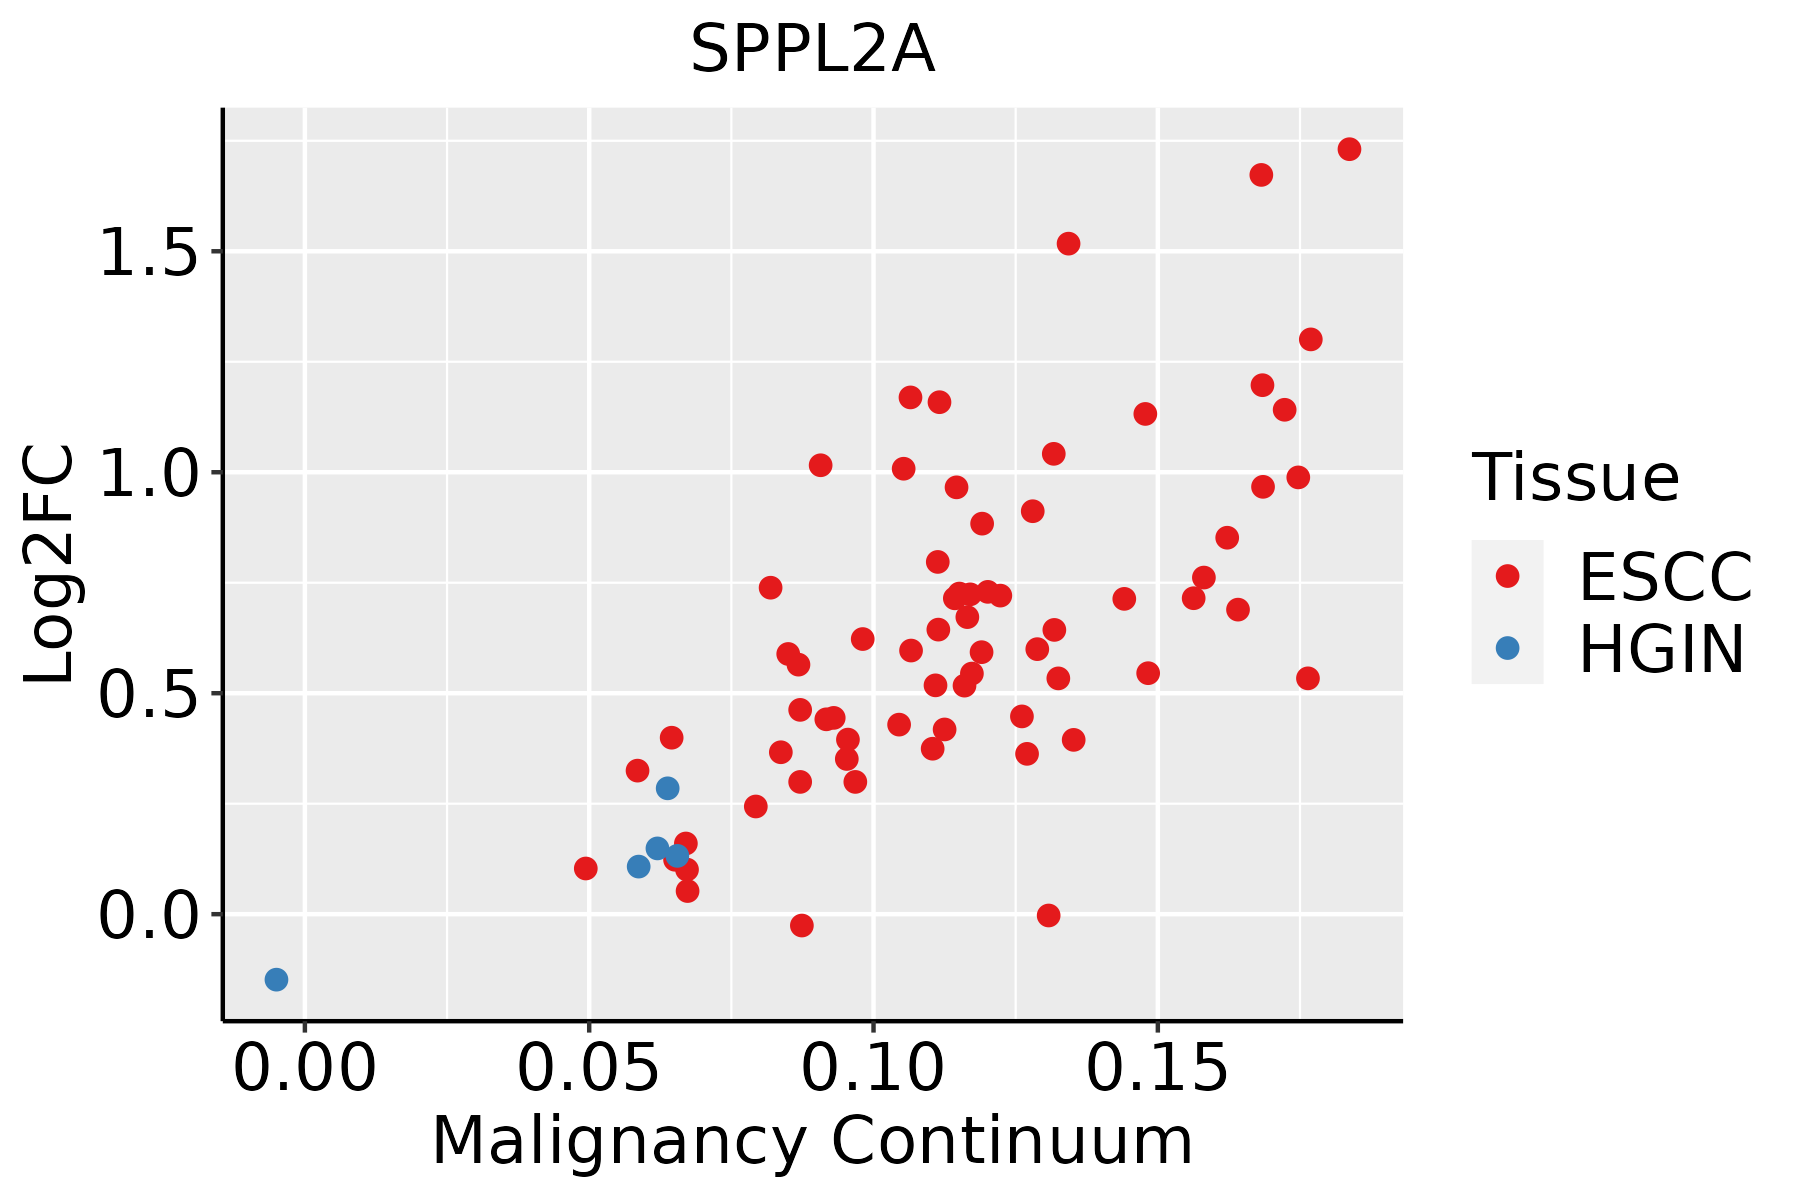 | ESCC: Esophageal squamous cell carcinoma |
| HGIN: High-grade intraepithelial neoplasias | ||
| LGIN: Low-grade intraepithelial neoplasias | ||
| Liver | 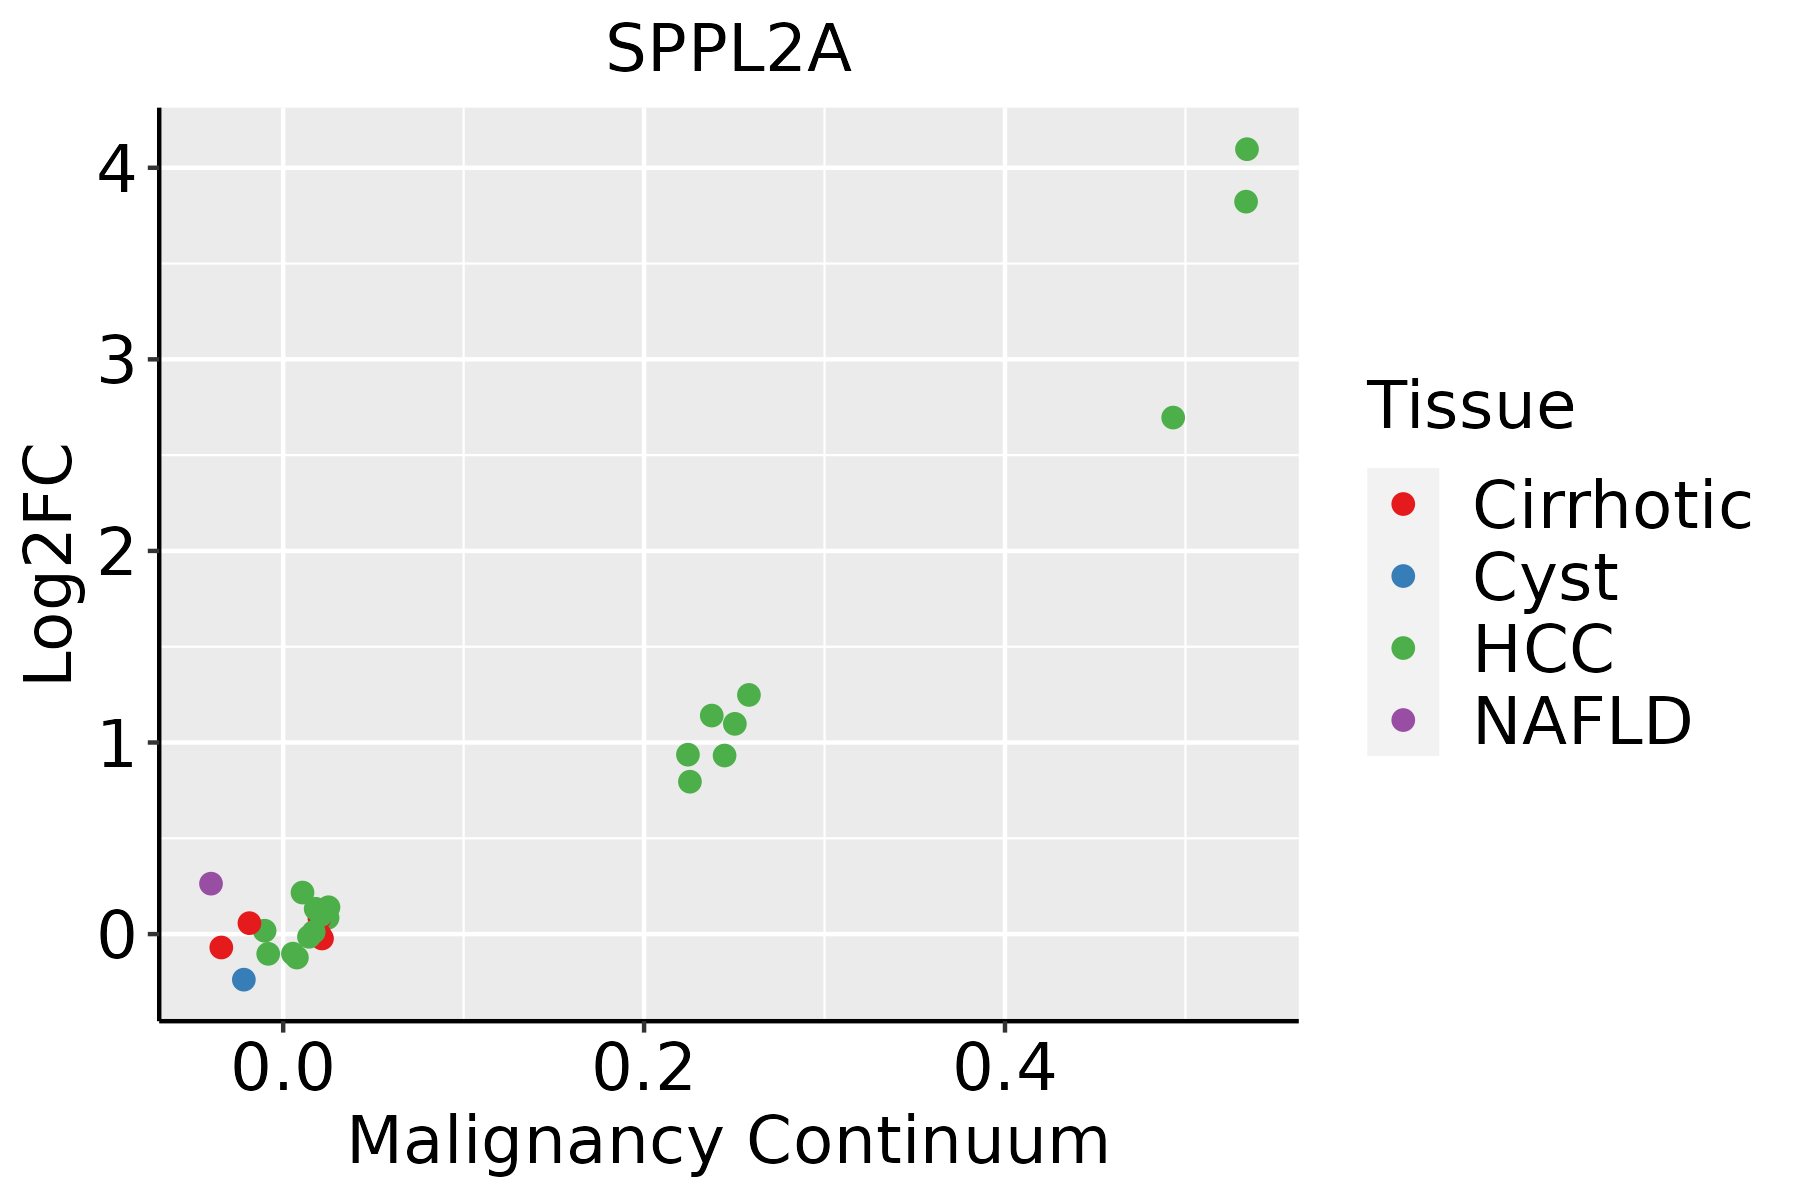 | HCC: Hepatocellular carcinoma |
| NAFLD: Non-alcoholic fatty liver disease | ||
| Oral Cavity | 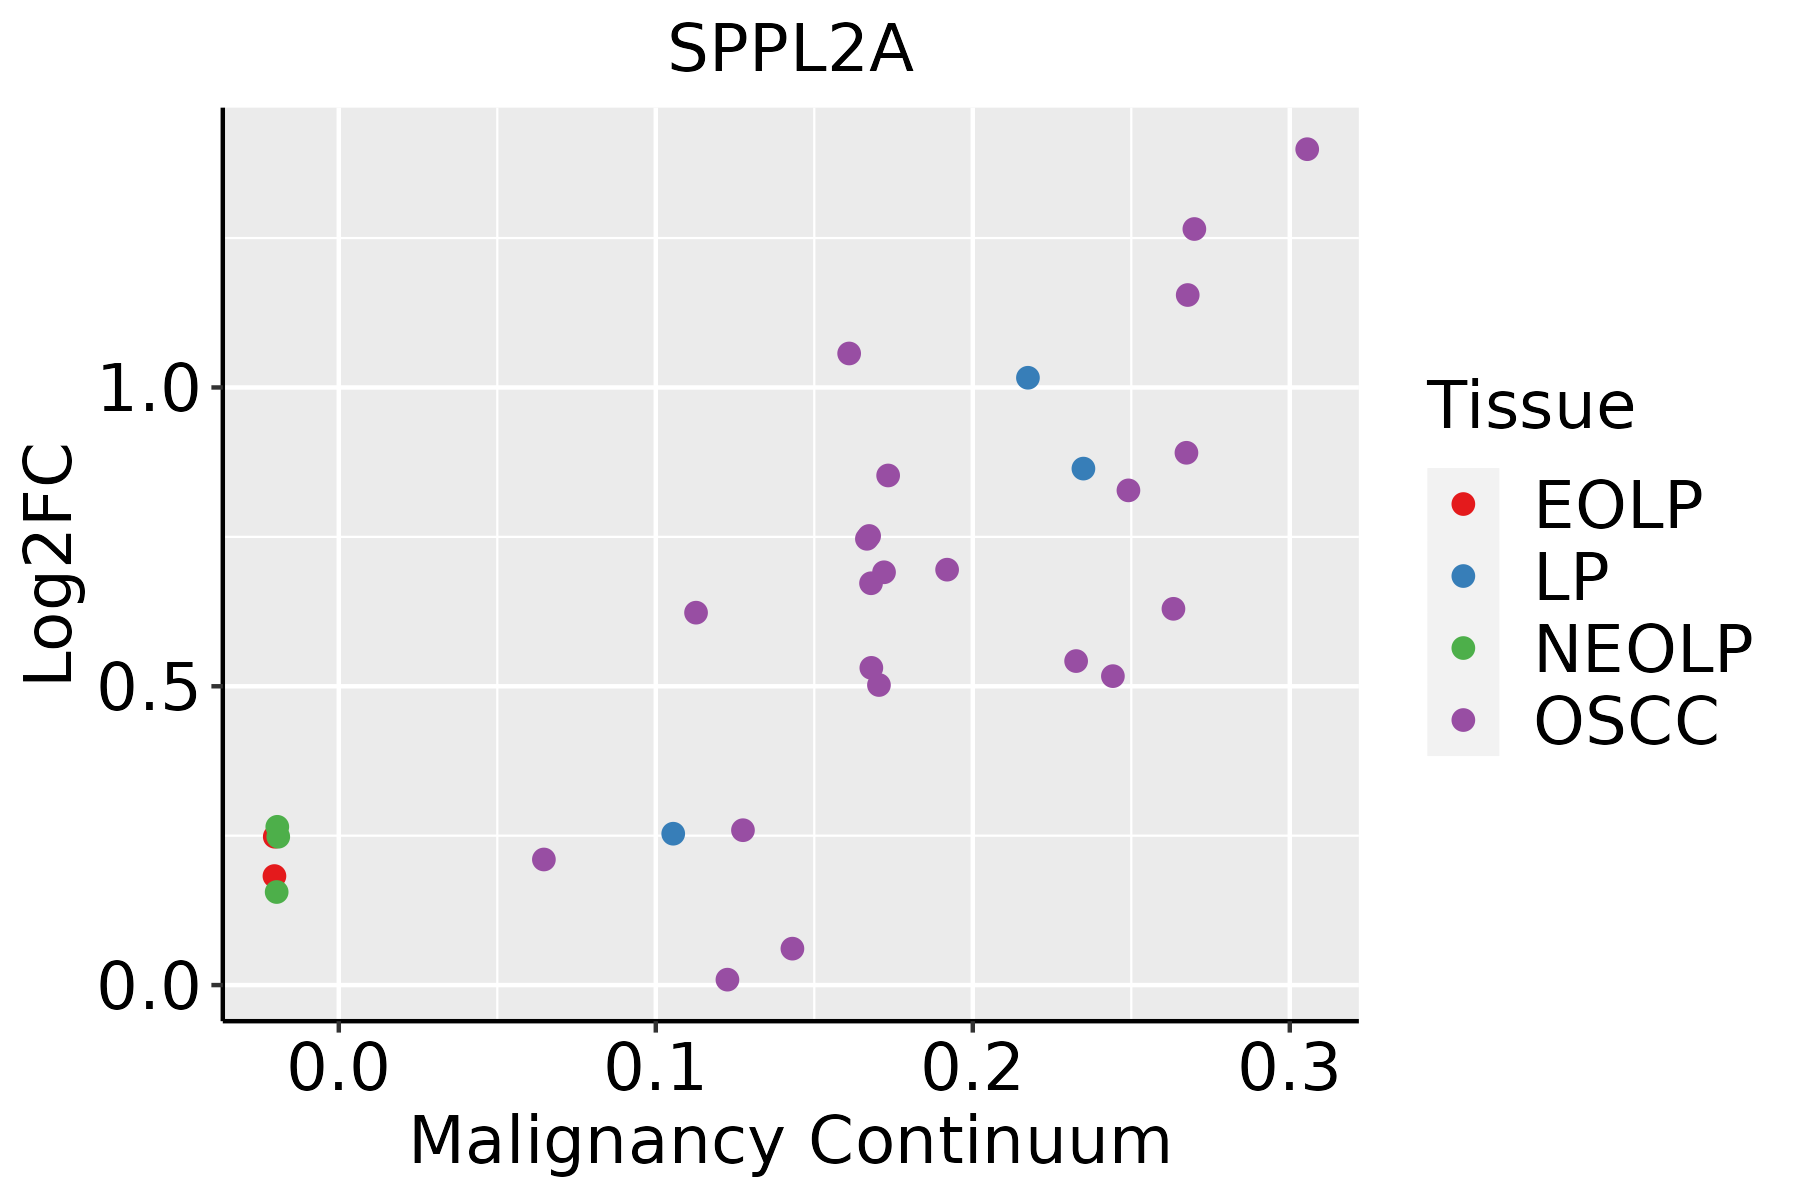 | EOLP: Erosive Oral lichen planus |
| LP: leukoplakia | ||
| NEOLP: Non-erosive oral lichen planus | ||
| OSCC: Oral squamous cell carcinoma | ||
| Skin | 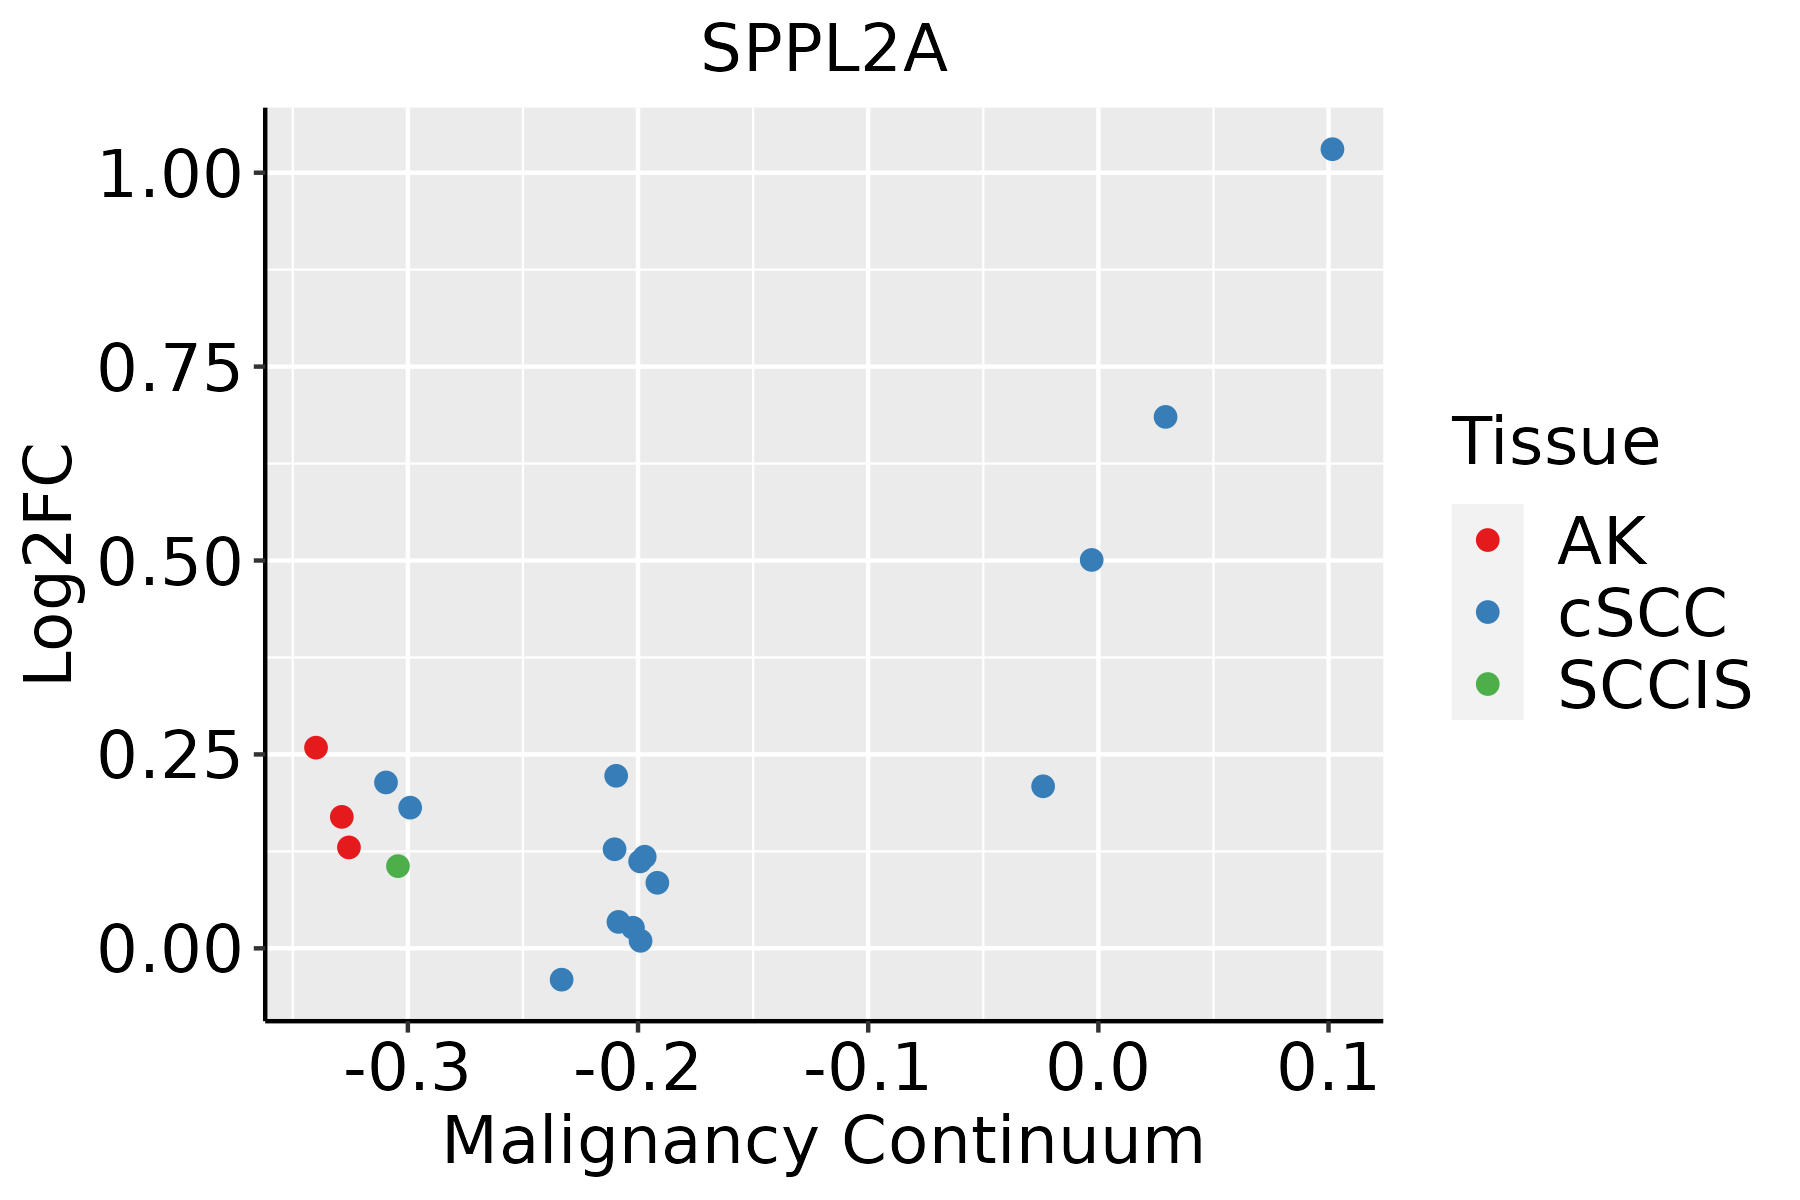 | AK: Actinic keratosis |
| cSCC: Cutaneous squamous cell carcinoma | ||
| SCCIS:squamous cell carcinoma in situ | ||
| Thyroid |  | ATC: Anaplastic thyroid cancer |
| HT: Hashimoto's thyroiditis | ||
| PTC: Papillary thyroid cancer |
| ∗log2FC in expression of this searched gene in stem-like cells from each diseased tissue sample relative to stem-like cells in normal samples in each tissue plotted against the malignancy continuum. Samples are colored based on if they are from different disease stage. |
Top |
Malignant transformation related pathway analysis |
| Find out the enriched GO biological processes and KEGG pathways involved in transition from healthy to precancer to cancer |
| Tissue | Disease Stage | Enriched GO biological Processes |
| Colorectum | AD |  |
| Colorectum | SER |  |
| Colorectum | MSS |  |
| Colorectum | MSI-H |  |
| Colorectum | FAP |  |
| ∗Top 15 enriched GO BP terms are showed in the bar plot of each disease state in each tissue. Each row represents a significant GO biological process which is colored according to the -log10(p.adjust). |
| Page: 1 2 3 4 5 6 7 8 9 |
| GO ID | Tissue | Disease Stage | Description | Gene Ratio | Bg Ratio | pvalue | p.adjust | Count |
| GO:0033619 | Colorectum | AD | membrane protein proteolysis | 21/3918 | 57/18723 | 4.16e-03 | 2.88e-02 | 21 |
| GO:00336191 | Colorectum | MSS | membrane protein proteolysis | 20/3467 | 57/18723 | 2.23e-03 | 1.84e-02 | 20 |
| GO:0006509 | Colorectum | MSS | membrane protein ectodomain proteolysis | 15/3467 | 43/18723 | 8.06e-03 | 4.91e-02 | 15 |
| GO:00607595 | Esophagus | ESCC | regulation of response to cytokine stimulus | 103/8552 | 162/18723 | 3.14e-06 | 3.53e-05 | 103 |
| GO:003320914 | Esophagus | ESCC | tumor necrosis factor-mediated signaling pathway | 67/8552 | 99/18723 | 7.87e-06 | 7.72e-05 | 67 |
| GO:00019595 | Esophagus | ESCC | regulation of cytokine-mediated signaling pathway | 95/8552 | 150/18723 | 9.48e-06 | 9.04e-05 | 95 |
| GO:003461220 | Esophagus | ESCC | response to tumor necrosis factor | 149/8552 | 253/18723 | 1.47e-05 | 1.33e-04 | 149 |
| GO:007135620 | Esophagus | ESCC | cellular response to tumor necrosis factor | 132/8552 | 229/18723 | 1.69e-04 | 1.11e-03 | 132 |
| GO:00065095 | Esophagus | ESCC | membrane protein ectodomain proteolysis | 31/8552 | 43/18723 | 4.04e-04 | 2.30e-03 | 31 |
| GO:00336195 | Esophagus | ESCC | membrane protein proteolysis | 39/8552 | 57/18723 | 4.34e-04 | 2.44e-03 | 39 |
| GO:00108033 | Esophagus | ESCC | regulation of tumor necrosis factor-mediated signaling pathway | 31/8552 | 47/18723 | 4.01e-03 | 1.62e-02 | 31 |
| GO:00336192 | Liver | Cirrhotic | membrane protein proteolysis | 31/4634 | 57/18723 | 1.55e-06 | 3.02e-05 | 31 |
| GO:00065092 | Liver | Cirrhotic | membrane protein ectodomain proteolysis | 24/4634 | 43/18723 | 1.30e-05 | 1.82e-04 | 24 |
| GO:00346126 | Liver | Cirrhotic | response to tumor necrosis factor | 89/4634 | 253/18723 | 1.24e-04 | 1.22e-03 | 89 |
| GO:00713566 | Liver | Cirrhotic | cellular response to tumor necrosis factor | 79/4634 | 229/18723 | 5.68e-04 | 4.45e-03 | 79 |
| GO:003461211 | Liver | HCC | response to tumor necrosis factor | 132/7958 | 253/18723 | 1.14e-03 | 6.48e-03 | 132 |
| GO:00065091 | Liver | HCC | membrane protein ectodomain proteolysis | 28/7958 | 43/18723 | 2.30e-03 | 1.14e-02 | 28 |
| GO:003361911 | Liver | HCC | membrane protein proteolysis | 35/7958 | 57/18723 | 3.08e-03 | 1.43e-02 | 35 |
| GO:007135611 | Liver | HCC | cellular response to tumor necrosis factor | 115/7958 | 229/18723 | 1.08e-02 | 3.99e-02 | 115 |
| GO:003461218 | Oral cavity | OSCC | response to tumor necrosis factor | 143/7305 | 253/18723 | 1.09e-08 | 2.23e-07 | 143 |
| Page: 1 2 3 4 |
| Pathway ID | Tissue | Disease Stage | Description | Gene Ratio | Bg Ratio | pvalue | p.adjust | qvalue | Count |
| Page: 1 |
Top |
Cell-cell communication analysis |
| Identification of potential cell-cell interactions between two cell types and their ligand-receptor pairs for different disease states |
| Ligand | Receptor | LRpair | Pathway | Tissue | Disease Stage |
| Page: 1 |
Top |
Single-cell gene regulatory network inference analysis |
| Find out the significant the regulons (TFs) and the target genes of each regulon across cell types for different disease states |
| TF | Cell Type | Tissue | Disease Stage | Target Gene | RSS | Regulon Activity |
| ∗The dot plots of a searched regulon are shown for all cell subpopulations in each disease state of each tissue based on the regulon specific score inferred using pySCENIC and by calculating the average expression. |
| Page: 1 |
Top |
Somatic mutation of malignant transformation related genes |
| Annotation of somatic variants for genes involved in malignant transformation |
| Hugo Symbol | Variant Class | Variant Classification | dbSNP RS | HGVSc | HGVSp | HGVSp Short | SWISSPROT | BIOTYPE | SIFT | PolyPhen | Tumor Sample Barcode | Tissue | Histology | Sex | Age | Stage | Therapy Types | Drugs | Outcome |
| SPPL2A | SNV | Missense_Mutation | novel | c.1204C>A | p.Leu402Ile | p.L402I | Q8TCT8 | protein_coding | tolerated(0.39) | benign(0.119) | TCGA-A2-A25A-01 | Breast | breast invasive carcinoma | Female | <65 | I/II | Unspecific | Cytoxan | SD |
| SPPL2A | SNV | Missense_Mutation | c.972C>G | p.Phe324Leu | p.F324L | Q8TCT8 | protein_coding | deleterious(0) | possibly_damaging(0.856) | TCGA-A8-A092-01 | Breast | breast invasive carcinoma | Female | <65 | III/IV | Chemotherapy | paclitaxel | CR | |
| SPPL2A | SNV | Missense_Mutation | c.952N>A | p.Asp318Asn | p.D318N | Q8TCT8 | protein_coding | deleterious(0.05) | probably_damaging(0.968) | TCGA-BH-A208-01 | Breast | breast invasive carcinoma | Female | <65 | I/II | Unknown | Unknown | SD | |
| SPPL2A | SNV | Missense_Mutation | rs768668639 | c.920N>A | p.Arg307Gln | p.R307Q | Q8TCT8 | protein_coding | deleterious(0) | probably_damaging(0.924) | TCGA-IR-A3LA-01 | Cervix | cervical & endocervical cancer | Female | <65 | I/II | Chemotherapy | cisplatin | CR |
| SPPL2A | SNV | Missense_Mutation | c.331N>A | p.Ala111Thr | p.A111T | Q8TCT8 | protein_coding | tolerated(0.08) | benign(0.014) | TCGA-A6-5665-01 | Colorectum | colon adenocarcinoma | Female | >=65 | I/II | Unknown | Unknown | PD | |
| SPPL2A | SNV | Missense_Mutation | rs774432755 | c.1331N>G | p.Tyr444Cys | p.Y444C | Q8TCT8 | protein_coding | deleterious(0) | probably_damaging(1) | TCGA-AA-3710-01 | Colorectum | colon adenocarcinoma | Female | >=65 | I/II | Unknown | Unknown | SD |
| SPPL2A | SNV | Missense_Mutation | c.630N>C | p.Lys210Asn | p.K210N | Q8TCT8 | protein_coding | deleterious(0.04) | benign(0.388) | TCGA-AA-A00N-01 | Colorectum | colon adenocarcinoma | Male | >=65 | I/II | Unknown | Unknown | PD | |
| SPPL2A | SNV | Missense_Mutation | c.955N>G | p.Ile319Val | p.I319V | Q8TCT8 | protein_coding | tolerated(0.36) | benign(0.009) | TCGA-AA-A01R-01 | Colorectum | colon adenocarcinoma | Male | <65 | III/IV | Chemotherapy | 5-fluorouracil | PD | |
| SPPL2A | SNV | Missense_Mutation | rs768668639 | c.920N>A | p.Arg307Gln | p.R307Q | Q8TCT8 | protein_coding | deleterious(0) | probably_damaging(0.924) | TCGA-CA-6718-01 | Colorectum | colon adenocarcinoma | Male | <65 | I/II | Unknown | Unknown | PD |
| SPPL2A | SNV | Missense_Mutation | c.664A>G | p.Thr222Ala | p.T222A | Q8TCT8 | protein_coding | tolerated(0.11) | probably_damaging(0.951) | TCGA-CM-4743-01 | Colorectum | colon adenocarcinoma | Male | >=65 | I/II | Chemotherapy | capecitabine | SD |
| Page: 1 2 3 4 5 |
Top |
Related drugs of malignant transformation related genes |
| Identification of chemicals and drugs interact with genes involved in malignant transfromation |
| (DGIdb 4.0) |
| Entrez ID | Symbol | Category | Interaction Types | Drug Claim Name | Drug Name | PMIDs |
| Page: 1 |

Copyright 2023-Present -The University of Texas Health Science Center at Houston |