
|
|||||
|
 | |
| |
| |
| |
| |
| |
|
Gene: SPP1 |
Gene summary for SPP1 |
| Gene information | Species | Human | Gene symbol | SPP1 | Gene ID | 6696 |
| Gene name | secreted phosphoprotein 1 | |
| Gene Alias | BNSP | |
| Cytomap | 4q22.1 | |
| Gene Type | protein-coding | GO ID | GO:0000003 | UniProtAcc | A0A024RDE6 |
Top |
Malignant transformation analysis |
| Identification of the aberrant gene expression in precancerous and cancerous lesions by comparing the gene expression of stem-like cells in diseased tissues with normal stem cells |
| Entrez ID | Symbol | Replicates | Species | Organ | Tissue | Adj P-value | Log2FC | Malignancy |
| 6696 | SPP1 | GSM4909282 | Human | Breast | IDC | 6.19e-04 | 1.62e-01 | -0.0288 |
| 6696 | SPP1 | GSM4909287 | Human | Breast | IDC | 8.64e-04 | 3.08e-01 | 0.2057 |
| 6696 | SPP1 | GSM4909295 | Human | Breast | IDC | 7.38e-07 | 3.81e-01 | 0.0898 |
| 6696 | SPP1 | GSM4909301 | Human | Breast | IDC | 2.23e-04 | 3.06e-01 | 0.1577 |
| 6696 | SPP1 | GSM4909302 | Human | Breast | IDC | 2.79e-10 | 4.04e-01 | 0.1545 |
| 6696 | SPP1 | GSM4909307 | Human | Breast | IDC | 1.96e-02 | 1.82e-01 | 0.1569 |
| 6696 | SPP1 | GSM4909309 | Human | Breast | IDC | 1.02e-10 | 4.58e-01 | 0.0483 |
| 6696 | SPP1 | M2 | Human | Breast | IDC | 4.05e-07 | 6.92e-01 | 0.21 |
| 6696 | SPP1 | NCCBC14 | Human | Breast | DCIS | 2.57e-15 | 7.69e-01 | 0.2021 |
| 6696 | SPP1 | NCCBC3 | Human | Breast | DCIS | 1.98e-20 | 7.61e-01 | 0.1198 |
| 6696 | SPP1 | NCCBC5 | Human | Breast | DCIS | 1.60e-04 | 3.89e-01 | 0.2046 |
| 6696 | SPP1 | P1 | Human | Breast | IDC | 1.10e-03 | 3.88e-01 | 0.1527 |
| 6696 | SPP1 | P2 | Human | Breast | IDC | 6.77e-16 | 7.61e-01 | 0.21 |
| 6696 | SPP1 | DCIS2 | Human | Breast | DCIS | 2.00e-07 | 2.40e-01 | 0.0085 |
| 6696 | SPP1 | AEH-subject1 | Human | Endometrium | AEH | 4.80e-05 | 3.95e-01 | -0.3059 |
| 6696 | SPP1 | AEH-subject3 | Human | Endometrium | AEH | 1.42e-49 | 9.94e-01 | -0.2576 |
| 6696 | SPP1 | EEC-subject1 | Human | Endometrium | EEC | 8.72e-06 | 3.25e-01 | -0.2682 |
| 6696 | SPP1 | EEC-subject2 | Human | Endometrium | EEC | 2.33e-10 | 3.95e-01 | -0.2607 |
| 6696 | SPP1 | GSM5276935 | Human | Endometrium | EEC | 4.45e-21 | 6.55e-01 | -0.123 |
| 6696 | SPP1 | GSM6177621_NYU_UCEC2_lib1_lib1 | Human | Endometrium | EEC | 1.45e-12 | 6.31e-01 | -0.1934 |
| Page: 1 2 3 4 5 |
| Tissue | Expression Dynamics | Abbreviation |
| Breast |  | IDC: Invasive ductal carcinoma |
| DCIS: Ductal carcinoma in situ | ||
| Precancer(BRCA1-mut): Precancerous lesion from BRCA1 mutation carriers | ||
| Endometrium | 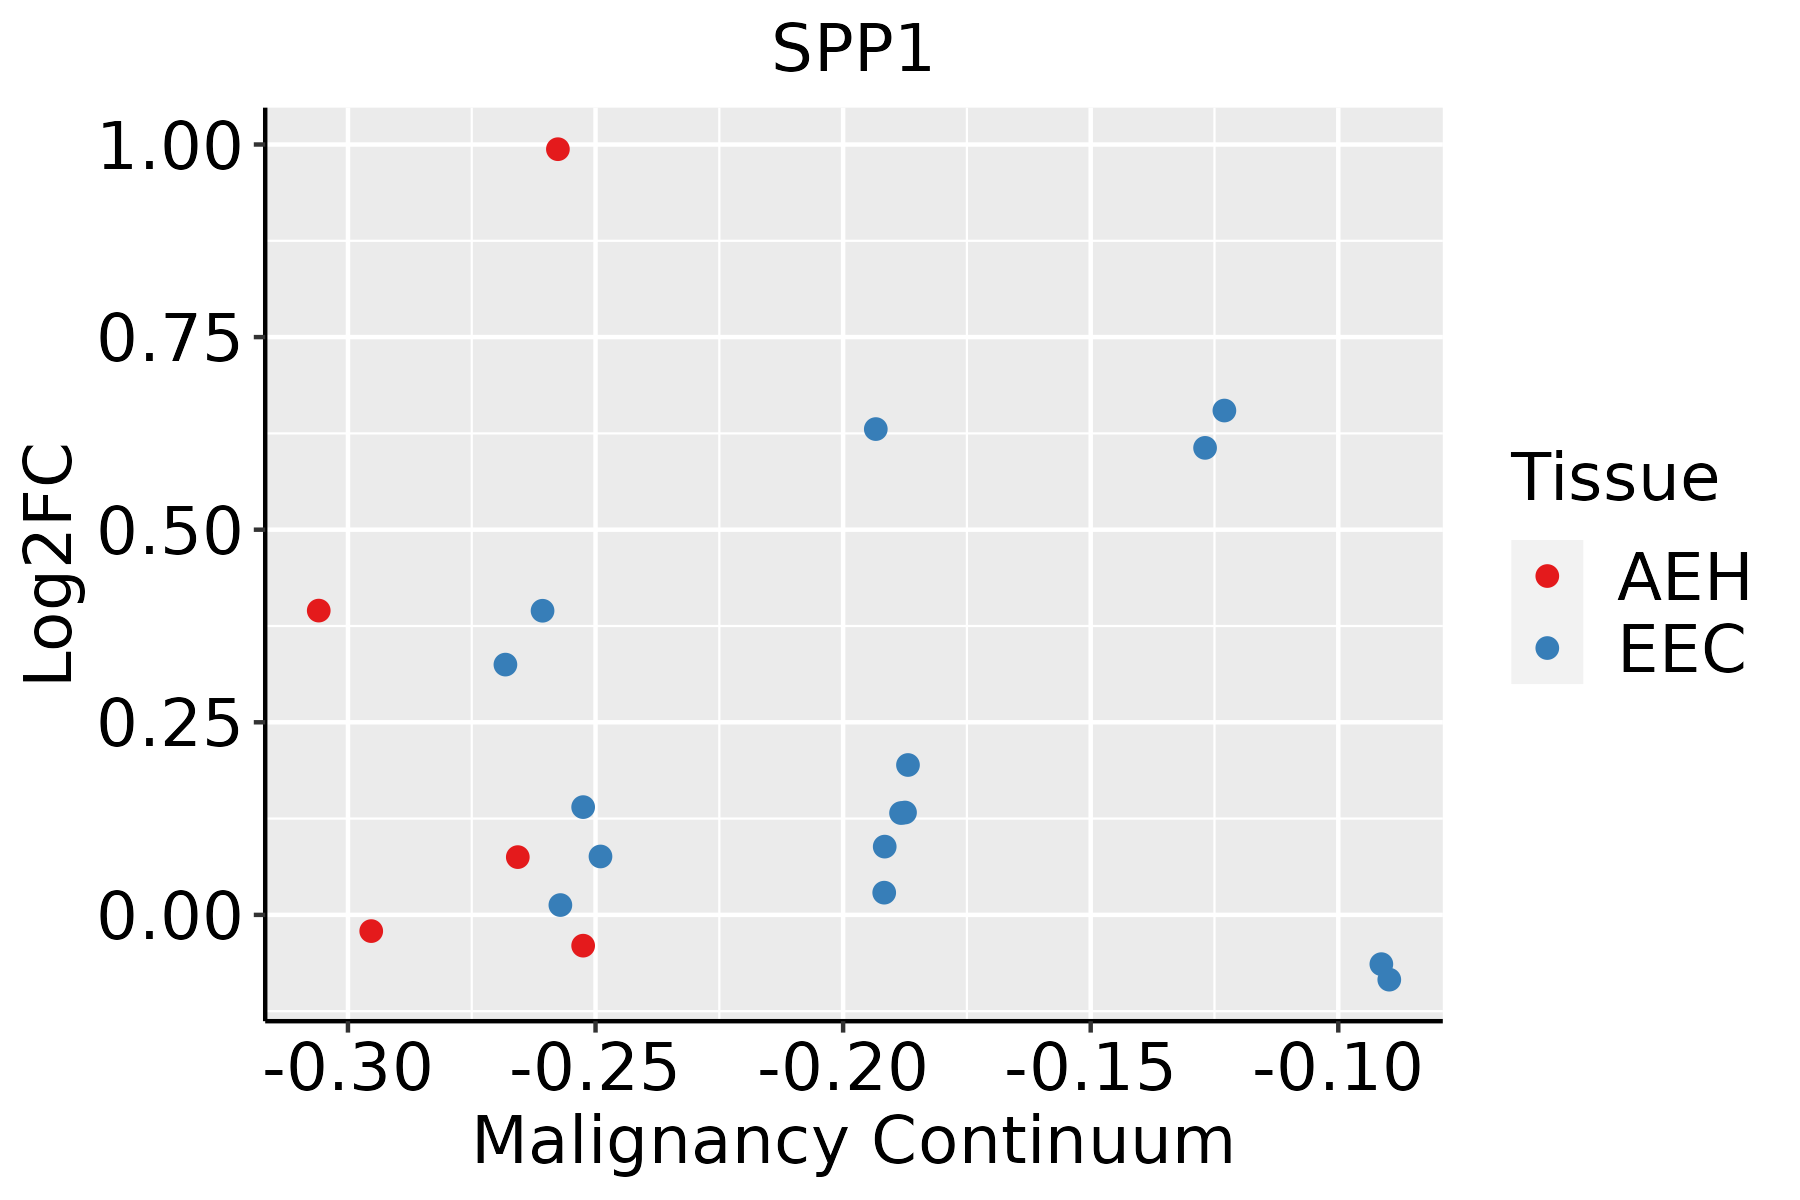 | AEH: Atypical endometrial hyperplasia |
| EEC: Endometrioid Cancer | ||
| Esophagus | 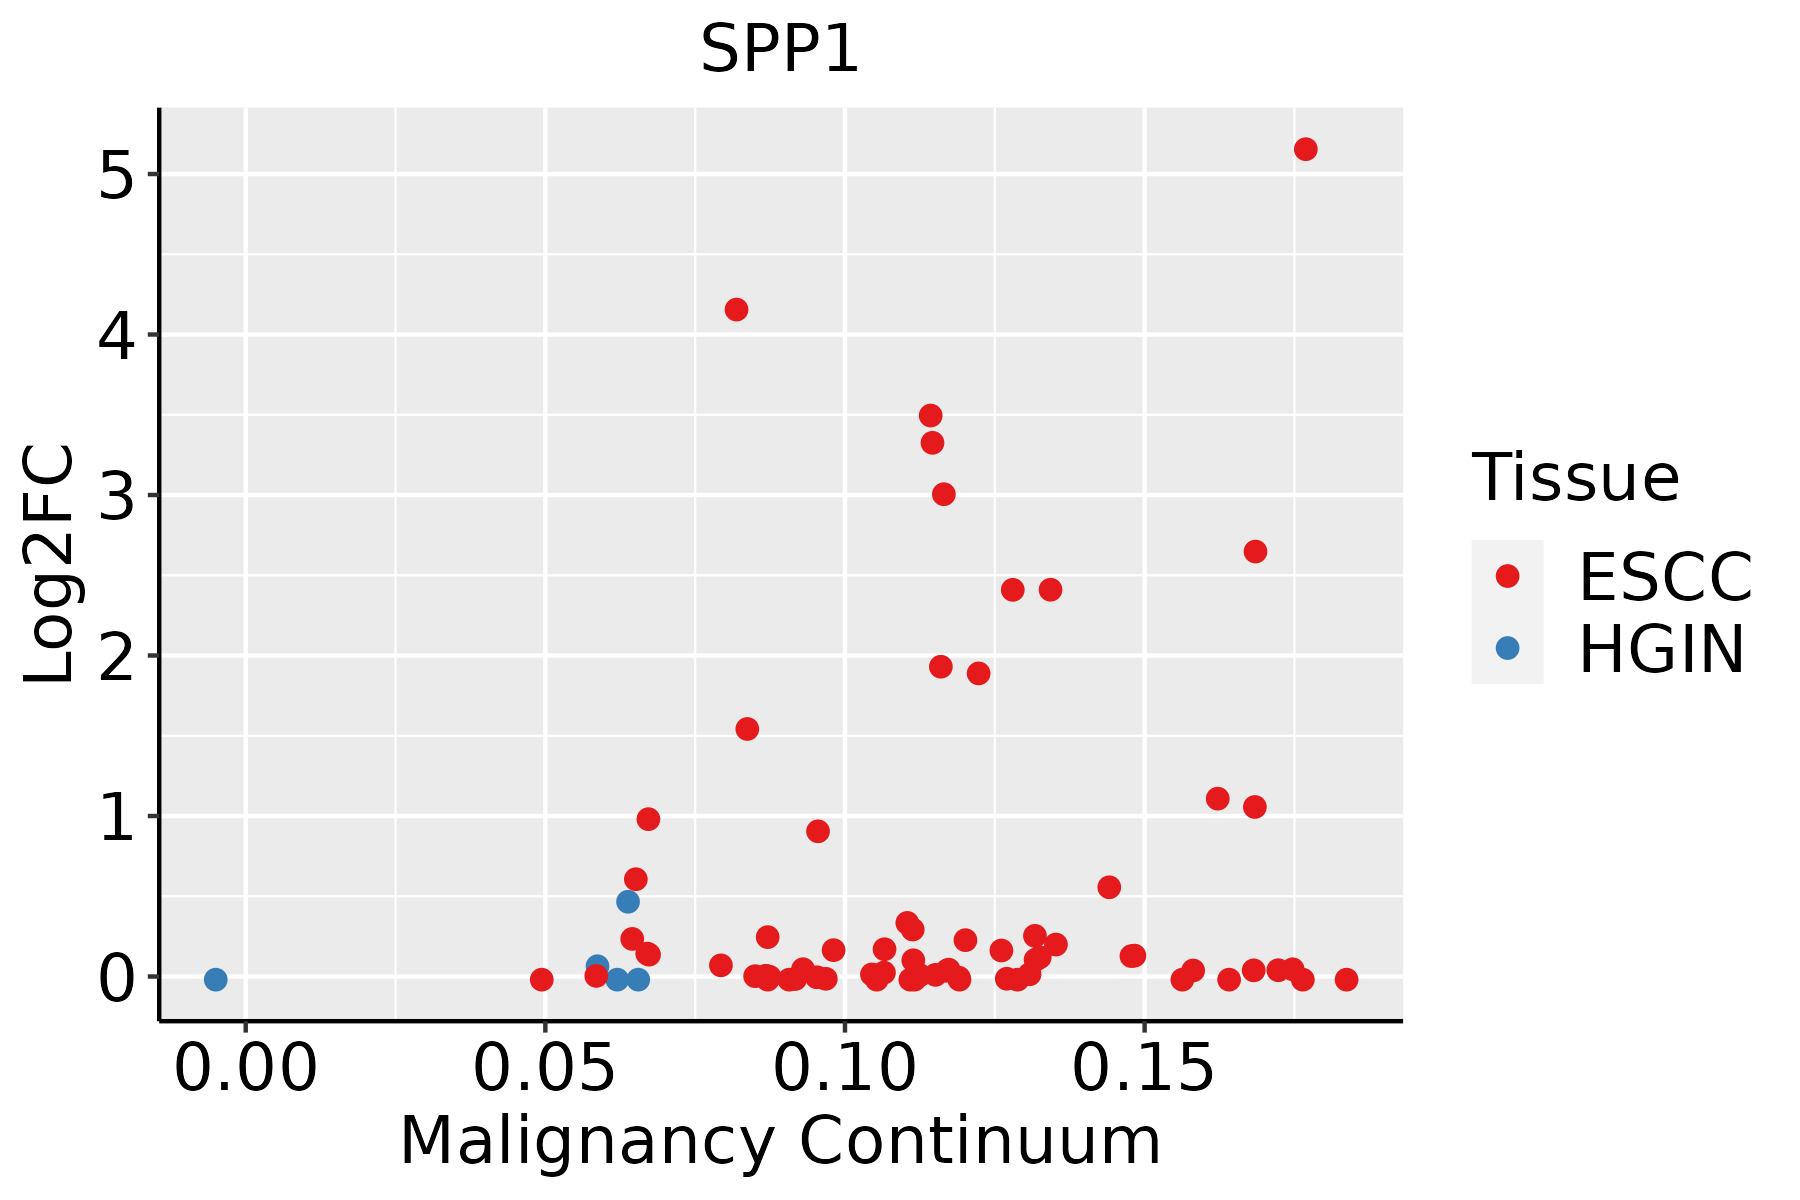 | ESCC: Esophageal squamous cell carcinoma |
| HGIN: High-grade intraepithelial neoplasias | ||
| LGIN: Low-grade intraepithelial neoplasias | ||
| Liver | 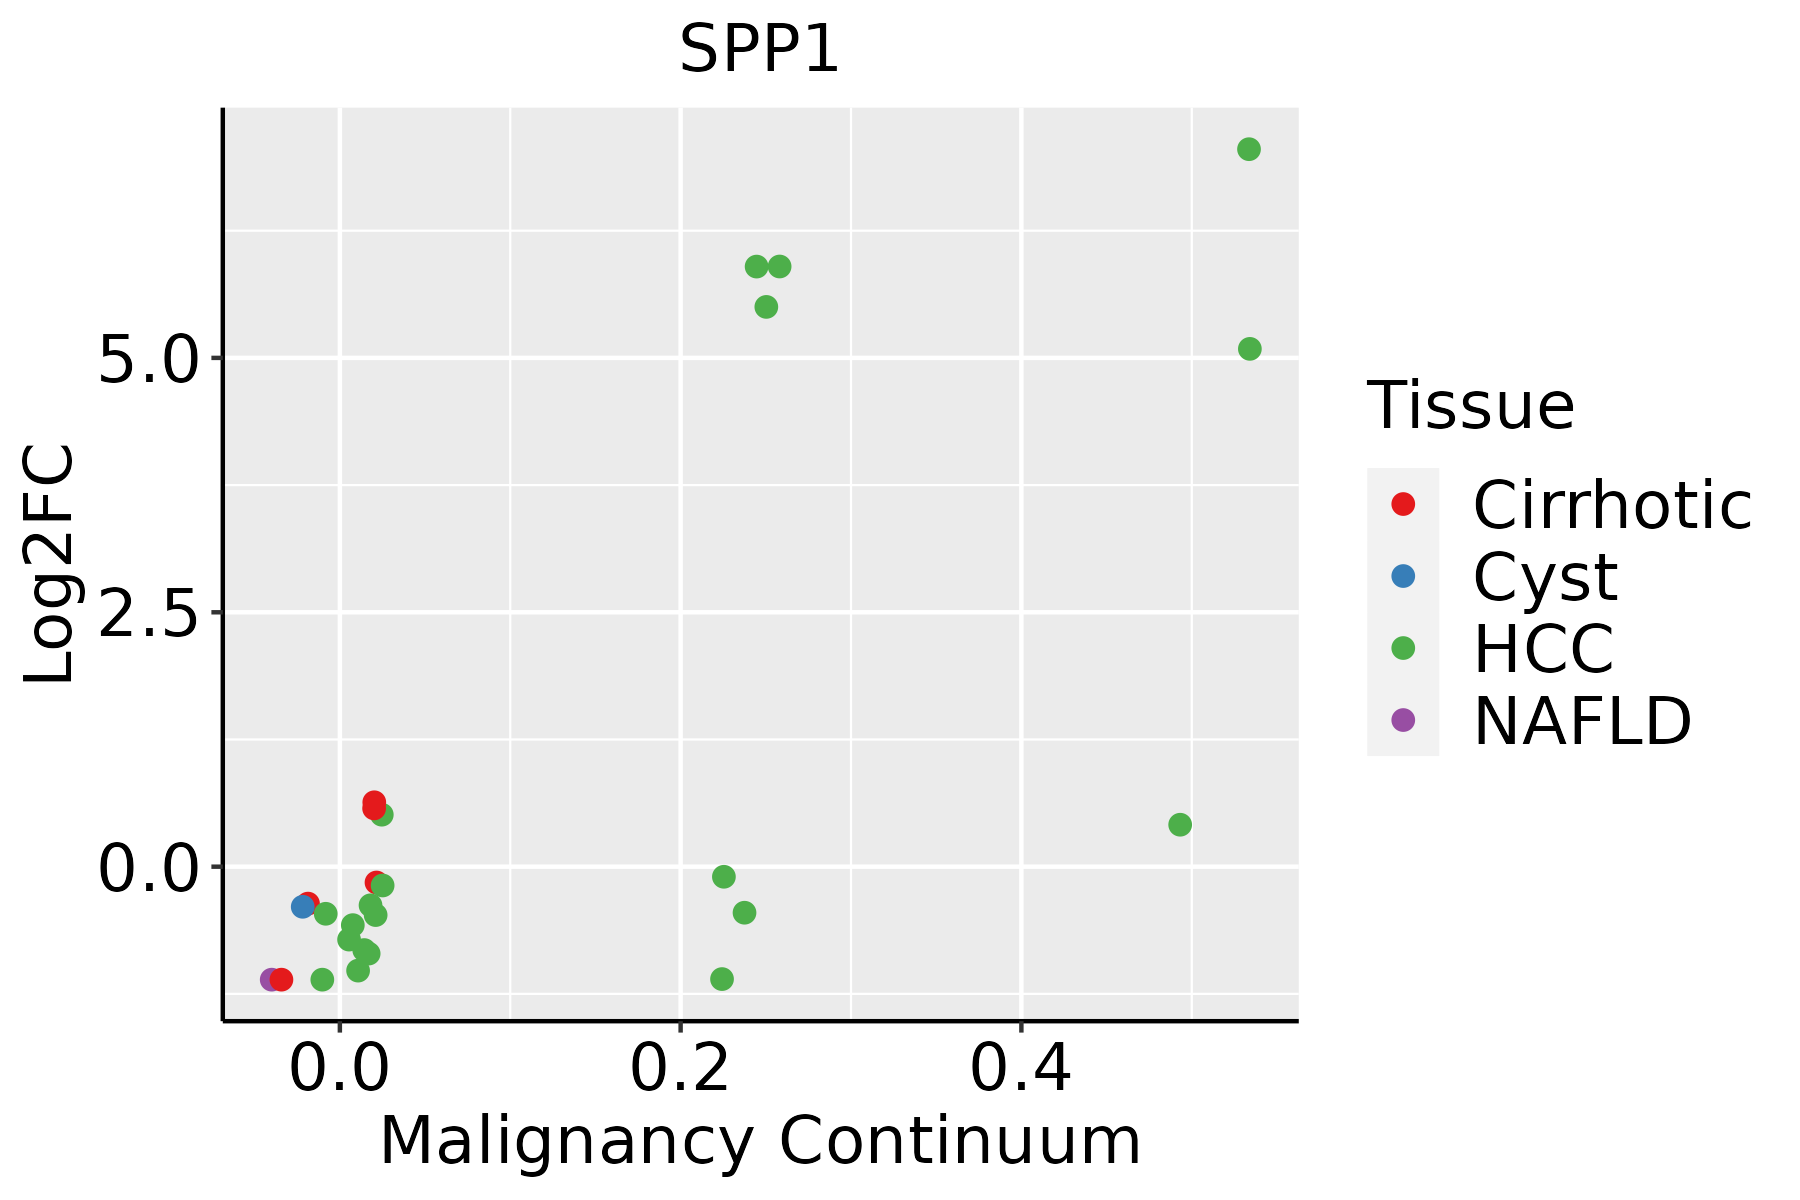 | HCC: Hepatocellular carcinoma |
| NAFLD: Non-alcoholic fatty liver disease | ||
| Lung |  | AAH: Atypical adenomatous hyperplasia |
| AIS: Adenocarcinoma in situ | ||
| IAC: Invasive lung adenocarcinoma | ||
| MIA: Minimally invasive adenocarcinoma | ||
| Oral Cavity |  | EOLP: Erosive Oral lichen planus |
| LP: leukoplakia | ||
| NEOLP: Non-erosive oral lichen planus | ||
| OSCC: Oral squamous cell carcinoma | ||
| Thyroid | 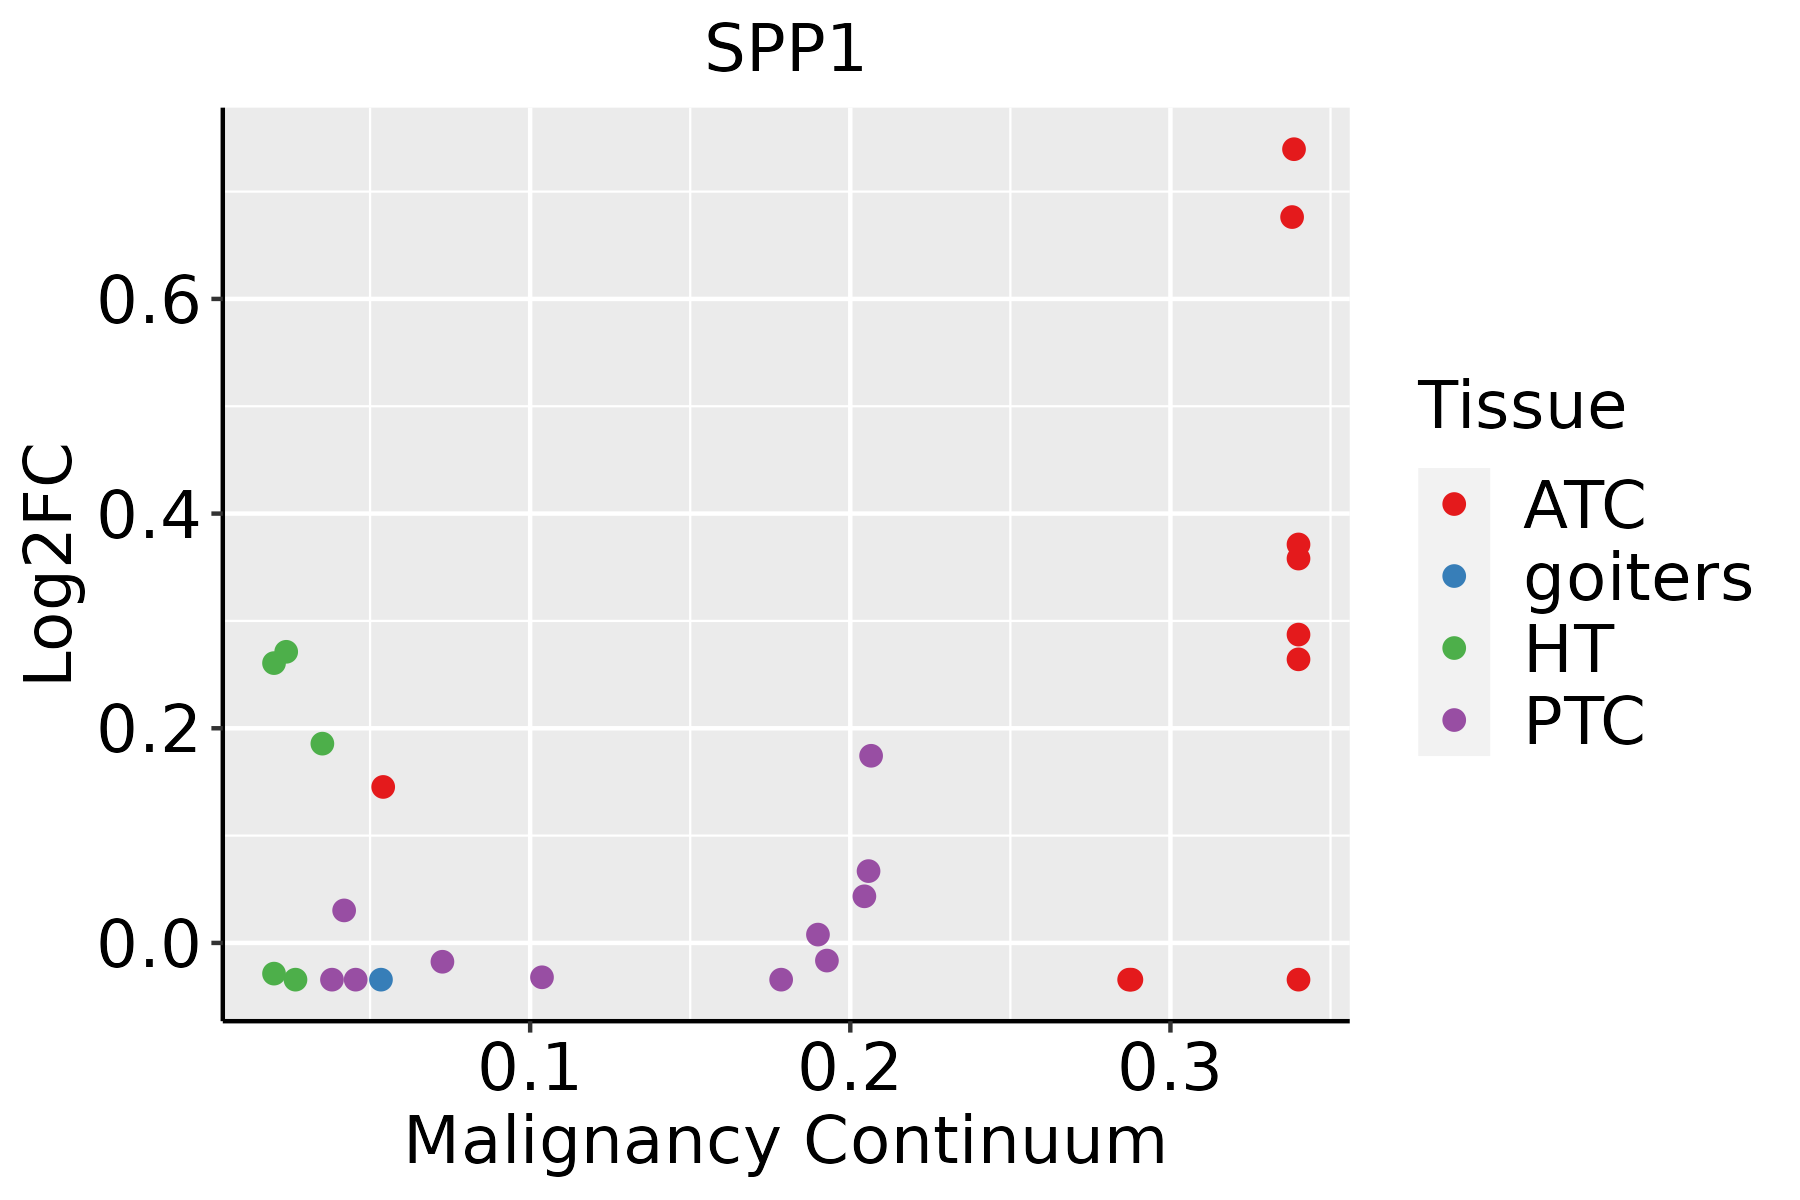 | ATC: Anaplastic thyroid cancer |
| HT: Hashimoto's thyroiditis | ||
| PTC: Papillary thyroid cancer |
| ∗log2FC in expression of this searched gene in stem-like cells from each diseased tissue sample relative to stem-like cells in normal samples in each tissue plotted against the malignancy continuum. Samples are colored based on if they are from different disease stage. |
Top |
Malignant transformation related pathway analysis |
| Find out the enriched GO biological processes and KEGG pathways involved in transition from healthy to precancer to cancer |
| Tissue | Disease Stage | Enriched GO biological Processes |
| Colorectum | AD |  |
| Colorectum | SER |  |
| Colorectum | MSS |  |
| Colorectum | MSI-H |  |
| Colorectum | FAP |  |
| ∗Top 15 enriched GO BP terms are showed in the bar plot of each disease state in each tissue. Each row represents a significant GO biological process which is colored according to the -log10(p.adjust). |
| Page: 1 2 3 4 5 6 7 8 9 |
| GO ID | Tissue | Disease Stage | Description | Gene Ratio | Bg Ratio | pvalue | p.adjust | Count |
| GO:004854514 | Breast | IDC | response to steroid hormone | 70/1434 | 339/18723 | 1.34e-14 | 4.23e-12 | 70 |
| GO:000756511 | Breast | IDC | female pregnancy | 39/1434 | 193/18723 | 1.81e-08 | 1.27e-06 | 39 |
| GO:00447061 | Breast | IDC | multi-multicellular organism process | 41/1434 | 220/18723 | 8.58e-08 | 5.19e-06 | 41 |
| GO:004860812 | Breast | IDC | reproductive structure development | 60/1434 | 424/18723 | 2.71e-06 | 1.03e-04 | 60 |
| GO:006145813 | Breast | IDC | reproductive system development | 60/1434 | 427/18723 | 3.41e-06 | 1.24e-04 | 60 |
| GO:190165414 | Breast | IDC | response to ketone | 33/1434 | 194/18723 | 1.17e-05 | 3.13e-04 | 33 |
| GO:00601352 | Breast | IDC | maternal process involved in female pregnancy | 16/1434 | 62/18723 | 1.20e-05 | 3.17e-04 | 16 |
| GO:003166714 | Breast | IDC | response to nutrient levels | 62/1434 | 474/18723 | 2.33e-05 | 5.57e-04 | 62 |
| GO:000756611 | Breast | IDC | embryo implantation | 14/1434 | 53/18723 | 3.14e-05 | 7.32e-04 | 14 |
| GO:000758412 | Breast | IDC | response to nutrient | 29/1434 | 174/18723 | 5.69e-05 | 1.20e-03 | 29 |
| GO:000164912 | Breast | IDC | osteoblast differentiation | 35/1434 | 229/18723 | 6.64e-05 | 1.35e-03 | 35 |
| GO:000189013 | Breast | IDC | placenta development | 25/1434 | 144/18723 | 9.19e-05 | 1.78e-03 | 25 |
| GO:003109912 | Breast | IDC | regeneration | 31/1434 | 198/18723 | 1.08e-04 | 2.03e-03 | 31 |
| GO:00018933 | Breast | IDC | maternal placenta development | 10/1434 | 35/18723 | 2.09e-04 | 3.41e-03 | 10 |
| GO:0046697 | Breast | IDC | decidualization | 8/1434 | 26/18723 | 5.19e-04 | 6.75e-03 | 8 |
| GO:00332732 | Breast | IDC | response to vitamin | 17/1434 | 93/18723 | 6.35e-04 | 7.94e-03 | 17 |
| GO:000150311 | Breast | IDC | ossification | 50/1434 | 408/18723 | 6.51e-04 | 8.04e-03 | 50 |
| GO:00335745 | Breast | IDC | response to testosterone | 10/1434 | 42/18723 | 1.03e-03 | 1.14e-02 | 10 |
| GO:001604913 | Breast | IDC | cell growth | 56/1434 | 482/18723 | 1.16e-03 | 1.26e-02 | 56 |
| GO:000155813 | Breast | IDC | regulation of cell growth | 49/1434 | 414/18723 | 1.55e-03 | 1.55e-02 | 49 |
| Page: 1 2 3 4 5 6 7 8 9 10 11 12 13 14 15 16 17 18 19 20 21 22 |
| Pathway ID | Tissue | Disease Stage | Description | Gene Ratio | Bg Ratio | pvalue | p.adjust | qvalue | Count |
| hsa045109 | Breast | IDC | Focal adhesion | 32/867 | 203/8465 | 8.60e-03 | 4.23e-02 | 3.17e-02 | 32 |
| hsa0451013 | Breast | IDC | Focal adhesion | 32/867 | 203/8465 | 8.60e-03 | 4.23e-02 | 3.17e-02 | 32 |
| hsa0451015 | Endometrium | AEH | Focal adhesion | 58/1197 | 203/8465 | 4.99e-08 | 7.37e-07 | 5.39e-07 | 58 |
| hsa0451016 | Endometrium | AEH | Focal adhesion | 58/1197 | 203/8465 | 4.99e-08 | 7.37e-07 | 5.39e-07 | 58 |
| hsa0451024 | Endometrium | EEC | Focal adhesion | 58/1237 | 203/8465 | 1.61e-07 | 2.30e-06 | 1.71e-06 | 58 |
| hsa0451034 | Endometrium | EEC | Focal adhesion | 58/1237 | 203/8465 | 1.61e-07 | 2.30e-06 | 1.71e-06 | 58 |
| hsa0516510 | Esophagus | ESCC | Human papillomavirus infection | 215/4205 | 331/8465 | 7.86e-09 | 7.12e-08 | 3.65e-08 | 215 |
| hsa0451020 | Esophagus | ESCC | Focal adhesion | 127/4205 | 203/8465 | 1.25e-04 | 4.99e-04 | 2.56e-04 | 127 |
| hsa041517 | Esophagus | ESCC | PI3K-Akt signaling pathway | 197/4205 | 354/8465 | 1.24e-02 | 2.83e-02 | 1.45e-02 | 197 |
| hsa0516515 | Esophagus | ESCC | Human papillomavirus infection | 215/4205 | 331/8465 | 7.86e-09 | 7.12e-08 | 3.65e-08 | 215 |
| hsa04510111 | Esophagus | ESCC | Focal adhesion | 127/4205 | 203/8465 | 1.25e-04 | 4.99e-04 | 2.56e-04 | 127 |
| hsa0415114 | Esophagus | ESCC | PI3K-Akt signaling pathway | 197/4205 | 354/8465 | 1.24e-02 | 2.83e-02 | 1.45e-02 | 197 |
| hsa0451021 | Liver | Cirrhotic | Focal adhesion | 93/2530 | 203/8465 | 9.27e-07 | 1.10e-05 | 6.80e-06 | 93 |
| hsa05165 | Liver | Cirrhotic | Human papillomavirus infection | 124/2530 | 331/8465 | 1.55e-03 | 7.83e-03 | 4.83e-03 | 124 |
| hsa0451031 | Liver | Cirrhotic | Focal adhesion | 93/2530 | 203/8465 | 9.27e-07 | 1.10e-05 | 6.80e-06 | 93 |
| hsa051651 | Liver | Cirrhotic | Human papillomavirus infection | 124/2530 | 331/8465 | 1.55e-03 | 7.83e-03 | 4.83e-03 | 124 |
| hsa0451041 | Liver | HCC | Focal adhesion | 125/4020 | 203/8465 | 3.12e-05 | 1.88e-04 | 1.04e-04 | 125 |
| hsa051652 | Liver | HCC | Human papillomavirus infection | 188/4020 | 331/8465 | 3.34e-04 | 1.49e-03 | 8.29e-04 | 188 |
| hsa0451051 | Liver | HCC | Focal adhesion | 125/4020 | 203/8465 | 3.12e-05 | 1.88e-04 | 1.04e-04 | 125 |
| hsa051653 | Liver | HCC | Human papillomavirus infection | 188/4020 | 331/8465 | 3.34e-04 | 1.49e-03 | 8.29e-04 | 188 |
| Page: 1 2 |
Top |
Cell-cell communication analysis |
| Identification of potential cell-cell interactions between two cell types and their ligand-receptor pairs for different disease states |
| Ligand | Receptor | LRpair | Pathway | Tissue | Disease Stage |
| SPP1 | CD44 | SPP1_CD44 | SPP1 | Breast | DCIS |
| SPP1 | ITGAV_ITGB1 | SPP1_ITGAV_ITGB1 | SPP1 | Breast | DCIS |
| SPP1 | ITGAV_ITGB5 | SPP1_ITGAV_ITGB5 | SPP1 | Breast | DCIS |
| SPP1 | ITGA4_ITGB1 | SPP1_ITGA4_ITGB1 | SPP1 | Breast | DCIS |
| SPP1 | ITGA5_ITGB1 | SPP1_ITGA5_ITGB1 | SPP1 | Breast | DCIS |
| SPP1 | CD44 | SPP1_CD44 | SPP1 | Cervix | CC |
| SPP1 | ITGAV_ITGB1 | SPP1_ITGAV_ITGB1 | SPP1 | Cervix | CC |
| SPP1 | ITGAV_ITGB5 | SPP1_ITGAV_ITGB5 | SPP1 | Cervix | CC |
| SPP1 | ITGAV_ITGB6 | SPP1_ITGAV_ITGB6 | SPP1 | Cervix | CC |
| SPP1 | ITGA4_ITGB1 | SPP1_ITGA4_ITGB1 | SPP1 | Cervix | CC |
| SPP1 | ITGA9_ITGB1 | SPP1_ITGA9_ITGB1 | SPP1 | Cervix | CC |
| SPP1 | ITGA8_ITGB1 | SPP1_ITGA8_ITGB1 | SPP1 | Cervix | CC |
| SPP1 | ITGA5_ITGB1 | SPP1_ITGA5_ITGB1 | SPP1 | Cervix | CC |
| SPP1 | CD44 | SPP1_CD44 | SPP1 | Cervix | Healthy |
| SPP1 | ITGAV_ITGB1 | SPP1_ITGAV_ITGB1 | SPP1 | Cervix | Healthy |
| SPP1 | ITGAV_ITGB5 | SPP1_ITGAV_ITGB5 | SPP1 | Cervix | Healthy |
| SPP1 | ITGA4_ITGB1 | SPP1_ITGA4_ITGB1 | SPP1 | Cervix | Healthy |
| SPP1 | ITGA8_ITGB1 | SPP1_ITGA8_ITGB1 | SPP1 | Cervix | Healthy |
| SPP1 | CD44 | SPP1_CD44 | SPP1 | Cervix | Precancer |
| SPP1 | ITGAV_ITGB1 | SPP1_ITGAV_ITGB1 | SPP1 | Cervix | Precancer |
| Page: 1 2 3 4 5 6 7 |
Top |
Single-cell gene regulatory network inference analysis |
| Find out the significant the regulons (TFs) and the target genes of each regulon across cell types for different disease states |
| TF | Cell Type | Tissue | Disease Stage | Target Gene | RSS | Regulon Activity |
| ∗The dot plots of a searched regulon are shown for all cell subpopulations in each disease state of each tissue based on the regulon specific score inferred using pySCENIC and by calculating the average expression. |
| Page: 1 |
Top |
Somatic mutation of malignant transformation related genes |
| Annotation of somatic variants for genes involved in malignant transformation |
| Hugo Symbol | Variant Class | Variant Classification | dbSNP RS | HGVSc | HGVSp | HGVSp Short | SWISSPROT | BIOTYPE | SIFT | PolyPhen | Tumor Sample Barcode | Tissue | Histology | Sex | Age | Stage | Therapy Types | Drugs | Outcome |
| SPP1 | SNV | Missense_Mutation | novel | c.696C>G | p.Asp232Glu | p.D232E | P10451 | protein_coding | tolerated(0.23) | benign(0.191) | TCGA-A7-A6VX-01 | Breast | breast invasive carcinoma | Female | >=65 | I/II | Chemotherapy | docetaxel | CR |
| SPP1 | SNV | Missense_Mutation | novel | c.320A>C | p.Asp107Ala | p.D107A | P10451 | protein_coding | deleterious(0.01) | possibly_damaging(0.836) | TCGA-AN-A0FL-01 | Breast | breast invasive carcinoma | Female | <65 | I/II | Unknown | Unknown | SD |
| SPP1 | SNV | Missense_Mutation | c.926N>T | p.Ala309Val | p.A309V | P10451 | protein_coding | tolerated(0.05) | benign(0.291) | TCGA-BH-A203-01 | Breast | breast invasive carcinoma | Female | >=65 | I/II | Unknown | Unknown | PD | |
| SPP1 | SNV | Missense_Mutation | rs750622416 | c.119T>C | p.Val40Ala | p.V40A | P10451 | protein_coding | tolerated(0.09) | benign(0.019) | TCGA-C8-A1HG-01 | Breast | breast invasive carcinoma | Female | <65 | I/II | Unknown | Unknown | SD |
| SPP1 | SNV | Missense_Mutation | rs145657424 | c.283N>A | p.Asp95Asn | p.D95N | P10451 | protein_coding | tolerated(0.1) | benign(0.028) | TCGA-E9-A22E-01 | Breast | breast invasive carcinoma | Female | <65 | III/IV | Chemotherapy | cyclophosphane | SD |
| SPP1 | insertion | Nonsense_Mutation | novel | c.498_499insTTTTTGTAGCTTTACAACAAATACCCAGATG | p.Leu167PhefsTer3 | p.L167Ffs*3 | P10451 | protein_coding | TCGA-BH-A0AY-01 | Breast | breast invasive carcinoma | Female | <65 | I/II | Chemotherapy | SD | |||
| SPP1 | SNV | Missense_Mutation | c.917T>C | p.Leu306Ser | p.L306S | P10451 | protein_coding | deleterious(0.01) | benign(0.11) | TCGA-FU-A57G-01 | Cervix | cervical & endocervical cancer | Female | <65 | I/II | Unknown | Unknown | SD | |
| SPP1 | SNV | Missense_Mutation | novel | c.280N>A | p.Asp94Asn | p.D94N | P10451 | protein_coding | tolerated(0.26) | benign(0.19) | TCGA-JW-A5VL-01 | Cervix | cervical & endocervical cancer | Female | <65 | I/II | Unknown | Unknown | SD |
| SPP1 | SNV | Missense_Mutation | rs377082687 | c.743N>A | p.Arg248Gln | p.R248Q | P10451 | protein_coding | tolerated(0.52) | benign(0.04) | TCGA-VS-A952-01 | Cervix | cervical & endocervical cancer | Female | >=65 | I/II | Unknown | Unknown | SD |
| SPP1 | SNV | Missense_Mutation | novel | c.110C>T | p.Pro37Leu | p.P37L | P10451 | protein_coding | tolerated(0.08) | probably_damaging(0.973) | TCGA-ZJ-AB0H-01 | Cervix | cervical & endocervical cancer | Female | <65 | III/IV | Unknown | Unknown | SD |
| Page: 1 2 3 4 5 |
Top |
Related drugs of malignant transformation related genes |
| Identification of chemicals and drugs interact with genes involved in malignant transfromation |
| (DGIdb 4.0) |
| Entrez ID | Symbol | Category | Interaction Types | Drug Claim Name | Drug Name | PMIDs |
| 6696 | SPP1 | DRUGGABLE GENOME | SODIUM BUTYRATE | 9224725 | ||
| 6696 | SPP1 | DRUGGABLE GENOME | TYROSINE KINASE INHIBITOR | 12176960 | ||
| 6696 | SPP1 | DRUGGABLE GENOME | WORTMANNIN | WORTMANNIN | 14703434 | |
| 6696 | SPP1 | DRUGGABLE GENOME | IMMUNOSUPPRESSANT | 15978615 | ||
| 6696 | SPP1 | DRUGGABLE GENOME | RETINOIC ACID | 9224725 | ||
| 6696 | SPP1 | DRUGGABLE GENOME | CHONDROITIN SULFATE | 12118914 | ||
| 6696 | SPP1 | DRUGGABLE GENOME | TPA | ALTEPLASE | 12009309 | |
| 6696 | SPP1 | DRUGGABLE GENOME | TACROLIMUS | TACROLIMUS | 16103732 | |
| 6696 | SPP1 | DRUGGABLE GENOME | inhibitor | CHEMBL2109530 | ASK-8007 | |
| 6696 | SPP1 | DRUGGABLE GENOME | 12-O-TETRADECANOYLPHORBOL-13-ACETATE | 12009309 |
| Page: 1 2 |

Copyright 2023-Present -The University of Texas Health Science Center at Houston |