Schematic overview of the cellular and molecular mechanisms involved in the cancer progression, including the proposed cellular and molecular mechanisms in cancer cells trajectory. AT1: alveolar type 1 cells; AT2: alveolar type 2 cells; AAH: atypical adenomatous hyperplasia; AIS: adenocarcinoma in situ; MIA: minimally invasive adenocarcinoma; IA: invasive adenocarcinoma; EMT: epithelial-mesenchymal transition

Home

Download

Statistics

Help

Contact

Center for Computational Systems Medicine
leaf

Gene summary

leaf

Malignant transformation analysis

leaf

Malignant transformation related pathway analysis

leaf

Cell-cell communication analysis

leaf

Single-cell gene regulatory network inference analysis

leaf

Somatic mutation of malignant transformation related genes

leaf

Related drugs of malignant transformation related genes

Gene: SPOP

Gene summary for SPOP

check button Gene summary.

Gene informationSpeciesHuman
Gene symbol

SPOP

Gene ID

8405

Gene namespeckle type BTB/POZ protein
Gene AliasBTBD32
Cytomap17q21.33
Gene Typeprotein-coding
GO ID

GO:0000209

UniProtAcc

O43791


Top

Malignant transformation analysis

check button Identification of the aberrant gene expression in precancerous and cancerous lesions by comparing the gene expression of stem-like cells in diseased tissues with normal stem cells
check button Malignant transformation involving gene list.
Entrez IDSymbolReplicatesSpeciesOrganTissueAdj P-valueLog2FCMalignancy
8405SPOPLZE4THumanEsophagusESCC7.41e-134.52e-010.0811
8405SPOPLZE7THumanEsophagusESCC1.13e-054.31e-010.0667
8405SPOPLZE8THumanEsophagusESCC1.12e-112.43e-010.067
8405SPOPLZE24THumanEsophagusESCC9.69e-227.00e-010.0596
8405SPOPP1T-EHumanEsophagusESCC6.19e-062.82e-010.0875
8405SPOPP2T-EHumanEsophagusESCC2.81e-355.80e-010.1177
8405SPOPP4T-EHumanEsophagusESCC1.29e-246.74e-010.1323
8405SPOPP5T-EHumanEsophagusESCC4.77e-133.31e-010.1327
8405SPOPP8T-EHumanEsophagusESCC1.81e-296.47e-010.0889
8405SPOPP9T-EHumanEsophagusESCC4.24e-102.05e-010.1131
8405SPOPP10T-EHumanEsophagusESCC5.69e-265.60e-010.116
8405SPOPP11T-EHumanEsophagusESCC1.40e-198.50e-010.1426
8405SPOPP12T-EHumanEsophagusESCC3.97e-337.15e-010.1122
8405SPOPP15T-EHumanEsophagusESCC3.27e-275.33e-010.1149
8405SPOPP16T-EHumanEsophagusESCC2.16e-225.79e-010.1153
8405SPOPP17T-EHumanEsophagusESCC1.16e-084.76e-010.1278
8405SPOPP19T-EHumanEsophagusESCC1.74e-086.12e-010.1662
8405SPOPP20T-EHumanEsophagusESCC2.56e-145.60e-010.1124
8405SPOPP21T-EHumanEsophagusESCC2.81e-246.28e-010.1617
8405SPOPP22T-EHumanEsophagusESCC1.34e-254.22e-010.1236
Page: 1 2 3 4 5 6 

check button Transcriptomic changes along malignancy continuum.
TissueExpression DynamicsAbbreviation
EsophagusThe image shows the transcriptomic changes along malignancy continuum.log2FC in expression of this searched gene in stem-like cells from each diseased tissue sample relative to stem-like cells in normal samples in each tissue plotted against the malignancy continuum. Samples are colored based on if they are from different disease stage.
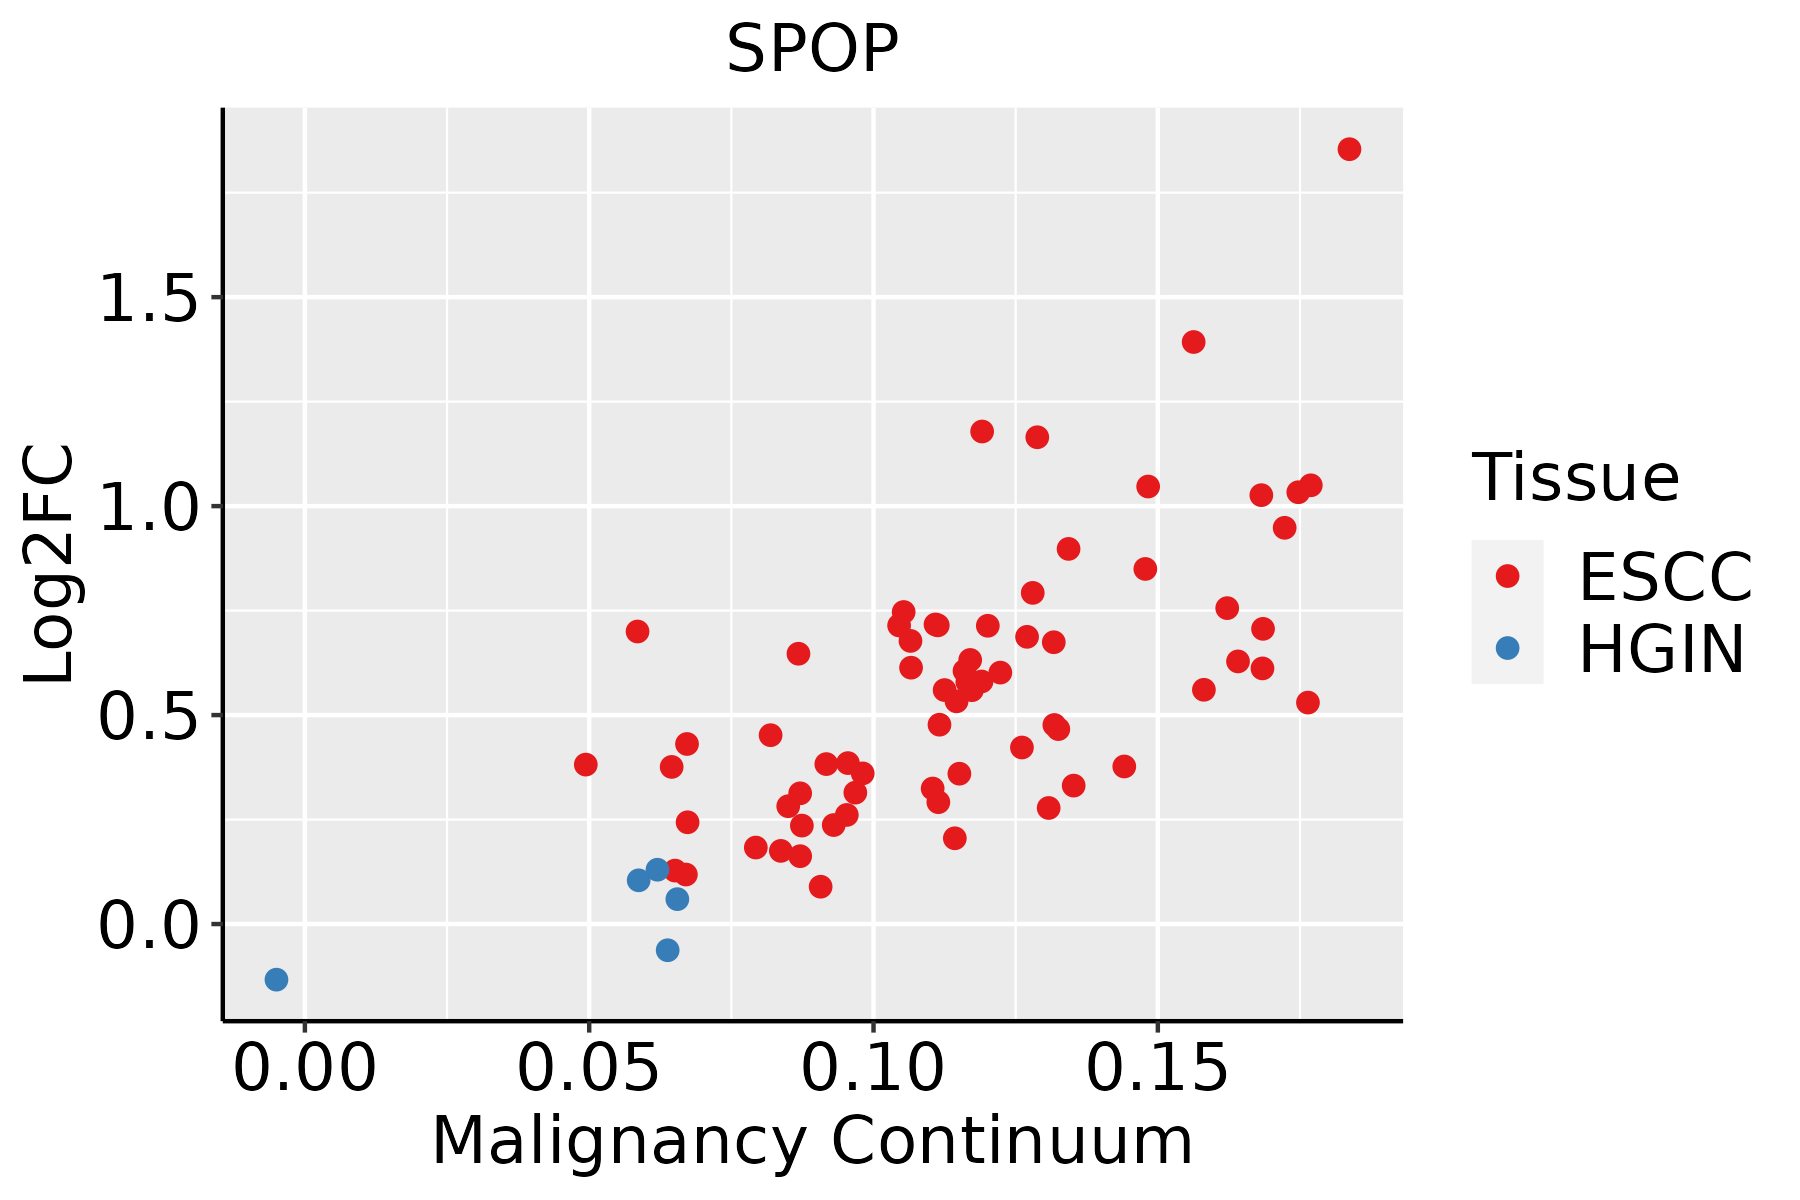
ESCC: Esophageal squamous cell carcinoma
HGIN: High-grade intraepithelial neoplasias
LGIN: Low-grade intraepithelial neoplasias
LiverThe image shows the transcriptomic changes along malignancy continuum.log2FC in expression of this searched gene in stem-like cells from each diseased tissue sample relative to stem-like cells in normal samples in each tissue plotted against the malignancy continuum. Samples are colored based on if they are from different disease stage.HCC: Hepatocellular carcinoma
NAFLD: Non-alcoholic fatty liver disease
Oral CavityThe image shows the transcriptomic changes along malignancy continuum.log2FC in expression of this searched gene in stem-like cells from each diseased tissue sample relative to stem-like cells in normal samples in each tissue plotted against the malignancy continuum. Samples are colored based on if they are from different disease stage.
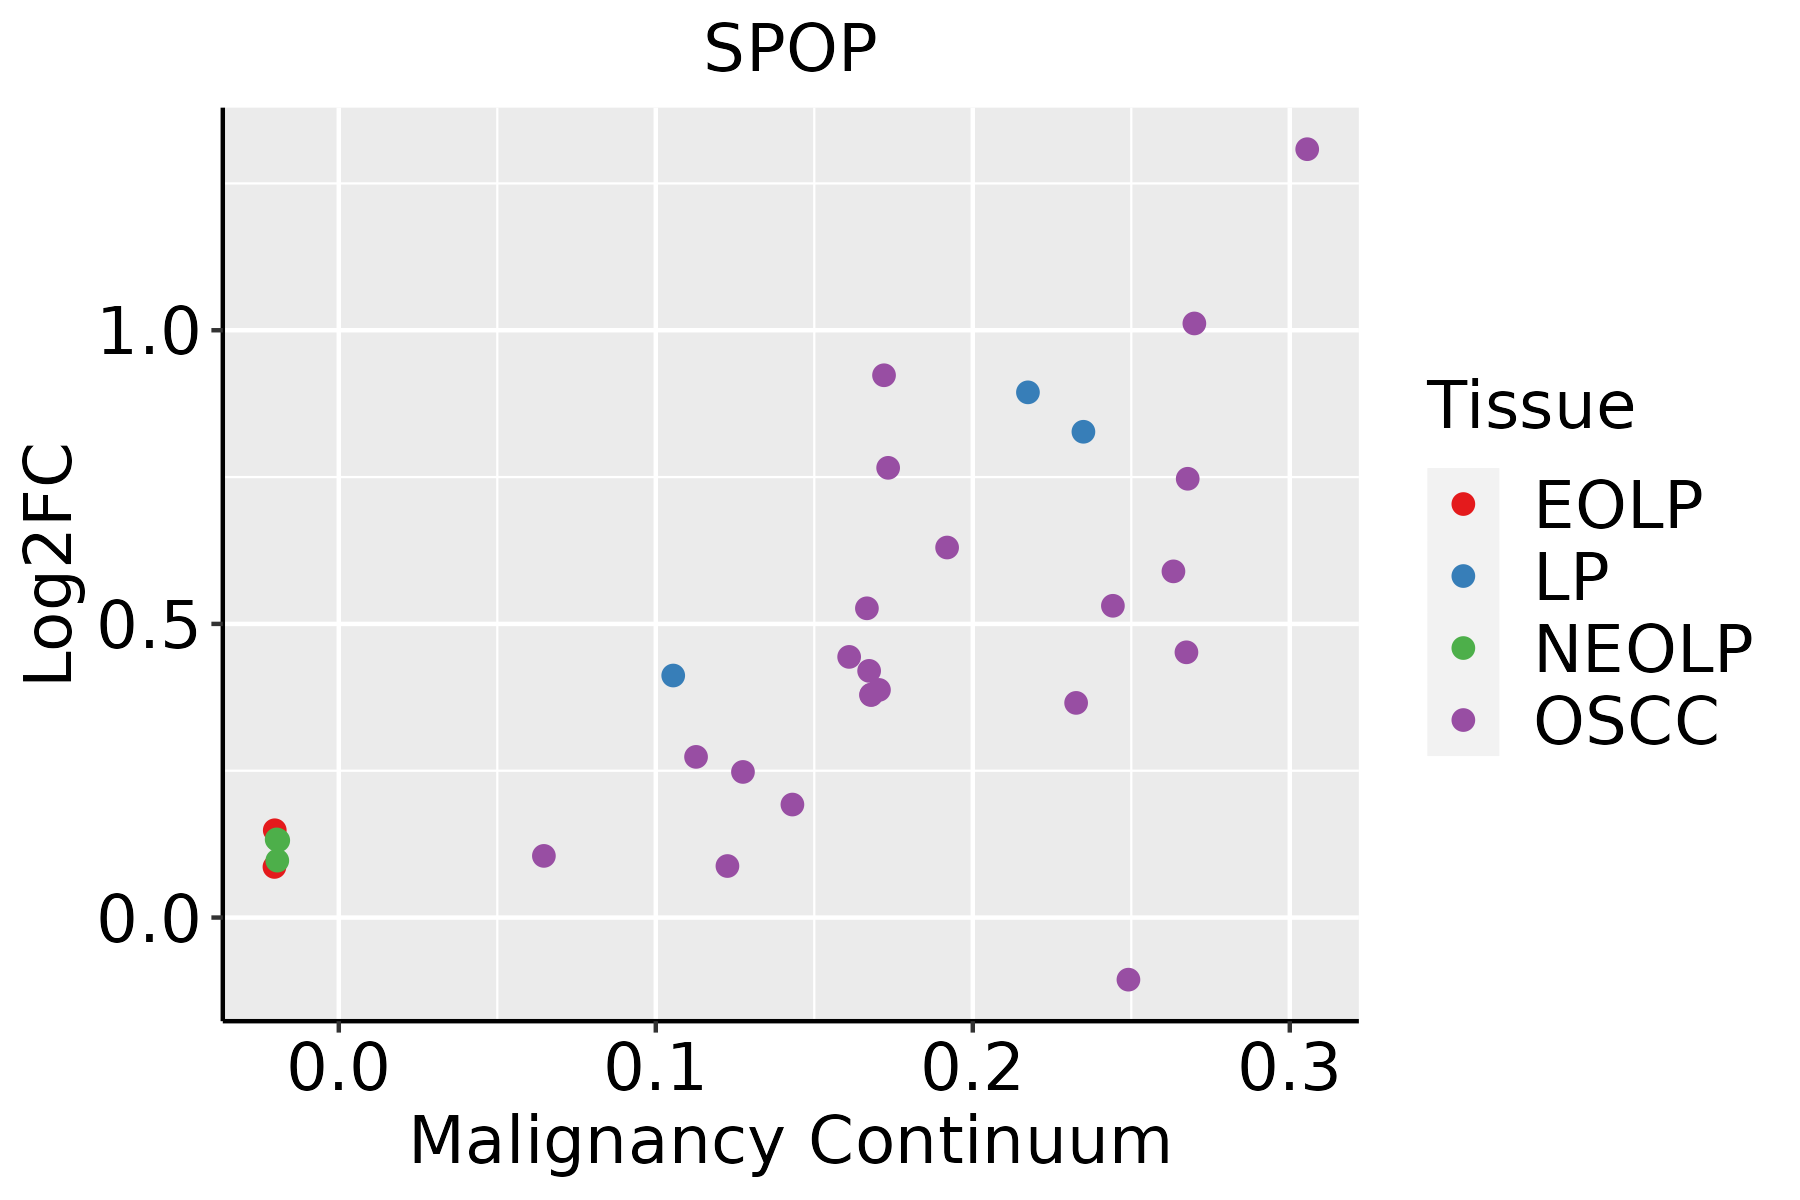
EOLP: Erosive Oral lichen planus
LP: leukoplakia
NEOLP: Non-erosive oral lichen planus
OSCC: Oral squamous cell carcinoma
SkinThe image shows the transcriptomic changes along malignancy continuum.log2FC in expression of this searched gene in stem-like cells from each diseased tissue sample relative to stem-like cells in normal samples in each tissue plotted against the malignancy continuum. Samples are colored based on if they are from different disease stage.
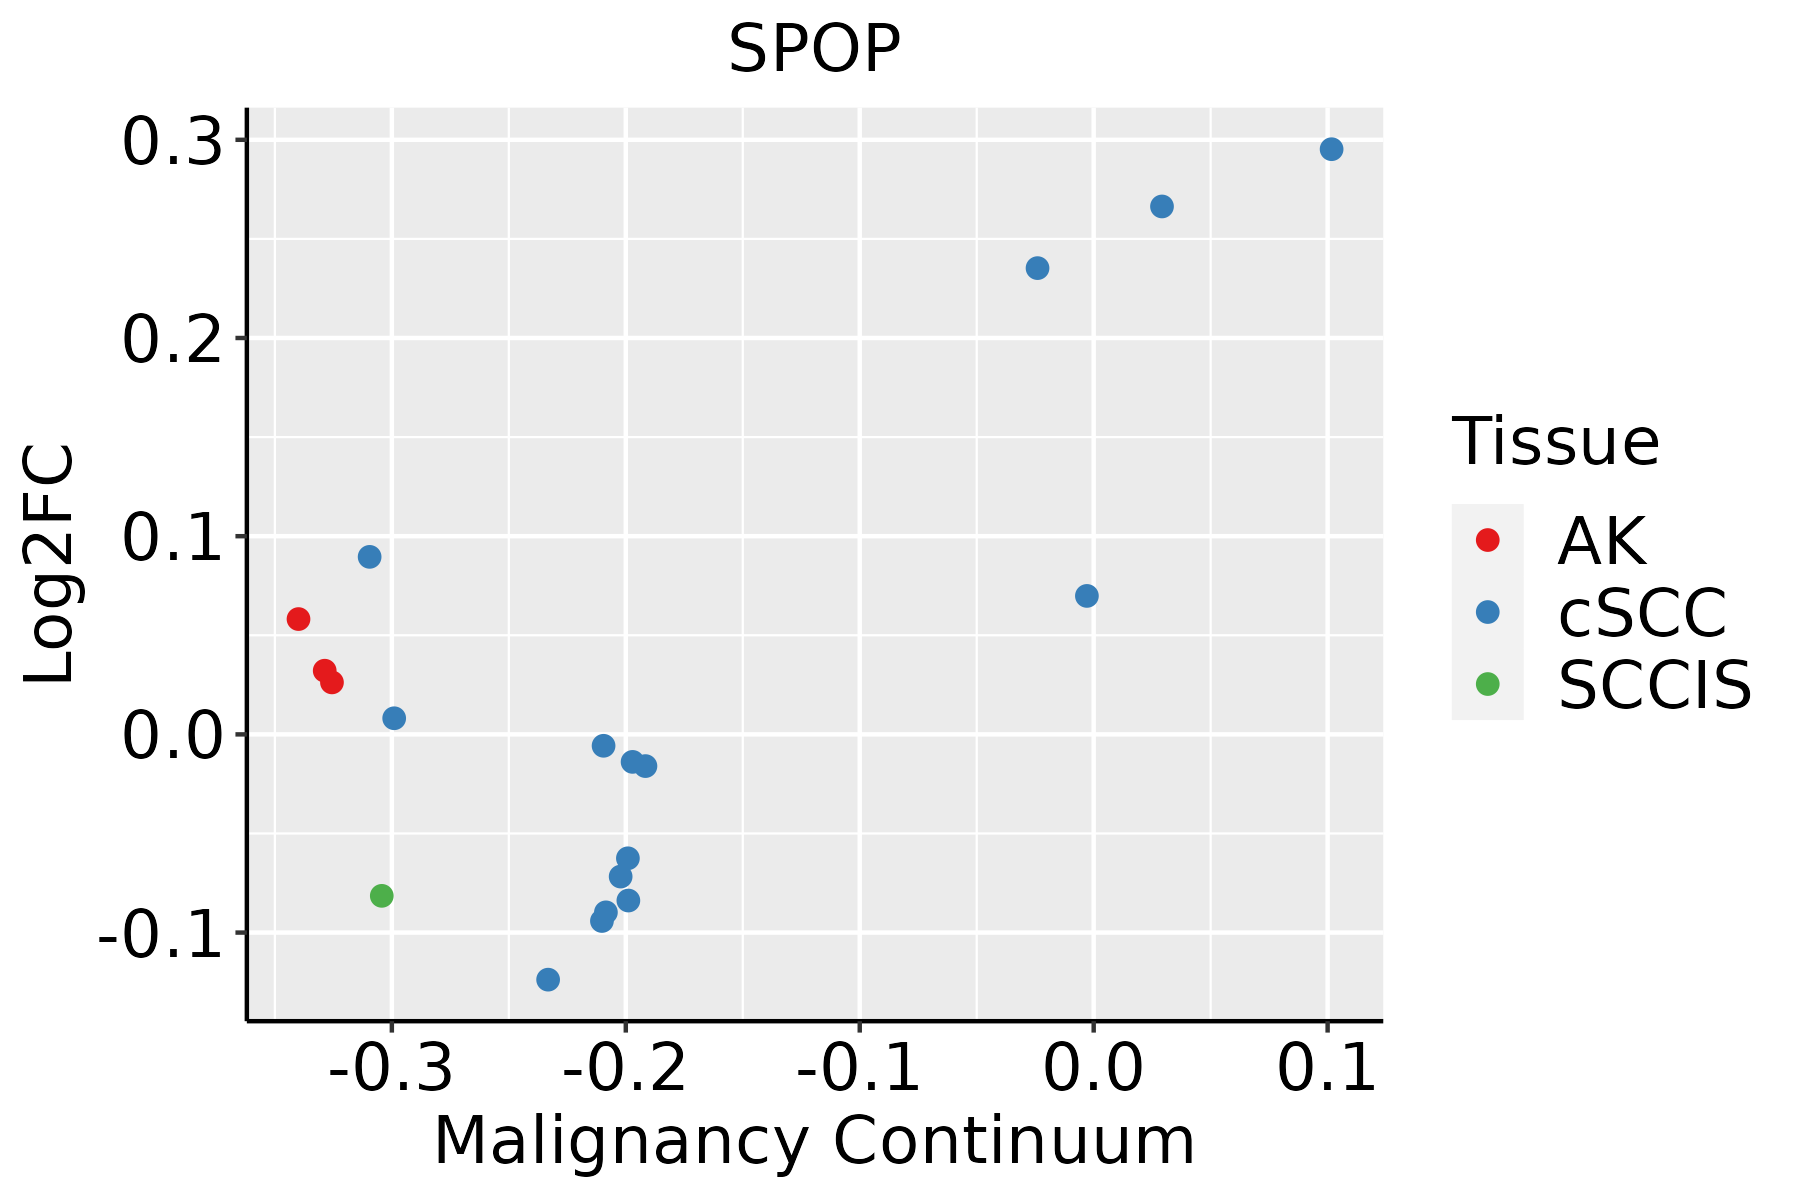
AK: Actinic keratosis
cSCC: Cutaneous squamous cell carcinoma
SCCIS:squamous cell carcinoma in situ
ThyroidThe image shows the transcriptomic changes along malignancy continuum.log2FC in expression of this searched gene in stem-like cells from each diseased tissue sample relative to stem-like cells in normal samples in each tissue plotted against the malignancy continuum. Samples are colored based on if they are from different disease stage.ATC: Anaplastic thyroid cancer
HT: Hashimoto's thyroiditis
PTC: Papillary thyroid cancer
∗log2FC in expression of this searched gene in stem-like cells from each diseased tissue sample relative to stem-like cells in normal samples in each tissue plotted against the malignancy continuum. Samples are colored based on if they are from different disease stage.

Top

Malignant transformation related pathway analysis

check buttonFind out the enriched GO biological processes and KEGG pathways involved in transition from healthy to precancer to cancer
check button Figure of enriched GO biological processes.
TissueDisease StageEnriched GO biological Processes
ColorectumADGO analysis - Figure of enriched GO biological processes: Top 15 enriched GO BP terms are showed in the bar plot of each disease state in each tissue. Each row represents a significant GO biological process which is colored according to the -log10(p.adjust).
ColorectumSERGO analysis - Figure of enriched GO biological processes: Top 15 enriched GO BP terms are showed in the bar plot of each disease state in each tissue. Each row represents a significant GO biological process which is colored according to the -log10(p.adjust).
ColorectumMSSGO analysis - Figure of enriched GO biological processes: Top 15 enriched GO BP terms are showed in the bar plot of each disease state in each tissue. Each row represents a significant GO biological process which is colored according to the -log10(p.adjust).
ColorectumMSI-HGO analysis - Figure of enriched GO biological processes: Top 15 enriched GO BP terms are showed in the bar plot of each disease state in each tissue. Each row represents a significant GO biological process which is colored according to the -log10(p.adjust).
ColorectumFAPGO analysis - Figure of enriched GO biological processes: Top 15 enriched GO BP terms are showed in the bar plot of each disease state in each tissue. Each row represents a significant GO biological process which is colored according to the -log10(p.adjust).
∗Top 15 enriched GO BP terms are showed in the bar plot of each disease state in each tissue. Each row represents a significant GO biological process which is colored according to the -log10(p.adjust).
Page: 1 2 3 4 5 6 7 8 9 

check button Enriched GO biological processes.
GO IDTissueDisease StageDescriptionGene RatioBg Ratiopvaluep.adjustCount
GO:0010498111EsophagusESCCproteasomal protein catabolic process369/8552490/187231.13e-411.80e-38369
GO:0043161111EsophagusESCCproteasome-mediated ubiquitin-dependent protein catabolic process312/8552412/187233.53e-364.48e-33312
GO:000020917EsophagusESCCprotein polyubiquitination170/8552236/187231.40e-161.09e-14170
GO:00431617LiverNAFLDproteasome-mediated ubiquitin-dependent protein catabolic process91/1882412/187233.00e-131.75e-1091
GO:00104987LiverNAFLDproteasomal protein catabolic process101/1882490/187231.35e-126.09e-10101
GO:00002095LiverNAFLDprotein polyubiquitination51/1882236/187231.04e-078.10e-0651
GO:001049812LiverCirrhoticproteasomal protein catabolic process216/4634490/187232.52e-219.29e-19216
GO:004316112LiverCirrhoticproteasome-mediated ubiquitin-dependent protein catabolic process184/4634412/187234.52e-198.85e-17184
GO:000020911LiverCirrhoticprotein polyubiquitination89/4634236/187236.09e-069.80e-0589
GO:001049822LiverHCCproteasomal protein catabolic process351/7958490/187236.92e-401.46e-36351
GO:004316122LiverHCCproteasome-mediated ubiquitin-dependent protein catabolic process299/7958412/187237.82e-368.27e-33299
GO:000020921LiverHCCprotein polyubiquitination151/7958236/187231.90e-117.59e-10151
GO:001049820Oral cavityOSCCproteasomal protein catabolic process336/7305490/187235.45e-418.63e-38336
GO:004316120Oral cavityOSCCproteasome-mediated ubiquitin-dependent protein catabolic process285/7305412/187235.68e-365.99e-33285
GO:000020910Oral cavityOSCCprotein polyubiquitination150/7305236/187231.59e-149.27e-13150
GO:0010498110Oral cavityLPproteasomal protein catabolic process224/4623490/187239.57e-254.00e-22224
GO:0043161110Oral cavityLPproteasome-mediated ubiquitin-dependent protein catabolic process190/4623412/187231.08e-212.93e-19190
GO:000020915Oral cavityLPprotein polyubiquitination82/4623236/187233.23e-043.26e-0382
GO:001049828SkincSCCproteasomal protein catabolic process243/4864490/187237.85e-304.10e-27243
GO:004316128SkincSCCproteasome-mediated ubiquitin-dependent protein catabolic process205/4864412/187231.46e-254.16e-23205
Page: 1 2 

check button Enriched KEGG pathways.
Pathway IDTissueDisease StageDescriptionGene RatioBg Ratiopvaluep.adjustqvalueCount
Page: 1 

Top

Cell-cell communication analysis

check buttonIdentification of potential cell-cell interactions between two cell types and their ligand-receptor pairs for different disease states
LigandReceptorLRpairPathwayTissueDisease Stage
Page: 1 

Top

Single-cell gene regulatory network inference analysis

check buttonFind out the significant the regulons (TFs) and the target genes of each regulon across cell types for different disease states
TFCell TypeTissueDisease StageTarget GeneRSSRegulon Activity
∗The dot plots of a searched regulon are shown for all cell subpopulations in each disease state of each tissue based on the regulon specific score inferred using pySCENIC and by calculating the average expression.
Page: 1 

Top

Somatic mutation of malignant transformation related genes

check buttonAnnotation of somatic variants for genes involved in malignant transformation
Hugo SymbolVariant ClassVariant ClassificationdbSNP RSHGVScHGVSpHGVSp ShortSWISSPROTBIOTYPESIFTPolyPhenTumor Sample BarcodeTissueHistologySexAgeStageTherapy TypesDrugsOutcome
SPOPSNVMissense_Mutationnovelc.164N>Gp.Ser55Cysp.S55CO43791protein_codingdeleterious(0.02)probably_damaging(1)TCGA-AC-A5XS-01Breastbreast invasive carcinomaFemale>=65I/IIHormone TherapyfemaraSD
SPOPSNVMissense_Mutationc.973N>Gp.Ile325Valp.I325VO43791protein_codingdeleterious(0.02)benign(0.009)TCGA-AO-A0JM-01Breastbreast invasive carcinomaFemale<65I/IIChemotherapydoxorubicinSD
SPOPSNVMissense_Mutationnovelc.662N>Ap.Arg221Hisp.R221HO43791protein_codingtolerated(0.07)probably_damaging(1)TCGA-BH-A0HF-01Breastbreast invasive carcinomaFemale>=65I/IIHormone TherapyarimidexSD
SPOPSNVMissense_Mutationc.601N>Cp.Asp201Hisp.D201HO43791protein_codingdeleterious(0)probably_damaging(0.995)TCGA-D8-A147-01Breastbreast invasive carcinomaFemale<65I/IIChemotherapydoxorubicineSD
SPOPSNVMissense_Mutationc.418N>Ap.Asp140Asnp.D140NO43791protein_codingdeleterious(0.02)possibly_damaging(0.805)TCGA-S3-AA11-01Breastbreast invasive carcinomaFemale>=65I/IIHormone TherapyletrozoleCR
SPOPinsertionNonsense_Mutationnovelc.600_601insAAATGGAGTATGAGTCCCTAAACTCCTTCTGAGAGCAGAGAGAAGTGGp.Thr200_Asp201insLysTrpSerMetSerProTerThrProSerGluSerArgGluLysTrpp.T200_D201insKWSMSP*TPSESREKWO43791protein_codingTCGA-A8-A07J-01Breastbreast invasive carcinomaFemale<65I/IIChemotherapy5-fluorouracilCR
SPOPinsertionFrame_Shift_Insnovelc.212_213insGGGTCCAGCCTTTTCTCATATGCTTCCCCCTCTCp.Asn72GlyfsTer18p.N72Gfs*18O43791protein_codingTCGA-A8-A09M-01Breastbreast invasive carcinomaFemale>=65III/IVChemotherapypaclitaxelCR
SPOPinsertionFrame_Shift_Insnovelc.586_587insGAGTTAGGAGGACTGTGGGAGAp.Asn196ArgfsTer38p.N196Rfs*38O43791protein_codingTCGA-E9-A1NI-01Breastbreast invasive carcinomaFemale<65I/IIChemotherapydoxorubicinCR
SPOPSNVMissense_Mutationc.362N>Ap.Arg121Glnp.R121QO43791protein_codingtolerated(0.17)benign(0.015)TCGA-2W-A8YY-01Cervixcervical & endocervical cancerFemale<65I/IIChemotherapycisplatinCR
SPOPSNVMissense_Mutationc.349A>Gp.Met117Valp.M117VO43791protein_codingtolerated(0.12)benign(0.007)TCGA-JW-A5VH-01Cervixcervical & endocervical cancerFemale<65I/IIChemotherapycarboplatinPD
Page: 1 2 3 4 5 6 7 8 9 10 11 12 13 14 15 

Top

Related drugs of malignant transformation related genes

check buttonIdentification of chemicals and drugs interact with genes involved in malignant transfromation
(DGIdb 4.0)
Entrez IDSymbolCategoryInteraction TypesDrug Claim NameDrug NamePMIDs
Page: 1