
|
|||||
|
 | |
| |
| |
| |
| |
| |
|
Gene: SPON2 |
Gene summary for SPON2 |
| Gene information | Species | Human | Gene symbol | SPON2 | Gene ID | 10417 |
| Gene name | spondin 2 | |
| Gene Alias | DIL-1 | |
| Cytomap | 4p16.3 | |
| Gene Type | protein-coding | GO ID | GO:0001816 | UniProtAcc | Q9BUD6 |
Top |
Malignant transformation analysis |
| Identification of the aberrant gene expression in precancerous and cancerous lesions by comparing the gene expression of stem-like cells in diseased tissues with normal stem cells |
| Entrez ID | Symbol | Replicates | Species | Organ | Tissue | Adj P-value | Log2FC | Malignancy |
| 10417 | SPON2 | AEH-subject1 | Human | Endometrium | AEH | 4.58e-18 | -5.88e-01 | -0.3059 |
| 10417 | SPON2 | AEH-subject2 | Human | Endometrium | AEH | 1.06e-21 | -5.60e-01 | -0.2525 |
| 10417 | SPON2 | AEH-subject3 | Human | Endometrium | AEH | 4.54e-26 | -6.26e-01 | -0.2576 |
| 10417 | SPON2 | AEH-subject4 | Human | Endometrium | AEH | 3.17e-09 | -4.19e-01 | -0.2657 |
| 10417 | SPON2 | AEH-subject5 | Human | Endometrium | AEH | 3.95e-33 | -6.82e-01 | -0.2953 |
| 10417 | SPON2 | EEC-subject1 | Human | Endometrium | EEC | 4.07e-31 | -6.59e-01 | -0.2682 |
| 10417 | SPON2 | EEC-subject2 | Human | Endometrium | EEC | 1.58e-32 | -6.90e-01 | -0.2607 |
| 10417 | SPON2 | EEC-subject3 | Human | Endometrium | EEC | 3.32e-32 | -6.05e-01 | -0.2525 |
| 10417 | SPON2 | EEC-subject4 | Human | Endometrium | EEC | 2.60e-19 | -5.45e-01 | -0.2571 |
| 10417 | SPON2 | EEC-subject5 | Human | Endometrium | EEC | 1.36e-22 | -6.04e-01 | -0.249 |
| 10417 | SPON2 | GSM5276934 | Human | Endometrium | EEC | 4.75e-34 | -6.64e-01 | -0.0913 |
| 10417 | SPON2 | GSM5276935 | Human | Endometrium | EEC | 3.26e-18 | -6.01e-01 | -0.123 |
| 10417 | SPON2 | GSM5276937 | Human | Endometrium | EEC | 3.88e-07 | -4.02e-01 | -0.0897 |
| 10417 | SPON2 | GSM6177620_NYU_UCEC1_lib1_lib1 | Human | Endometrium | EEC | 3.16e-27 | -6.49e-01 | -0.1869 |
| 10417 | SPON2 | GSM6177620_NYU_UCEC1_lib2_lib2 | Human | Endometrium | EEC | 5.47e-26 | -6.71e-01 | -0.1875 |
| 10417 | SPON2 | GSM6177620_NYU_UCEC1_lib3_lib3 | Human | Endometrium | EEC | 7.62e-31 | -6.78e-01 | -0.1883 |
| 10417 | SPON2 | GSM6177621_NYU_UCEC2_lib1_lib1 | Human | Endometrium | EEC | 2.49e-33 | -6.48e-01 | -0.1934 |
| 10417 | SPON2 | GSM6177622_NYU_UCEC3_lib1_lib1 | Human | Endometrium | EEC | 2.82e-42 | -7.22e-01 | -0.1917 |
| 10417 | SPON2 | GSM6177622_NYU_UCEC3_lib2_lib2 | Human | Endometrium | EEC | 1.40e-46 | -7.22e-01 | -0.1916 |
| 10417 | SPON2 | GSM6177623_NYU_UCEC3_Vis | Human | Endometrium | EEC | 1.15e-04 | -2.56e-01 | -0.1269 |
| Page: 1 2 3 4 5 |
| Tissue | Expression Dynamics | Abbreviation |
| Endometrium |  | AEH: Atypical endometrial hyperplasia |
| EEC: Endometrioid Cancer | ||
| Esophagus | 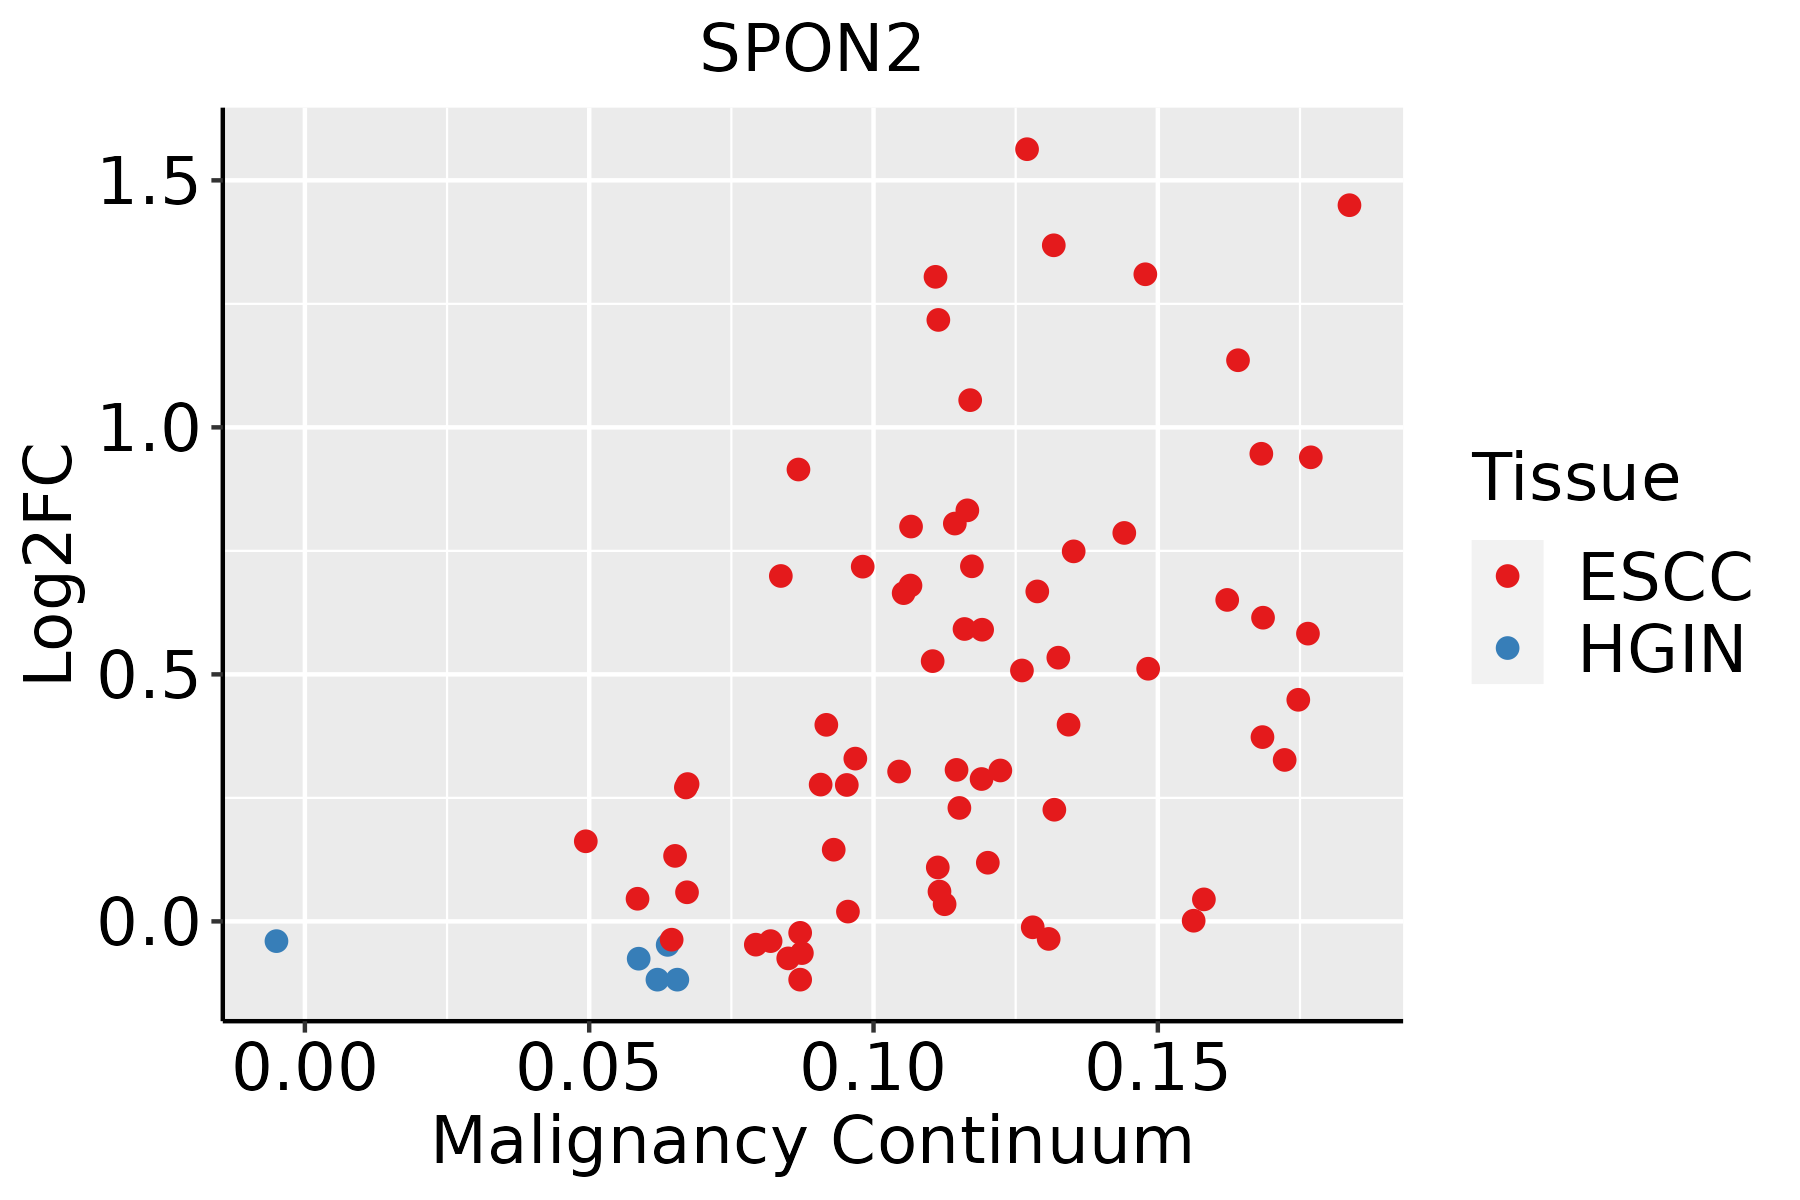 | ESCC: Esophageal squamous cell carcinoma |
| HGIN: High-grade intraepithelial neoplasias | ||
| LGIN: Low-grade intraepithelial neoplasias | ||
| Liver | 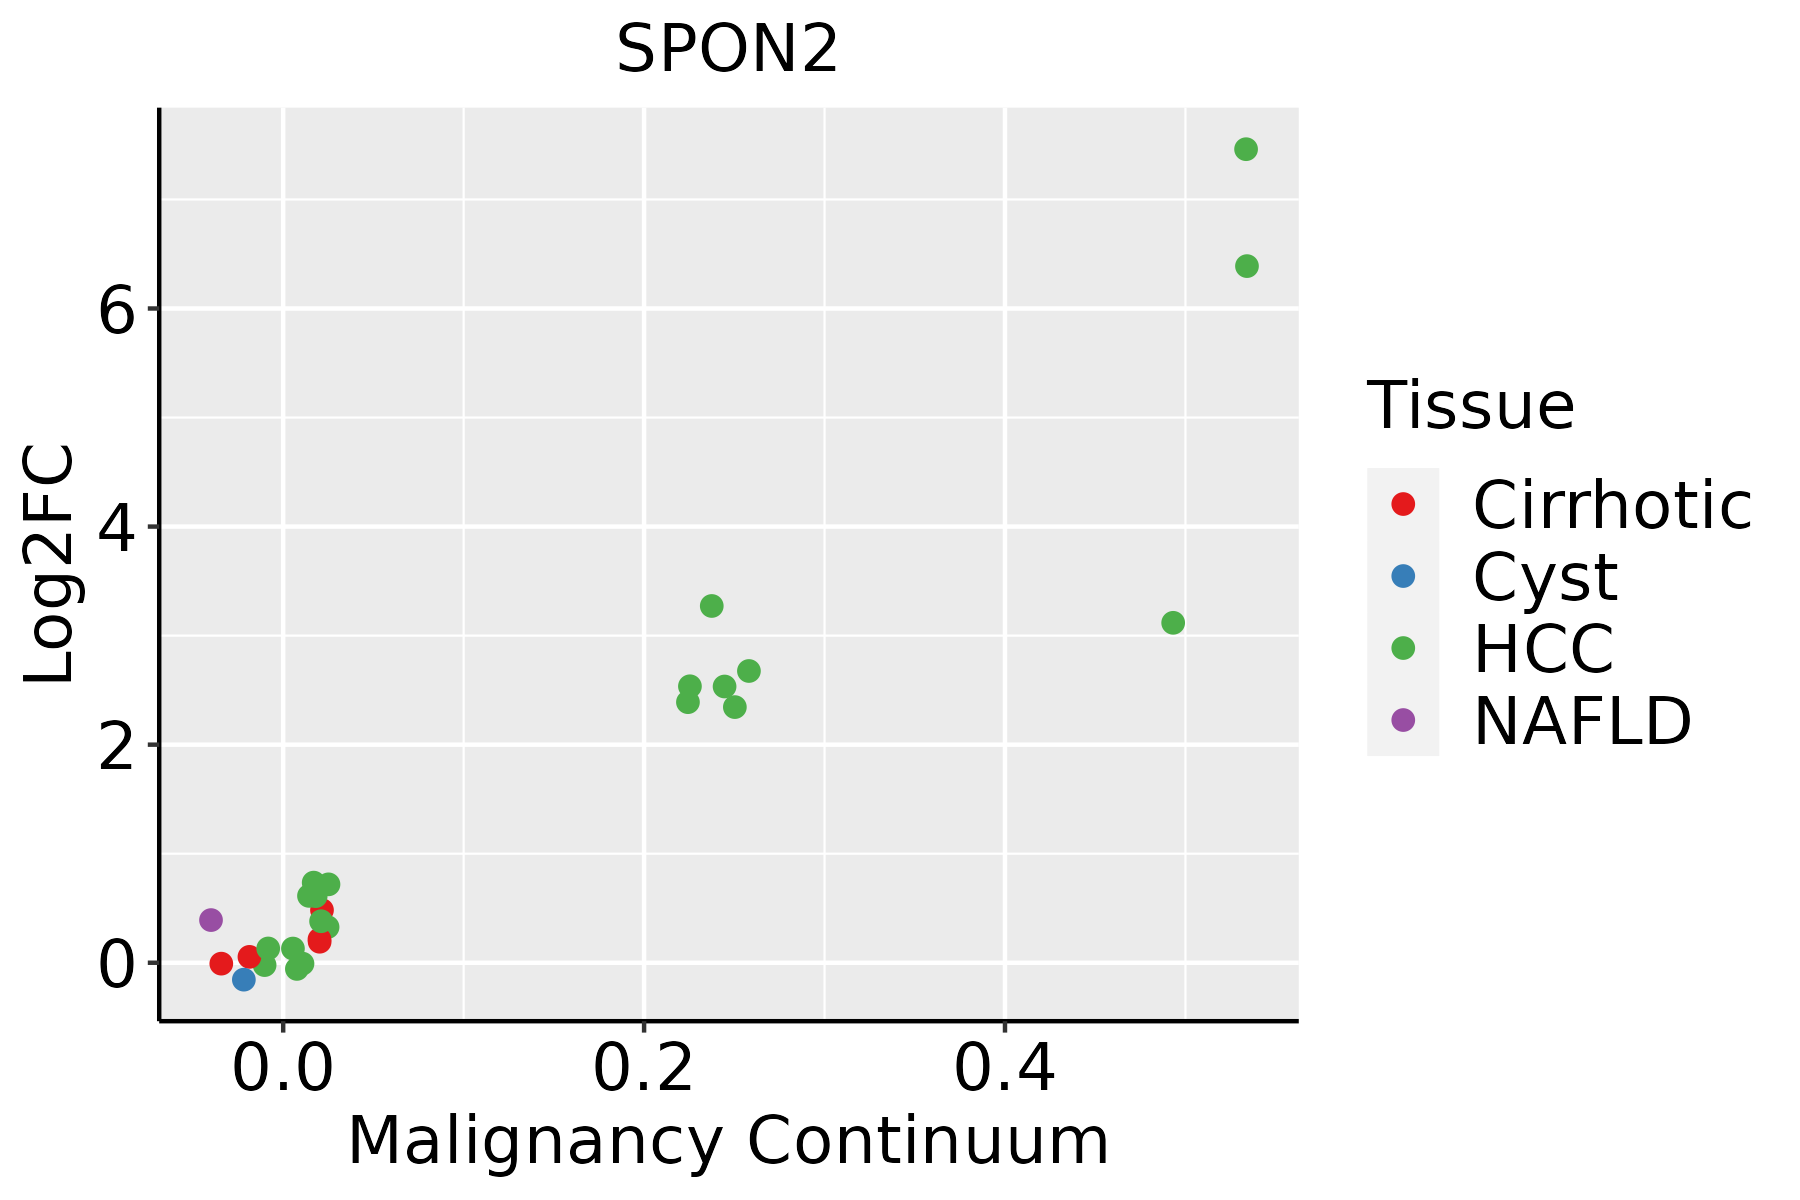 | HCC: Hepatocellular carcinoma |
| NAFLD: Non-alcoholic fatty liver disease | ||
| Oral Cavity |  | EOLP: Erosive Oral lichen planus |
| LP: leukoplakia | ||
| NEOLP: Non-erosive oral lichen planus | ||
| OSCC: Oral squamous cell carcinoma | ||
| Prostate |  | BPH: Benign Prostatic Hyperplasia |
| Skin | 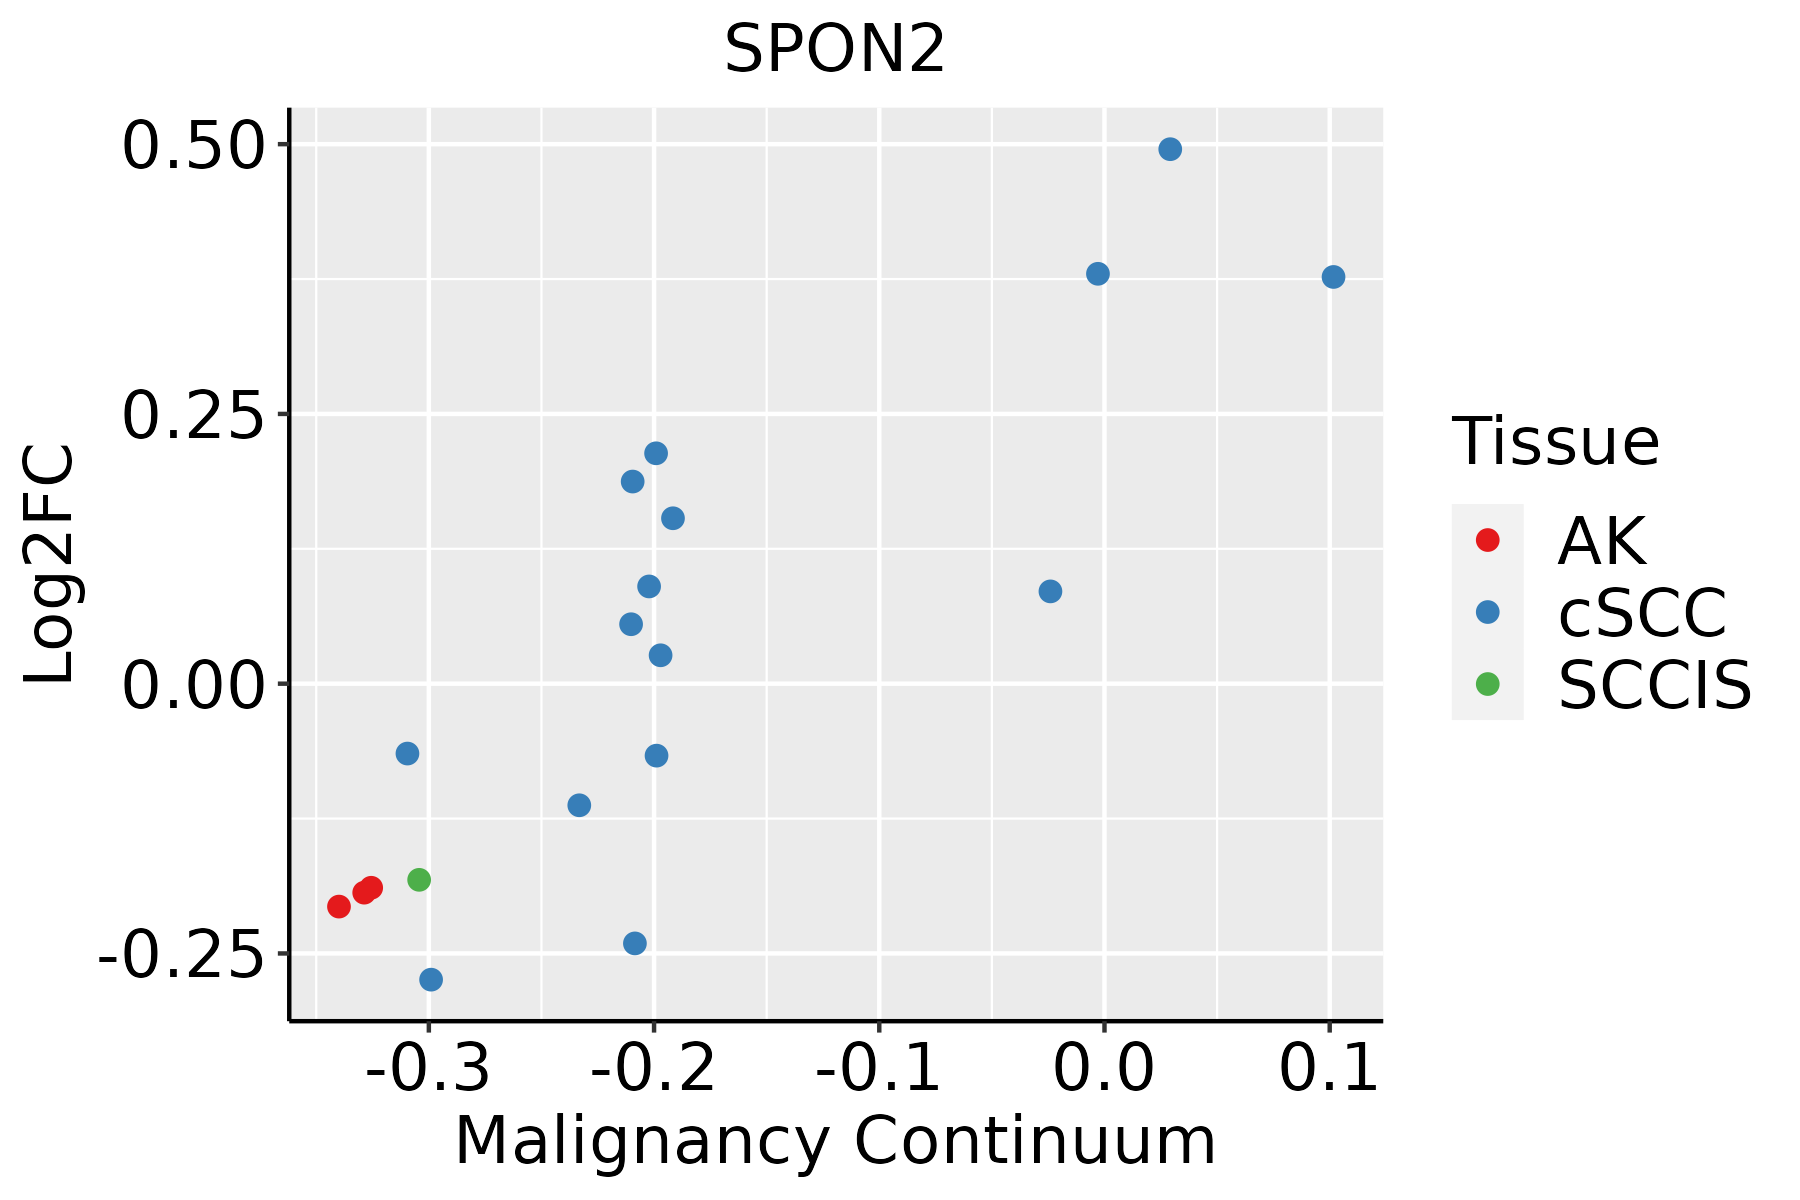 | AK: Actinic keratosis |
| cSCC: Cutaneous squamous cell carcinoma | ||
| SCCIS:squamous cell carcinoma in situ | ||
| Thyroid |  | ATC: Anaplastic thyroid cancer |
| HT: Hashimoto's thyroiditis | ||
| PTC: Papillary thyroid cancer |
| ∗log2FC in expression of this searched gene in stem-like cells from each diseased tissue sample relative to stem-like cells in normal samples in each tissue plotted against the malignancy continuum. Samples are colored based on if they are from different disease stage. |
Top |
Malignant transformation related pathway analysis |
| Find out the enriched GO biological processes and KEGG pathways involved in transition from healthy to precancer to cancer |
| Tissue | Disease Stage | Enriched GO biological Processes |
| Colorectum | AD |  |
| Colorectum | SER |  |
| Colorectum | MSS |  |
| Colorectum | MSI-H |  |
| Colorectum | FAP |  |
| ∗Top 15 enriched GO BP terms are showed in the bar plot of each disease state in each tissue. Each row represents a significant GO biological process which is colored according to the -log10(p.adjust). |
| Page: 1 2 3 4 5 6 7 8 9 |
| GO ID | Tissue | Disease Stage | Description | Gene Ratio | Bg Ratio | pvalue | p.adjust | Count |
| GO:000223710 | Endometrium | AEH | response to molecule of bacterial origin | 65/2100 | 363/18723 | 9.00e-05 | 1.30e-03 | 65 |
| GO:003249610 | Endometrium | AEH | response to lipopolysaccharide | 62/2100 | 343/18723 | 9.82e-05 | 1.41e-03 | 62 |
| GO:00096159 | Endometrium | AEH | response to virus | 63/2100 | 367/18723 | 3.81e-04 | 4.10e-03 | 63 |
| GO:00712229 | Endometrium | AEH | cellular response to lipopolysaccharide | 37/2100 | 209/18723 | 3.30e-03 | 2.31e-02 | 37 |
| GO:00712169 | Endometrium | AEH | cellular response to biotic stimulus | 42/2100 | 246/18723 | 3.65e-03 | 2.50e-02 | 42 |
| GO:00018198 | Endometrium | AEH | positive regulation of cytokine production | 71/2100 | 467/18723 | 4.76e-03 | 3.02e-02 | 71 |
| GO:00712199 | Endometrium | AEH | cellular response to molecule of bacterial origin | 37/2100 | 221/18723 | 8.34e-03 | 4.56e-02 | 37 |
| GO:000223714 | Endometrium | EEC | response to molecule of bacterial origin | 68/2168 | 363/18723 | 3.96e-05 | 6.64e-04 | 68 |
| GO:003249614 | Endometrium | EEC | response to lipopolysaccharide | 65/2168 | 343/18723 | 4.04e-05 | 6.75e-04 | 65 |
| GO:000961513 | Endometrium | EEC | response to virus | 66/2168 | 367/18723 | 1.78e-04 | 2.20e-03 | 66 |
| GO:007122213 | Endometrium | EEC | cellular response to lipopolysaccharide | 40/2168 | 209/18723 | 9.31e-04 | 8.37e-03 | 40 |
| GO:007121613 | Endometrium | EEC | cellular response to biotic stimulus | 45/2168 | 246/18723 | 1.24e-03 | 1.03e-02 | 45 |
| GO:007121913 | Endometrium | EEC | cellular response to molecule of bacterial origin | 40/2168 | 221/18723 | 2.73e-03 | 1.97e-02 | 40 |
| GO:000181913 | Endometrium | EEC | positive regulation of cytokine production | 73/2168 | 467/18723 | 4.64e-03 | 2.97e-02 | 73 |
| GO:000961518 | Esophagus | ESCC | response to virus | 238/8552 | 367/18723 | 6.65e-14 | 3.32e-12 | 238 |
| GO:00516075 | Esophagus | ESCC | defense response to virus | 171/8552 | 265/18723 | 3.91e-10 | 1.05e-08 | 171 |
| GO:01405465 | Esophagus | ESCC | defense response to symbiont | 171/8552 | 265/18723 | 3.91e-10 | 1.05e-08 | 171 |
| GO:003249619 | Esophagus | ESCC | response to lipopolysaccharide | 191/8552 | 343/18723 | 1.11e-04 | 7.73e-04 | 191 |
| GO:000223719 | Esophagus | ESCC | response to molecule of bacterial origin | 194/8552 | 363/18723 | 1.64e-03 | 7.61e-03 | 194 |
| GO:000181916 | Esophagus | ESCC | positive regulation of cytokine production | 244/8552 | 467/18723 | 2.29e-03 | 1.01e-02 | 244 |
| Page: 1 2 3 4 |
| Pathway ID | Tissue | Disease Stage | Description | Gene Ratio | Bg Ratio | pvalue | p.adjust | qvalue | Count |
| Page: 1 |
Top |
Cell-cell communication analysis |
| Identification of potential cell-cell interactions between two cell types and their ligand-receptor pairs for different disease states |
| Ligand | Receptor | LRpair | Pathway | Tissue | Disease Stage |
| Page: 1 |
Top |
Single-cell gene regulatory network inference analysis |
| Find out the significant the regulons (TFs) and the target genes of each regulon across cell types for different disease states |
| TF | Cell Type | Tissue | Disease Stage | Target Gene | RSS | Regulon Activity |
| ∗The dot plots of a searched regulon are shown for all cell subpopulations in each disease state of each tissue based on the regulon specific score inferred using pySCENIC and by calculating the average expression. |
| Page: 1 |
Top |
Somatic mutation of malignant transformation related genes |
| Annotation of somatic variants for genes involved in malignant transformation |
| Hugo Symbol | Variant Class | Variant Classification | dbSNP RS | HGVSc | HGVSp | HGVSp Short | SWISSPROT | BIOTYPE | SIFT | PolyPhen | Tumor Sample Barcode | Tissue | Histology | Sex | Age | Stage | Therapy Types | Drugs | Outcome |
| SPON2 | SNV | Missense_Mutation | novel | c.487N>C | p.Val163Leu | p.V163L | Q9BUD6 | protein_coding | tolerated(0.06) | possibly_damaging(0.761) | TCGA-A7-A4SA-01 | Breast | breast invasive carcinoma | Female | <65 | I/II | Chemotherapy | doxorubicin | CR |
| SPON2 | SNV | Missense_Mutation | rs376213322 | c.685N>T | p.Arg229Trp | p.R229W | Q9BUD6 | protein_coding | deleterious(0) | probably_damaging(0.994) | TCGA-A6-3810-01 | Colorectum | colon adenocarcinoma | Male | <65 | I/II | Unknown | Unknown | SD |
| SPON2 | SNV | Missense_Mutation | c.200N>T | p.Ala67Val | p.A67V | Q9BUD6 | protein_coding | deleterious(0.02) | probably_damaging(0.959) | TCGA-A6-5661-01 | Colorectum | colon adenocarcinoma | Female | >=65 | I/II | Unknown | Unknown | SD | |
| SPON2 | SNV | Missense_Mutation | c.190N>T | p.Arg64Cys | p.R64C | Q9BUD6 | protein_coding | deleterious(0) | probably_damaging(0.999) | TCGA-A6-6653-01 | Colorectum | colon adenocarcinoma | Male | >=65 | I/II | Unknown | Unknown | SD | |
| SPON2 | SNV | Missense_Mutation | novel | c.164N>T | p.Ala55Val | p.A55V | Q9BUD6 | protein_coding | deleterious(0.01) | possibly_damaging(0.468) | TCGA-AA-3947-01 | Colorectum | colon adenocarcinoma | Female | <65 | I/II | Unknown | Unknown | SD |
| SPON2 | SNV | Missense_Mutation | c.220N>T | p.Gly74Trp | p.G74W | Q9BUD6 | protein_coding | deleterious(0) | probably_damaging(1) | TCGA-AA-3975-01 | Colorectum | colon adenocarcinoma | Male | >=65 | I/II | Unknown | Unknown | SD | |
| SPON2 | SNV | Missense_Mutation | rs143524322 | c.779G>A | p.Ser260Asn | p.S260N | Q9BUD6 | protein_coding | tolerated(0.52) | benign(0.005) | TCGA-DM-A1HB-01 | Colorectum | colon adenocarcinoma | Male | >=65 | III/IV | Unknown | Unknown | SD |
| SPON2 | SNV | Missense_Mutation | rs781455865 | c.143C>T | p.Thr48Met | p.T48M | Q9BUD6 | protein_coding | deleterious(0.04) | benign(0.228) | TCGA-AG-3592-01 | Colorectum | rectum adenocarcinoma | Male | >=65 | I/II | Unknown | Unknown | SD |
| SPON2 | deletion | Frame_Shift_Del | novel | c.343delG | p.Glu115ArgfsTer96 | p.E115Rfs*96 | Q9BUD6 | protein_coding | TCGA-5M-AAT6-01 | Colorectum | colon adenocarcinoma | Female | <65 | III/IV | Unknown | Unknown | PD | ||
| SPON2 | SNV | Missense_Mutation | novel | c.718N>C | p.Thr240Pro | p.T240P | Q9BUD6 | protein_coding | tolerated(0.05) | possibly_damaging(0.825) | TCGA-AP-A0LF-01 | Endometrium | uterine corpus endometrioid carcinoma | Female | >=65 | III/IV | Unknown | Unknown | SD |
| Page: 1 2 3 |
Top |
Related drugs of malignant transformation related genes |
| Identification of chemicals and drugs interact with genes involved in malignant transfromation |
| (DGIdb 4.0) |
| Entrez ID | Symbol | Category | Interaction Types | Drug Claim Name | Drug Name | PMIDs |
| Page: 1 |

Copyright 2023-Present -The University of Texas Health Science Center at Houston |