
|
|||||
|
 | |
| |
| |
| |
| |
| |
|
Gene: SPOCK2 |
Gene summary for SPOCK2 |
| Gene information | Species | Human | Gene symbol | SPOCK2 | Gene ID | 9806 |
| Gene name | SPARC (osteonectin), cwcv and kazal like domains proteoglycan 2 | |
| Gene Alias | testican-2 | |
| Cytomap | 10q22.1 | |
| Gene Type | protein-coding | GO ID | GO:0006022 | UniProtAcc | Q92563 |
Top |
Malignant transformation analysis |
| Identification of the aberrant gene expression in precancerous and cancerous lesions by comparing the gene expression of stem-like cells in diseased tissues with normal stem cells |
| Entrez ID | Symbol | Replicates | Species | Organ | Tissue | Adj P-value | Log2FC | Malignancy |
| 9806 | SPOCK2 | LZE4T | Human | Esophagus | ESCC | 2.76e-05 | 3.91e-01 | 0.0811 |
| 9806 | SPOCK2 | LZE7T | Human | Esophagus | ESCC | 4.89e-08 | 1.01e+00 | 0.0667 |
| 9806 | SPOCK2 | LZE8T | Human | Esophagus | ESCC | 1.76e-02 | 4.27e-01 | 0.067 |
| 9806 | SPOCK2 | LZE22D1 | Human | Esophagus | HGIN | 1.22e-02 | 3.44e-01 | 0.0595 |
| 9806 | SPOCK2 | LZE6T | Human | Esophagus | ESCC | 5.17e-07 | 5.01e-01 | 0.0845 |
| 9806 | SPOCK2 | P2T-E | Human | Esophagus | ESCC | 3.75e-03 | 1.41e-01 | 0.1177 |
| 9806 | SPOCK2 | P10T-E | Human | Esophagus | ESCC | 5.68e-24 | 4.24e-01 | 0.116 |
| 9806 | SPOCK2 | P16T-E | Human | Esophagus | ESCC | 2.39e-10 | 1.97e-01 | 0.1153 |
| 9806 | SPOCK2 | P56T-E | Human | Esophagus | ESCC | 1.40e-06 | 7.21e-01 | 0.1613 |
| 9806 | SPOCK2 | P74T-E | Human | Esophagus | ESCC | 4.86e-06 | 2.51e-01 | 0.1479 |
| 9806 | SPOCK2 | P79T-E | Human | Esophagus | ESCC | 8.56e-12 | 2.73e-01 | 0.1154 |
| 9806 | SPOCK2 | P82T-E | Human | Esophagus | ESCC | 5.38e-11 | 1.25e+00 | 0.1072 |
| 9806 | SPOCK2 | P130T-E | Human | Esophagus | ESCC | 1.15e-45 | 9.40e-01 | 0.1676 |
| 9806 | SPOCK2 | C21 | Human | Oral cavity | OSCC | 6.08e-03 | 2.05e-01 | 0.2678 |
| 9806 | SPOCK2 | C30 | Human | Oral cavity | OSCC | 2.05e-03 | 2.31e-01 | 0.3055 |
| 9806 | SPOCK2 | C38 | Human | Oral cavity | OSCC | 6.35e-03 | 5.76e-01 | 0.172 |
| 9806 | SPOCK2 | C46 | Human | Oral cavity | OSCC | 4.30e-04 | 1.22e-01 | 0.1673 |
| 9806 | SPOCK2 | C06 | Human | Oral cavity | OSCC | 3.47e-05 | 8.37e-01 | 0.2699 |
| 9806 | SPOCK2 | C07 | Human | Oral cavity | OSCC | 5.01e-09 | 4.89e-01 | 0.2491 |
| 9806 | SPOCK2 | C09 | Human | Oral cavity | OSCC | 1.12e-04 | 1.44e-01 | 0.1431 |
| Page: 1 2 |
| Tissue | Expression Dynamics | Abbreviation |
| Esophagus | 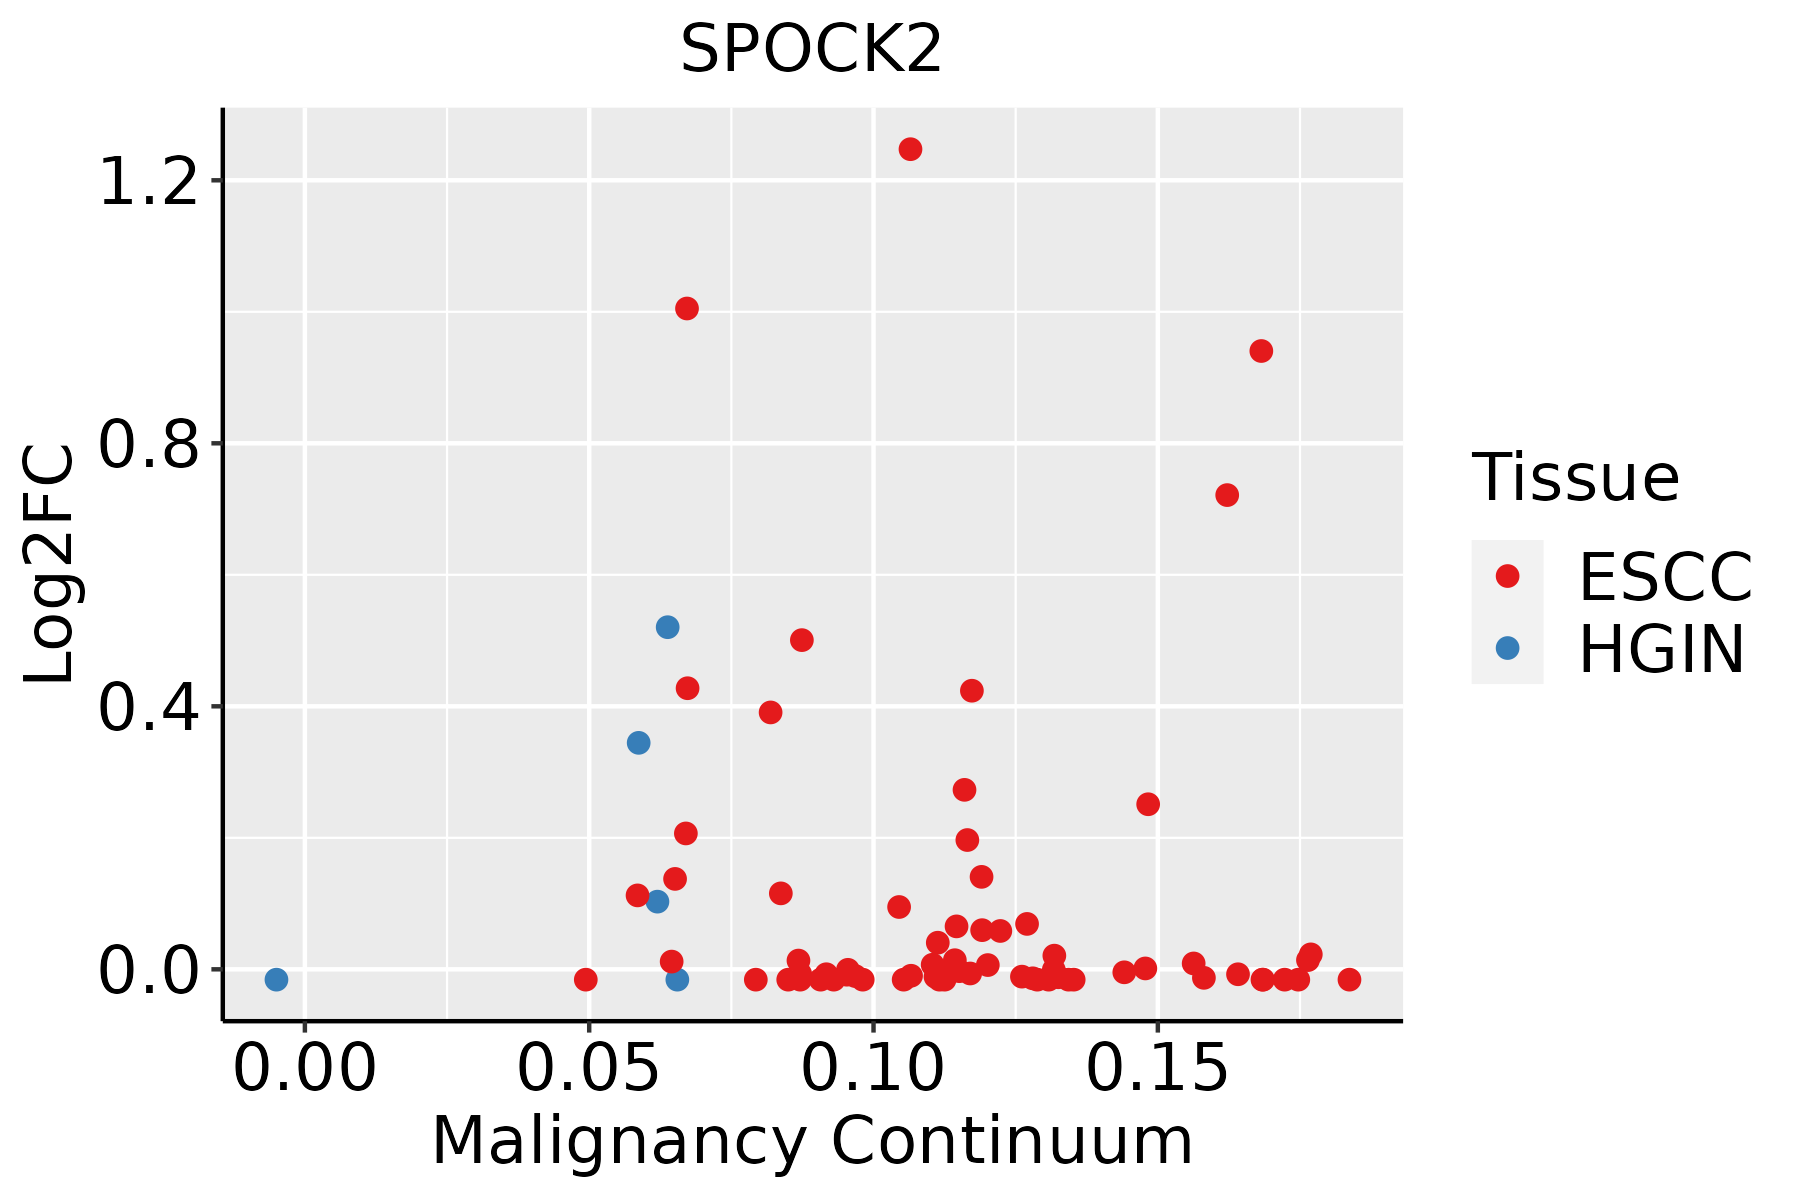 | ESCC: Esophageal squamous cell carcinoma |
| HGIN: High-grade intraepithelial neoplasias | ||
| LGIN: Low-grade intraepithelial neoplasias | ||
| Oral Cavity | 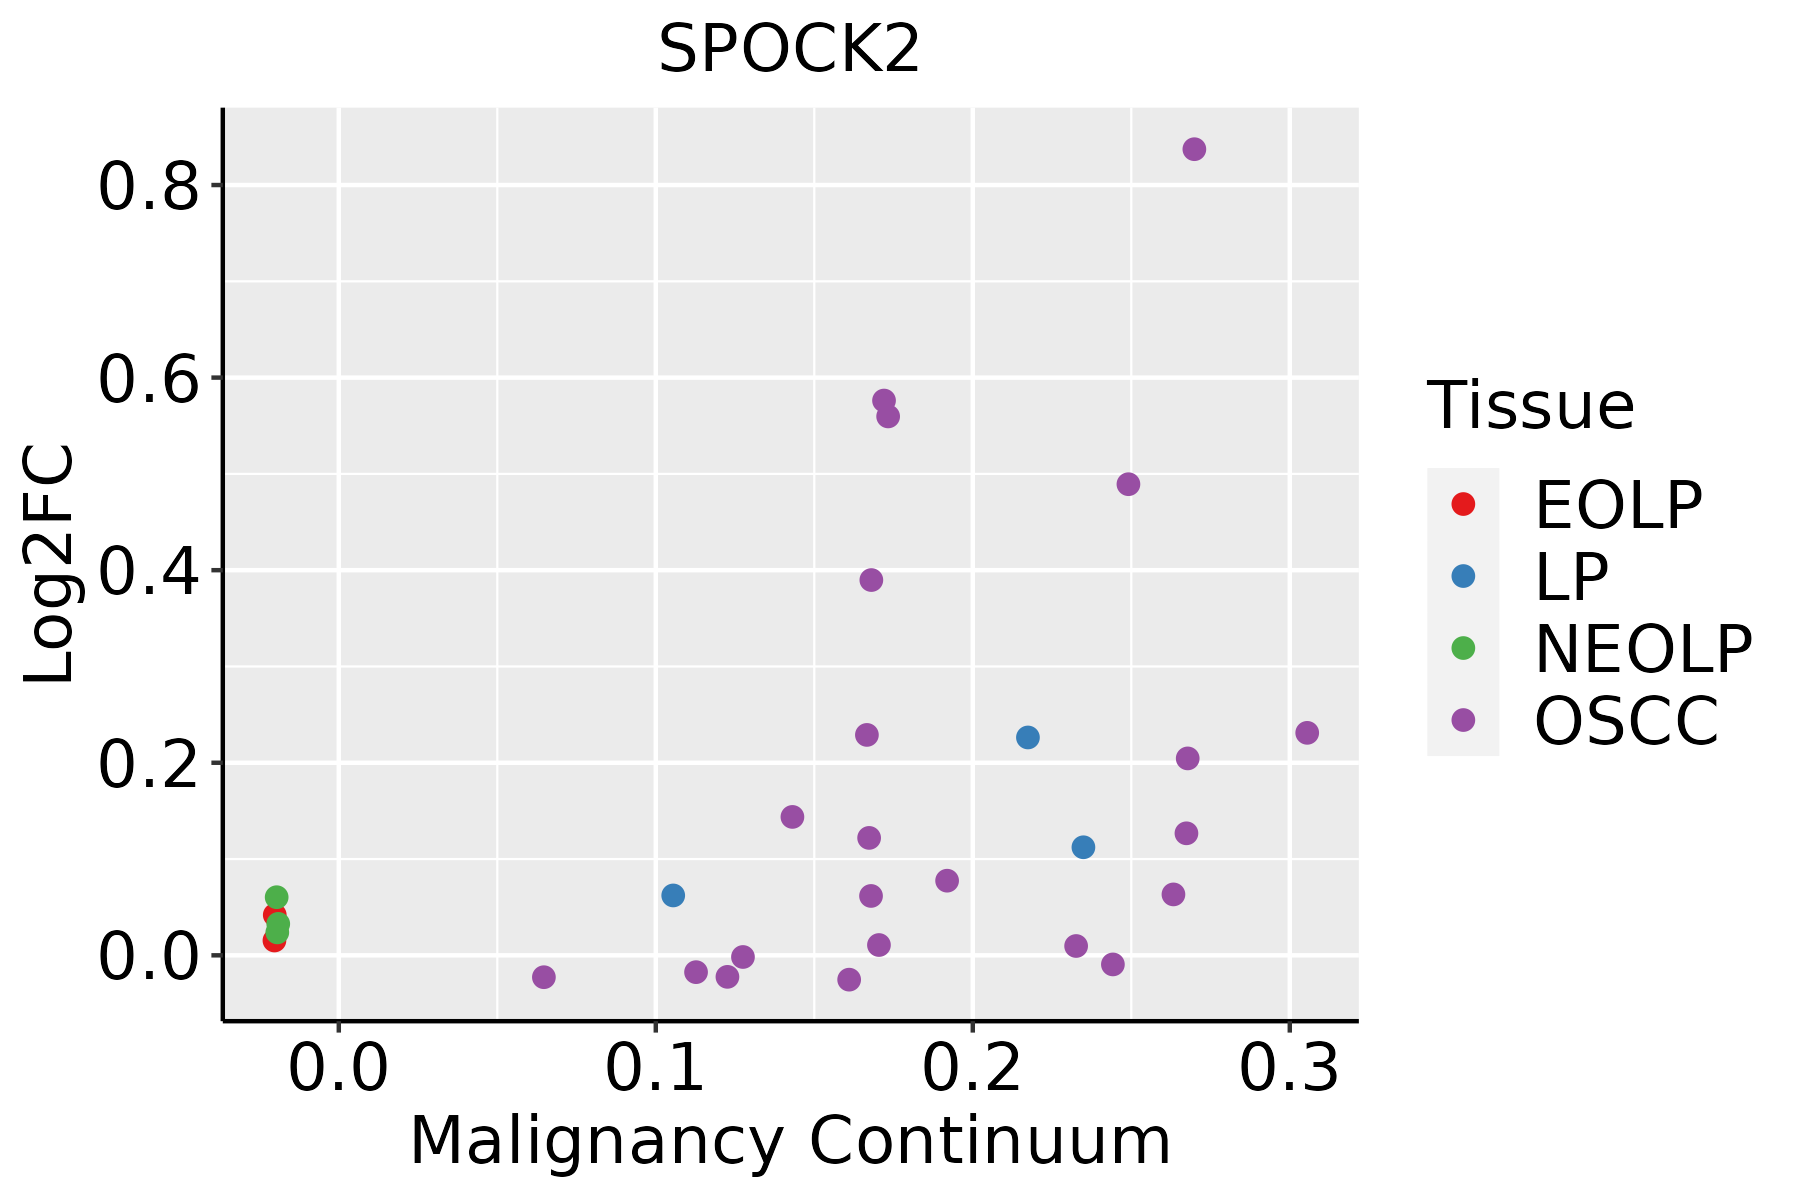 | EOLP: Erosive Oral lichen planus |
| LP: leukoplakia | ||
| NEOLP: Non-erosive oral lichen planus | ||
| OSCC: Oral squamous cell carcinoma | ||
| Thyroid | 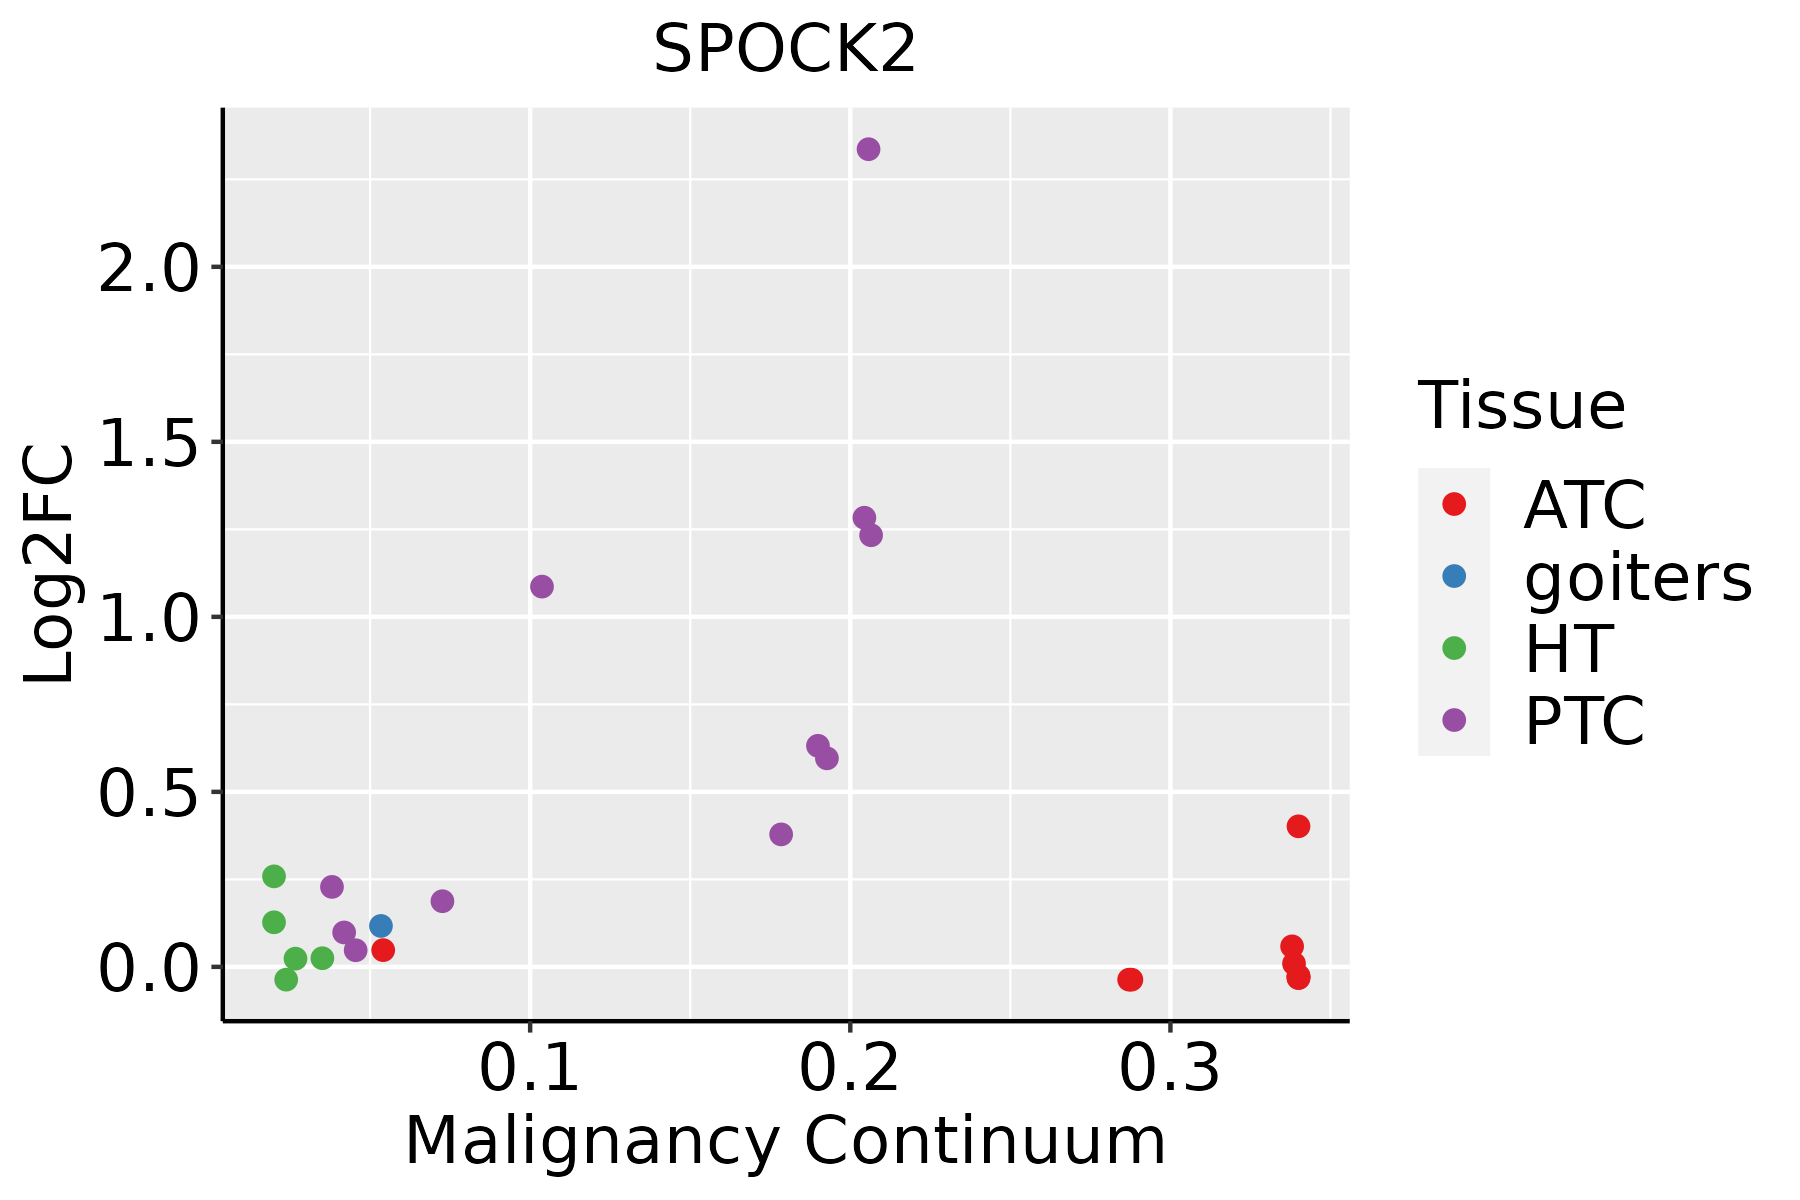 | ATC: Anaplastic thyroid cancer |
| HT: Hashimoto's thyroiditis | ||
| PTC: Papillary thyroid cancer |
| ∗log2FC in expression of this searched gene in stem-like cells from each diseased tissue sample relative to stem-like cells in normal samples in each tissue plotted against the malignancy continuum. Samples are colored based on if they are from different disease stage. |
Top |
Malignant transformation related pathway analysis |
| Find out the enriched GO biological processes and KEGG pathways involved in transition from healthy to precancer to cancer |
| Tissue | Disease Stage | Enriched GO biological Processes |
| Colorectum | AD |  |
| Colorectum | SER |  |
| Colorectum | MSS |  |
| Colorectum | MSI-H |  |
| Colorectum | FAP |  |
| ∗Top 15 enriched GO BP terms are showed in the bar plot of each disease state in each tissue. Each row represents a significant GO biological process which is colored according to the -log10(p.adjust). |
| Page: 1 2 3 4 5 6 7 8 9 |
| GO ID | Tissue | Disease Stage | Description | Gene Ratio | Bg Ratio | pvalue | p.adjust | Count |
| GO:005254726 | Esophagus | HGIN | regulation of peptidase activity | 102/2587 | 461/18723 | 6.29e-07 | 2.72e-05 | 102 |
| GO:005254826 | Esophagus | HGIN | regulation of endopeptidase activity | 96/2587 | 432/18723 | 1.09e-06 | 4.30e-05 | 96 |
| GO:004586126 | Esophagus | HGIN | negative regulation of proteolysis | 68/2587 | 351/18723 | 2.21e-03 | 2.28e-02 | 68 |
| GO:005134620 | Esophagus | HGIN | negative regulation of hydrolase activity | 72/2587 | 379/18723 | 2.81e-03 | 2.75e-02 | 72 |
| GO:19908308 | Esophagus | HGIN | cellular response to leukemia inhibitory factor | 23/2587 | 94/18723 | 3.92e-03 | 3.54e-02 | 23 |
| GO:19908238 | Esophagus | HGIN | response to leukemia inhibitory factor | 23/2587 | 95/18723 | 4.51e-03 | 3.93e-02 | 23 |
| GO:0052547111 | Esophagus | ESCC | regulation of peptidase activity | 275/8552 | 461/18723 | 7.54e-10 | 1.88e-08 | 275 |
| GO:003158919 | Esophagus | ESCC | cell-substrate adhesion | 221/8552 | 363/18723 | 3.06e-09 | 6.62e-08 | 221 |
| GO:001081020 | Esophagus | ESCC | regulation of cell-substrate adhesion | 144/8552 | 221/18723 | 3.55e-09 | 7.45e-08 | 144 |
| GO:0052548111 | Esophagus | ESCC | regulation of endopeptidase activity | 253/8552 | 432/18723 | 3.68e-08 | 6.78e-07 | 253 |
| GO:004578527 | Esophagus | ESCC | positive regulation of cell adhesion | 255/8552 | 437/18723 | 5.07e-08 | 9.11e-07 | 255 |
| GO:00091002 | Esophagus | ESCC | glycoprotein metabolic process | 226/8552 | 387/18723 | 2.64e-07 | 3.94e-06 | 226 |
| GO:00067906 | Esophagus | ESCC | sulfur compound metabolic process | 201/8552 | 339/18723 | 2.64e-07 | 3.94e-06 | 201 |
| GO:001081126 | Esophagus | ESCC | positive regulation of cell-substrate adhesion | 84/8552 | 123/18723 | 3.18e-07 | 4.50e-06 | 84 |
| GO:00182099 | Esophagus | ESCC | peptidyl-serine modification | 196/8552 | 338/18723 | 3.07e-06 | 3.47e-05 | 196 |
| GO:00301984 | Esophagus | ESCC | extracellular matrix organization | 171/8552 | 301/18723 | 6.08e-05 | 4.67e-04 | 171 |
| GO:00430624 | Esophagus | ESCC | extracellular structure organization | 171/8552 | 302/18723 | 7.73e-05 | 5.76e-04 | 171 |
| GO:00452294 | Esophagus | ESCC | external encapsulating structure organization | 172/8552 | 304/18723 | 7.80e-05 | 5.80e-04 | 172 |
| GO:0045861111 | Esophagus | ESCC | negative regulation of proteolysis | 195/8552 | 351/18723 | 1.13e-04 | 7.85e-04 | 195 |
| GO:0051346110 | Esophagus | ESCC | negative regulation of hydrolase activity | 208/8552 | 379/18723 | 1.76e-04 | 1.14e-03 | 208 |
| Page: 1 2 3 4 |
| Pathway ID | Tissue | Disease Stage | Description | Gene Ratio | Bg Ratio | pvalue | p.adjust | qvalue | Count |
| Page: 1 |
Top |
Cell-cell communication analysis |
| Identification of potential cell-cell interactions between two cell types and their ligand-receptor pairs for different disease states |
| Ligand | Receptor | LRpair | Pathway | Tissue | Disease Stage |
| Page: 1 |
Top |
Single-cell gene regulatory network inference analysis |
| Find out the significant the regulons (TFs) and the target genes of each regulon across cell types for different disease states |
| TF | Cell Type | Tissue | Disease Stage | Target Gene | RSS | Regulon Activity |
| ∗The dot plots of a searched regulon are shown for all cell subpopulations in each disease state of each tissue based on the regulon specific score inferred using pySCENIC and by calculating the average expression. |
| Page: 1 |
Top |
Somatic mutation of malignant transformation related genes |
| Annotation of somatic variants for genes involved in malignant transformation |
| Hugo Symbol | Variant Class | Variant Classification | dbSNP RS | HGVSc | HGVSp | HGVSp Short | SWISSPROT | BIOTYPE | SIFT | PolyPhen | Tumor Sample Barcode | Tissue | Histology | Sex | Age | Stage | Therapy Types | Drugs | Outcome |
| SPOCK2 | SNV | Missense_Mutation | c.707G>A | p.Ser236Asn | p.S236N | Q92563 | protein_coding | tolerated(0.11) | benign(0.011) | TCGA-BH-A18G-01 | Breast | breast invasive carcinoma | Female | >=65 | I/II | Unknown | Unknown | SD | |
| SPOCK2 | SNV | Missense_Mutation | novel | c.1246G>A | p.Glu416Lys | p.E416K | Q92563 | protein_coding | deleterious_low_confidence(0.02) | benign(0.251) | TCGA-EK-A3GK-01 | Cervix | cervical & endocervical cancer | Female | <65 | I/II | Unknown | Unknown | SD |
| SPOCK2 | SNV | Missense_Mutation | c.815N>T | p.Ala272Val | p.A272V | Q92563 | protein_coding | deleterious(0) | probably_damaging(0.998) | TCGA-AA-3492-01 | Colorectum | colon adenocarcinoma | Female | >=65 | I/II | Unknown | Unknown | SD | |
| SPOCK2 | SNV | Missense_Mutation | rs770205958 | c.628N>T | p.Arg210Trp | p.R210W | Q92563 | protein_coding | deleterious(0) | probably_damaging(1) | TCGA-AA-3845-01 | Colorectum | colon adenocarcinoma | Female | >=65 | I/II | Unknown | Unknown | PD |
| SPOCK2 | SNV | Missense_Mutation | c.335T>C | p.Ile112Thr | p.I112T | Q92563 | protein_coding | tolerated(0.15) | benign(0.395) | TCGA-AY-6197-01 | Colorectum | colon adenocarcinoma | Male | <65 | I/II | Unknown | Unknown | SD | |
| SPOCK2 | SNV | Missense_Mutation | novel | c.981G>T | p.Lys327Asn | p.K327N | Q92563 | protein_coding | deleterious(0) | probably_damaging(0.998) | TCGA-AZ-4315-01 | Colorectum | colon adenocarcinoma | Male | <65 | I/II | Unknown | Unknown | SD |
| SPOCK2 | SNV | Missense_Mutation | rs577728856 | c.341N>A | p.Arg114His | p.R114H | Q92563 | protein_coding | tolerated(0.35) | probably_damaging(0.996) | TCGA-EI-6917-01 | Colorectum | rectum adenocarcinoma | Male | <65 | III/IV | Chemotherapy | 5fluorouracil+oxaciplatina+l-folinian | SD |
| SPOCK2 | insertion | Frame_Shift_Ins | novel | c.936_937insC | p.Cys313LeufsTer37 | p.C313Lfs*37 | Q92563 | protein_coding | TCGA-AA-3492-01 | Colorectum | colon adenocarcinoma | Female | >=65 | I/II | Unknown | Unknown | SD | ||
| SPOCK2 | SNV | Missense_Mutation | novel | c.724N>A | p.Leu242Met | p.L242M | Q92563 | protein_coding | deleterious(0) | probably_damaging(0.974) | TCGA-A5-A1OF-01 | Endometrium | uterine corpus endometrioid carcinoma | Female | <65 | I/II | Unknown | Unknown | SD |
| SPOCK2 | SNV | Missense_Mutation | rs200859576 | c.1138G>A | p.Val380Met | p.V380M | Q92563 | protein_coding | tolerated(0.28) | benign(0.015) | TCGA-AJ-A3EJ-01 | Endometrium | uterine corpus endometrioid carcinoma | Female | >=65 | III/IV | Unknown | Unknown | PD |
| Page: 1 2 3 4 |
Top |
Related drugs of malignant transformation related genes |
| Identification of chemicals and drugs interact with genes involved in malignant transfromation |
| (DGIdb 4.0) |
| Entrez ID | Symbol | Category | Interaction Types | Drug Claim Name | Drug Name | PMIDs |
| Page: 1 |

Copyright 2023-Present -The University of Texas Health Science Center at Houston |