
|
|||||
|
 | |
| |
| |
| |
| |
| |
|
Gene: SPOCK1 |
Gene summary for SPOCK1 |
| Gene information | Species | Human | Gene symbol | SPOCK1 | Gene ID | 6695 |
| Gene name | SPARC (osteonectin), cwcv and kazal like domains proteoglycan 1 | |
| Gene Alias | SPOCK | |
| Cytomap | 5q31.2 | |
| Gene Type | protein-coding | GO ID | GO:0001558 | UniProtAcc | Q08629 |
Top |
Malignant transformation analysis |
| Identification of the aberrant gene expression in precancerous and cancerous lesions by comparing the gene expression of stem-like cells in diseased tissues with normal stem cells |
| Entrez ID | Symbol | Replicates | Species | Organ | Tissue | Adj P-value | Log2FC | Malignancy |
| 6695 | SPOCK1 | LZE4T | Human | Esophagus | ESCC | 5.92e-04 | 1.37e-01 | 0.0811 |
| 6695 | SPOCK1 | P2T-E | Human | Esophagus | ESCC | 4.59e-03 | 1.31e-01 | 0.1177 |
| 6695 | SPOCK1 | P4T-E | Human | Esophagus | ESCC | 7.49e-06 | 7.26e-02 | 0.1323 |
| 6695 | SPOCK1 | P8T-E | Human | Esophagus | ESCC | 6.15e-15 | 3.24e-01 | 0.0889 |
| 6695 | SPOCK1 | P9T-E | Human | Esophagus | ESCC | 3.35e-06 | 1.00e-01 | 0.1131 |
| 6695 | SPOCK1 | P10T-E | Human | Esophagus | ESCC | 1.67e-08 | 2.02e-01 | 0.116 |
| 6695 | SPOCK1 | P11T-E | Human | Esophagus | ESCC | 1.31e-05 | 2.51e-01 | 0.1426 |
| 6695 | SPOCK1 | P12T-E | Human | Esophagus | ESCC | 7.41e-64 | 1.67e+00 | 0.1122 |
| 6695 | SPOCK1 | P15T-E | Human | Esophagus | ESCC | 9.80e-14 | 4.98e-01 | 0.1149 |
| 6695 | SPOCK1 | P16T-E | Human | Esophagus | ESCC | 1.36e-04 | 1.24e-01 | 0.1153 |
| 6695 | SPOCK1 | P22T-E | Human | Esophagus | ESCC | 2.43e-03 | 1.42e-01 | 0.1236 |
| 6695 | SPOCK1 | P23T-E | Human | Esophagus | ESCC | 3.57e-02 | 1.19e-01 | 0.108 |
| 6695 | SPOCK1 | P26T-E | Human | Esophagus | ESCC | 2.72e-18 | 2.29e-01 | 0.1276 |
| 6695 | SPOCK1 | P28T-E | Human | Esophagus | ESCC | 7.22e-04 | 4.44e-02 | 0.1149 |
| 6695 | SPOCK1 | P32T-E | Human | Esophagus | ESCC | 5.37e-04 | 1.47e-01 | 0.1666 |
| 6695 | SPOCK1 | P37T-E | Human | Esophagus | ESCC | 1.69e-16 | 3.97e-01 | 0.1371 |
| 6695 | SPOCK1 | P48T-E | Human | Esophagus | ESCC | 2.06e-04 | 5.57e-02 | 0.0959 |
| 6695 | SPOCK1 | P52T-E | Human | Esophagus | ESCC | 2.81e-11 | 3.29e-01 | 0.1555 |
| 6695 | SPOCK1 | P54T-E | Human | Esophagus | ESCC | 2.58e-10 | 2.15e-01 | 0.0975 |
| 6695 | SPOCK1 | P61T-E | Human | Esophagus | ESCC | 3.04e-03 | 1.97e-01 | 0.099 |
| Page: 1 2 |
| Tissue | Expression Dynamics | Abbreviation |
| Esophagus | 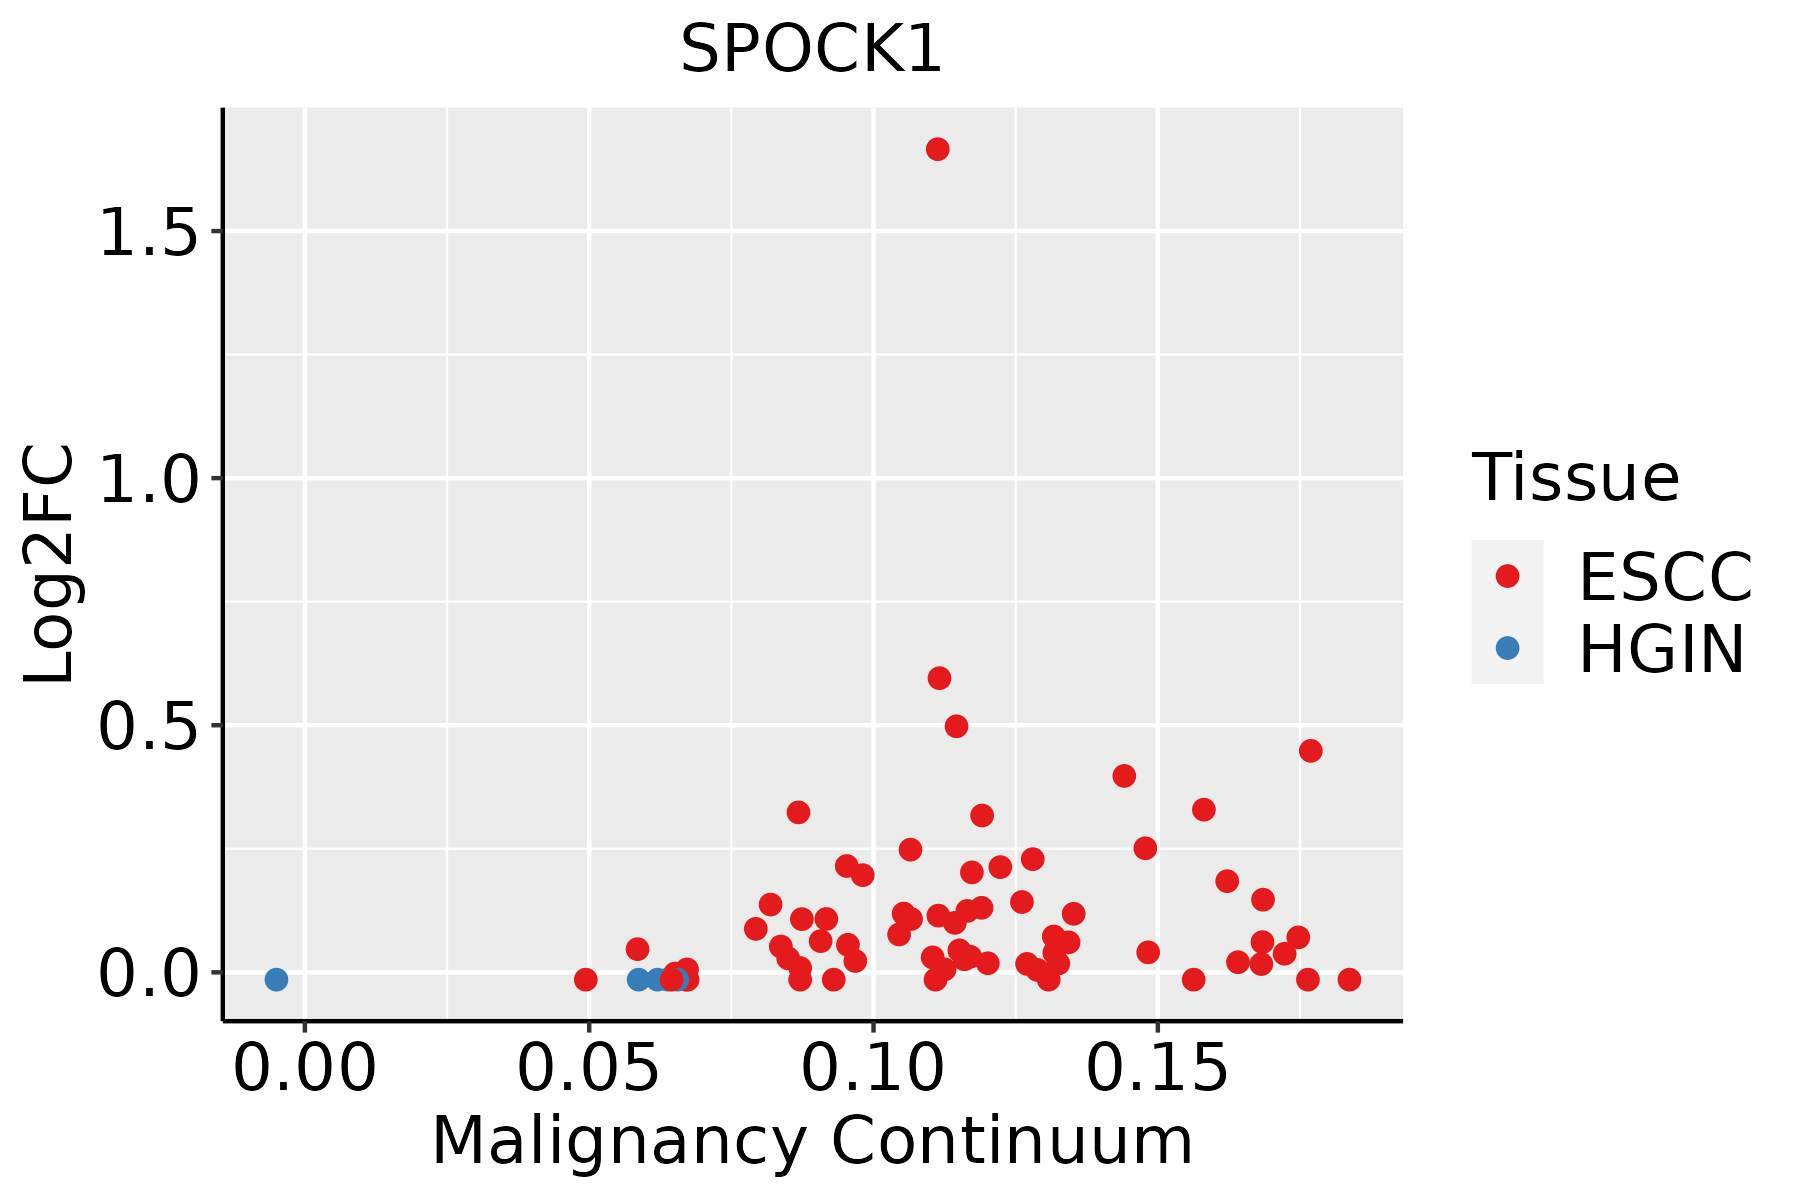 | ESCC: Esophageal squamous cell carcinoma |
| HGIN: High-grade intraepithelial neoplasias | ||
| LGIN: Low-grade intraepithelial neoplasias | ||
| Prostate | 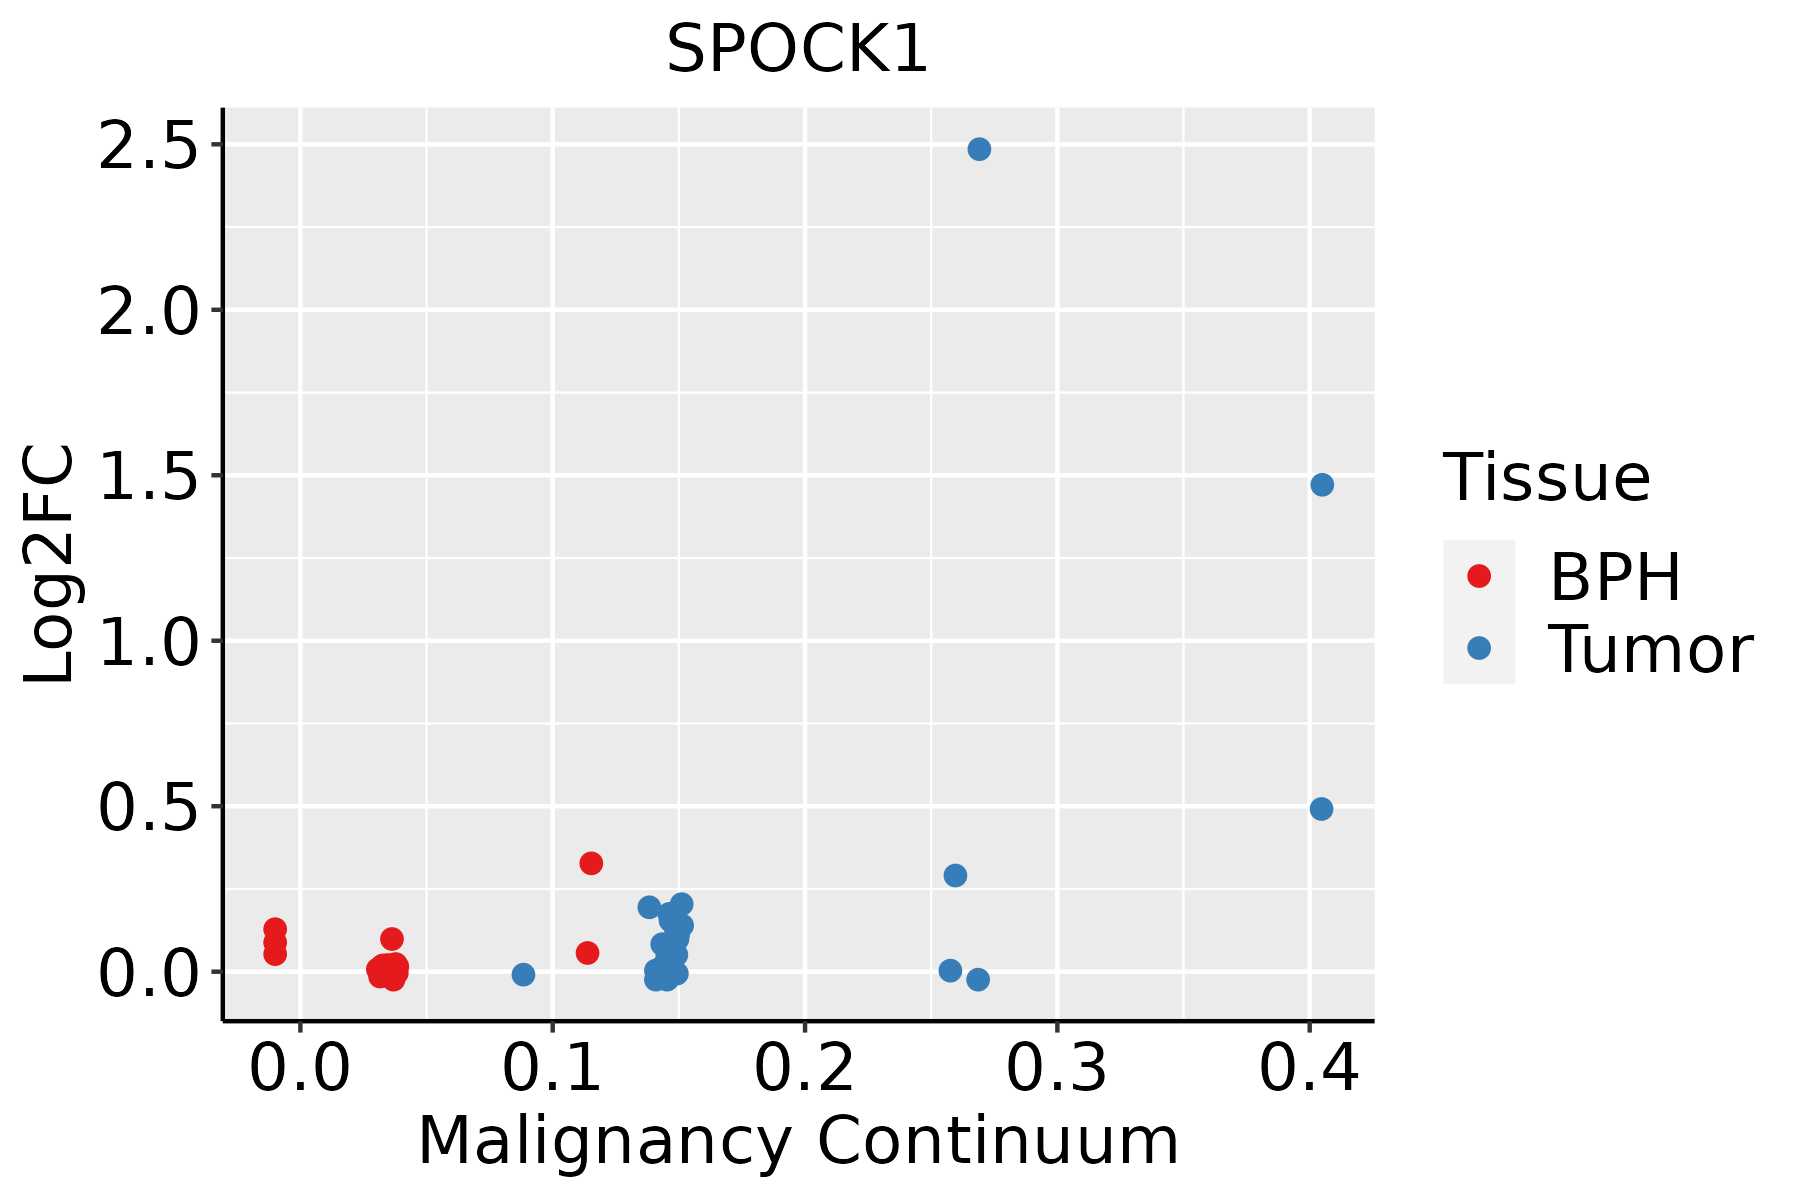 | BPH: Benign Prostatic Hyperplasia |
| Thyroid | 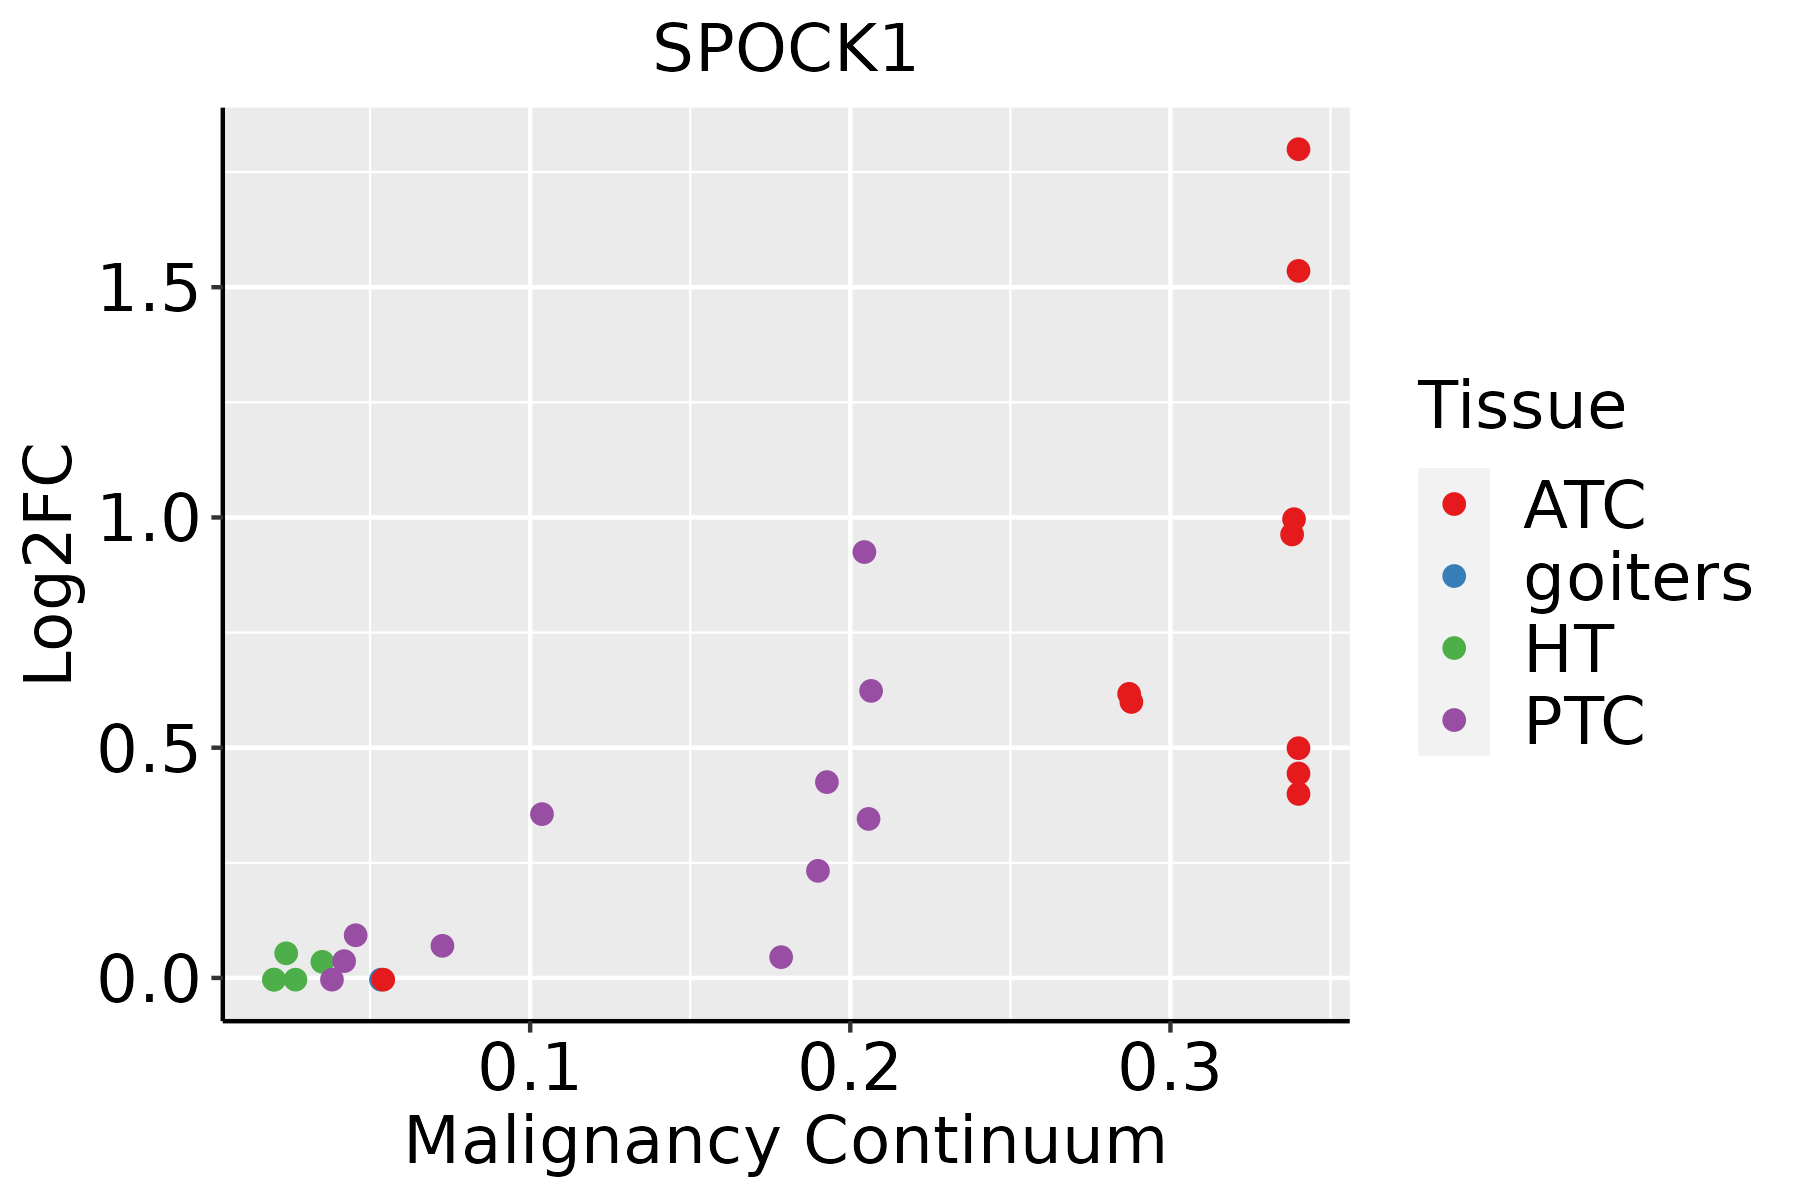 | ATC: Anaplastic thyroid cancer |
| HT: Hashimoto's thyroiditis | ||
| PTC: Papillary thyroid cancer |
| ∗log2FC in expression of this searched gene in stem-like cells from each diseased tissue sample relative to stem-like cells in normal samples in each tissue plotted against the malignancy continuum. Samples are colored based on if they are from different disease stage. |
Top |
Malignant transformation related pathway analysis |
| Find out the enriched GO biological processes and KEGG pathways involved in transition from healthy to precancer to cancer |
| Tissue | Disease Stage | Enriched GO biological Processes |
| Colorectum | AD |  |
| Colorectum | SER |  |
| Colorectum | MSS |  |
| Colorectum | MSI-H |  |
| Colorectum | FAP |  |
| ∗Top 15 enriched GO BP terms are showed in the bar plot of each disease state in each tissue. Each row represents a significant GO biological process which is colored according to the -log10(p.adjust). |
| Page: 1 2 3 4 5 6 7 8 9 |
| GO ID | Tissue | Disease Stage | Description | Gene Ratio | Bg Ratio | pvalue | p.adjust | Count |
| GO:0016049110 | Esophagus | ESCC | cell growth | 289/8552 | 482/18723 | 1.29e-10 | 3.77e-09 | 289 |
| GO:0052547111 | Esophagus | ESCC | regulation of peptidase activity | 275/8552 | 461/18723 | 7.54e-10 | 1.88e-08 | 275 |
| GO:000155819 | Esophagus | ESCC | regulation of cell growth | 248/8552 | 414/18723 | 2.97e-09 | 6.45e-08 | 248 |
| GO:003158919 | Esophagus | ESCC | cell-substrate adhesion | 221/8552 | 363/18723 | 3.06e-09 | 6.62e-08 | 221 |
| GO:001081020 | Esophagus | ESCC | regulation of cell-substrate adhesion | 144/8552 | 221/18723 | 3.55e-09 | 7.45e-08 | 144 |
| GO:0052548111 | Esophagus | ESCC | regulation of endopeptidase activity | 253/8552 | 432/18723 | 3.68e-08 | 6.78e-07 | 253 |
| GO:0045861111 | Esophagus | ESCC | negative regulation of proteolysis | 195/8552 | 351/18723 | 1.13e-04 | 7.85e-04 | 195 |
| GO:0051346110 | Esophagus | ESCC | negative regulation of hydrolase activity | 208/8552 | 379/18723 | 1.76e-04 | 1.14e-03 | 208 |
| GO:001097516 | Esophagus | ESCC | regulation of neuron projection development | 240/8552 | 445/18723 | 2.48e-04 | 1.53e-03 | 240 |
| GO:001046620 | Esophagus | ESCC | negative regulation of peptidase activity | 140/8552 | 262/18723 | 6.73e-03 | 2.46e-02 | 140 |
| GO:001095119 | Esophagus | ESCC | negative regulation of endopeptidase activity | 135/8552 | 252/18723 | 6.86e-03 | 2.51e-02 | 135 |
| GO:001604910 | Prostate | BPH | cell growth | 139/3107 | 482/18723 | 7.53e-12 | 5.90e-10 | 139 |
| GO:005254718 | Prostate | BPH | regulation of peptidase activity | 133/3107 | 461/18723 | 2.08e-11 | 1.43e-09 | 133 |
| GO:003158910 | Prostate | BPH | cell-substrate adhesion | 110/3107 | 363/18723 | 4.64e-11 | 2.96e-09 | 110 |
| GO:001081017 | Prostate | BPH | regulation of cell-substrate adhesion | 74/3107 | 221/18723 | 5.40e-10 | 2.70e-08 | 74 |
| GO:005254818 | Prostate | BPH | regulation of endopeptidase activity | 122/3107 | 432/18723 | 6.10e-10 | 2.91e-08 | 122 |
| GO:000155810 | Prostate | BPH | regulation of cell growth | 116/3107 | 414/18723 | 2.66e-09 | 1.05e-07 | 116 |
| GO:004586118 | Prostate | BPH | negative regulation of proteolysis | 98/3107 | 351/18723 | 5.43e-08 | 1.49e-06 | 98 |
| GO:00109759 | Prostate | BPH | regulation of neuron projection development | 118/3107 | 445/18723 | 5.85e-08 | 1.57e-06 | 118 |
| GO:00071628 | Prostate | BPH | negative regulation of cell adhesion | 82/3107 | 303/18723 | 2.51e-06 | 4.04e-05 | 82 |
| Page: 1 2 3 4 |
| Pathway ID | Tissue | Disease Stage | Description | Gene Ratio | Bg Ratio | pvalue | p.adjust | qvalue | Count |
| Page: 1 |
Top |
Cell-cell communication analysis |
| Identification of potential cell-cell interactions between two cell types and their ligand-receptor pairs for different disease states |
| Ligand | Receptor | LRpair | Pathway | Tissue | Disease Stage |
| Page: 1 |
Top |
Single-cell gene regulatory network inference analysis |
| Find out the significant the regulons (TFs) and the target genes of each regulon across cell types for different disease states |
| TF | Cell Type | Tissue | Disease Stage | Target Gene | RSS | Regulon Activity |
| ∗The dot plots of a searched regulon are shown for all cell subpopulations in each disease state of each tissue based on the regulon specific score inferred using pySCENIC and by calculating the average expression. |
| Page: 1 |
Top |
Somatic mutation of malignant transformation related genes |
| Annotation of somatic variants for genes involved in malignant transformation |
| Hugo Symbol | Variant Class | Variant Classification | dbSNP RS | HGVSc | HGVSp | HGVSp Short | SWISSPROT | BIOTYPE | SIFT | PolyPhen | Tumor Sample Barcode | Tissue | Histology | Sex | Age | Stage | Therapy Types | Drugs | Outcome |
| SPOCK1 | SNV | Missense_Mutation | c.590N>A | p.Ala197Asp | p.A197D | Q08629 | protein_coding | deleterious(0.04) | benign(0.123) | TCGA-A2-A25A-01 | Breast | breast invasive carcinoma | Female | <65 | I/II | Unspecific | Cytoxan | SD | |
| SPOCK1 | SNV | Missense_Mutation | novel | c.1121N>C | p.Val374Ala | p.V374A | Q08629 | protein_coding | tolerated(0.86) | benign(0.033) | TCGA-AN-A046-01 | Breast | breast invasive carcinoma | Female | >=65 | I/II | Unknown | Unknown | SD |
| SPOCK1 | SNV | Missense_Mutation | c.1265N>G | p.Glu422Gly | p.E422G | Q08629 | protein_coding | deleterious_low_confidence(0) | possibly_damaging(0.749) | TCGA-BH-A0HA-01 | Breast | breast invasive carcinoma | Female | <65 | I/II | Unknown | Unknown | SD | |
| SPOCK1 | SNV | Missense_Mutation | c.490N>G | p.His164Asp | p.H164D | Q08629 | protein_coding | deleterious(0) | possibly_damaging(0.503) | TCGA-C8-A27B-01 | Breast | breast invasive carcinoma | Female | <65 | I/II | Chemotherapy | 5-fluorouracil | CR | |
| SPOCK1 | insertion | In_Frame_Ins | novel | c.1021_1022insACACAAGTTTTGCACAAAATT | p.Gly341delinsAspThrSerPheAlaGlnAsnCys | p.G341delinsDTSFAQNC | Q08629 | protein_coding | TCGA-BH-A0B4-01 | Breast | breast invasive carcinoma | Male | >=65 | III/IV | Hormone Therapy | tamoxiphen | SD | ||
| SPOCK1 | SNV | Missense_Mutation | c.296N>T | p.Thr99Ile | p.T99I | Q08629 | protein_coding | deleterious(0.02) | benign(0.351) | TCGA-A6-5662-01 | Colorectum | colon adenocarcinoma | Male | <65 | I/II | Chemotherapy | oxaliplatin | PD | |
| SPOCK1 | SNV | Missense_Mutation | rs756110717 | c.625C>T | p.Arg209Trp | p.R209W | Q08629 | protein_coding | deleterious(0) | probably_damaging(0.998) | TCGA-A6-6782-01 | Colorectum | colon adenocarcinoma | Male | >=65 | I/II | Unknown | Unknown | SD |
| SPOCK1 | SNV | Missense_Mutation | novel | c.316N>A | p.Leu106Met | p.L106M | Q08629 | protein_coding | tolerated(0.85) | benign(0.003) | TCGA-AA-3877-01 | Colorectum | colon adenocarcinoma | Female | >=65 | I/II | Unknown | Unknown | SD |
| SPOCK1 | SNV | Missense_Mutation | rs201506391 | c.610C>T | p.Arg204Trp | p.R204W | Q08629 | protein_coding | deleterious(0.01) | probably_damaging(0.991) | TCGA-AD-6888-01 | Colorectum | colon adenocarcinoma | Male | >=65 | III/IV | Unknown | Unknown | PD |
| SPOCK1 | SNV | Missense_Mutation | c.598N>T | p.Asp200Tyr | p.D200Y | Q08629 | protein_coding | deleterious(0.02) | probably_damaging(0.999) | TCGA-AZ-4315-01 | Colorectum | colon adenocarcinoma | Male | <65 | I/II | Unknown | Unknown | SD |
| Page: 1 2 3 4 5 6 7 |
Top |
Related drugs of malignant transformation related genes |
| Identification of chemicals and drugs interact with genes involved in malignant transfromation |
| (DGIdb 4.0) |
| Entrez ID | Symbol | Category | Interaction Types | Drug Claim Name | Drug Name | PMIDs |
| Page: 1 |

Copyright 2023-Present -The University of Texas Health Science Center at Houston |