
|
|||||
|
 | |
| |
| |
| |
| |
| |
|
Gene: SPOCD1 |
Gene summary for SPOCD1 |
| Gene information | Species | Human | Gene symbol | SPOCD1 | Gene ID | 90853 |
| Gene name | SPOC domain containing 1 | |
| Gene Alias | PPP1R146 | |
| Cytomap | 1p35.2 | |
| Gene Type | protein-coding | GO ID | GO:0000003 | UniProtAcc | Q6ZMY3 |
Top |
Malignant transformation analysis |
| Identification of the aberrant gene expression in precancerous and cancerous lesions by comparing the gene expression of stem-like cells in diseased tissues with normal stem cells |
| Entrez ID | Symbol | Replicates | Species | Organ | Tissue | Adj P-value | Log2FC | Malignancy |
| 90853 | SPOCD1 | P4T-E | Human | Esophagus | ESCC | 2.20e-02 | 1.29e-01 | 0.1323 |
| 90853 | SPOCD1 | P24T-E | Human | Esophagus | ESCC | 7.90e-03 | 1.56e-01 | 0.1287 |
| 90853 | SPOCD1 | P32T-E | Human | Esophagus | ESCC | 1.76e-12 | 4.20e-01 | 0.1666 |
| 90853 | SPOCD1 | P37T-E | Human | Esophagus | ESCC | 1.24e-04 | 1.54e-01 | 0.1371 |
| 90853 | SPOCD1 | P47T-E | Human | Esophagus | ESCC | 9.53e-09 | 1.97e-01 | 0.1067 |
| 90853 | SPOCD1 | P61T-E | Human | Esophagus | ESCC | 5.99e-03 | 1.27e-01 | 0.099 |
| 90853 | SPOCD1 | P80T-E | Human | Esophagus | ESCC | 7.90e-04 | 3.32e-01 | 0.155 |
| 90853 | SPOCD1 | P89T-E | Human | Esophagus | ESCC | 3.35e-02 | 5.03e-01 | 0.1752 |
| 90853 | SPOCD1 | P91T-E | Human | Esophagus | ESCC | 9.39e-10 | 6.19e-01 | 0.1828 |
| 90853 | SPOCD1 | ATC09 | Human | Thyroid | ATC | 6.18e-03 | 1.75e-01 | 0.2871 |
| 90853 | SPOCD1 | ATC11 | Human | Thyroid | ATC | 5.35e-04 | 5.69e-01 | 0.3386 |
| 90853 | SPOCD1 | ATC1 | Human | Thyroid | ATC | 8.56e-03 | 1.88e-01 | 0.2878 |
| 90853 | SPOCD1 | ATC3 | Human | Thyroid | ATC | 3.03e-13 | 8.26e-01 | 0.338 |
| Page: 1 |
| Tissue | Expression Dynamics | Abbreviation |
| Esophagus |  | ESCC: Esophageal squamous cell carcinoma |
| HGIN: High-grade intraepithelial neoplasias | ||
| LGIN: Low-grade intraepithelial neoplasias | ||
| Thyroid | 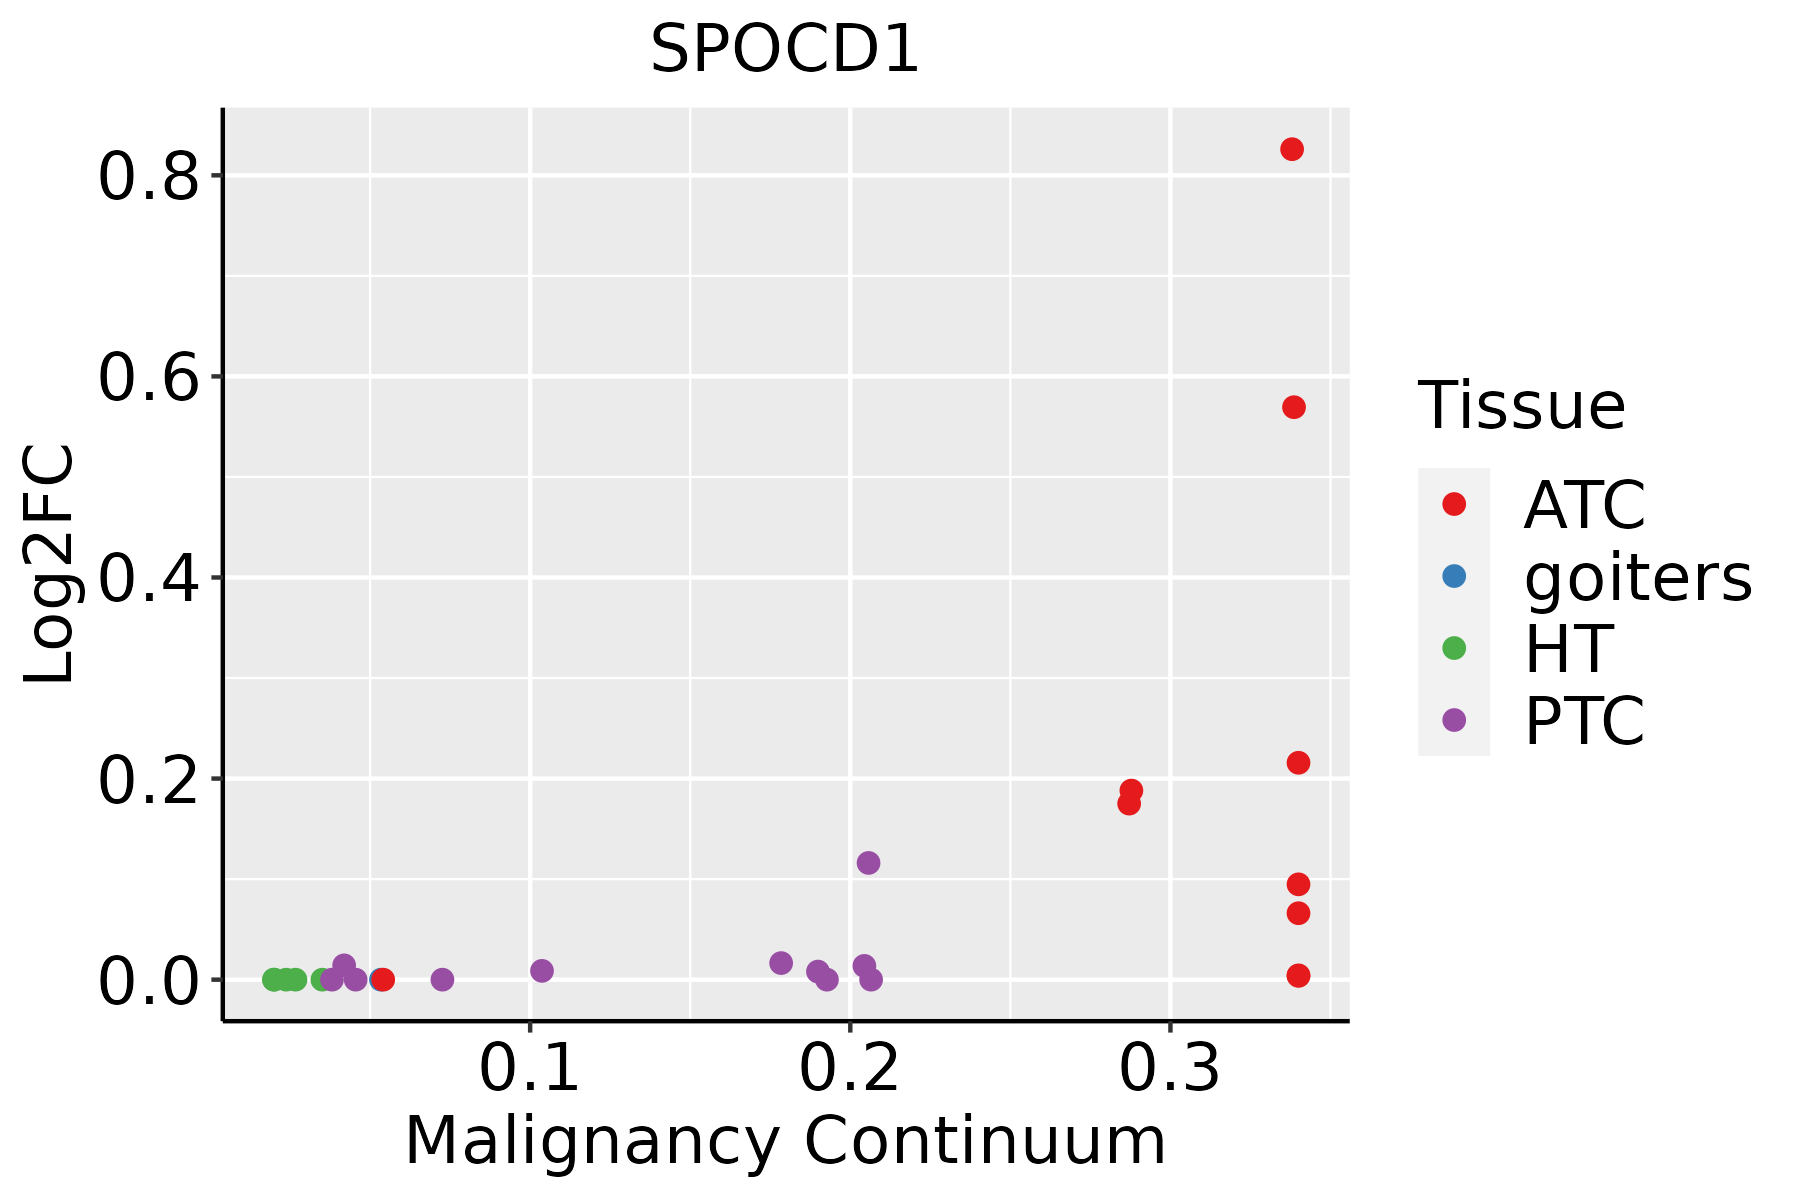 | ATC: Anaplastic thyroid cancer |
| HT: Hashimoto's thyroiditis | ||
| PTC: Papillary thyroid cancer |
| ∗log2FC in expression of this searched gene in stem-like cells from each diseased tissue sample relative to stem-like cells in normal samples in each tissue plotted against the malignancy continuum. Samples are colored based on if they are from different disease stage. |
Top |
Malignant transformation related pathway analysis |
| Find out the enriched GO biological processes and KEGG pathways involved in transition from healthy to precancer to cancer |
| Tissue | Disease Stage | Enriched GO biological Processes |
| Colorectum | AD |  |
| Colorectum | SER |  |
| Colorectum | MSS |  |
| Colorectum | MSI-H |  |
| Colorectum | FAP |  |
| ∗Top 15 enriched GO BP terms are showed in the bar plot of each disease state in each tissue. Each row represents a significant GO biological process which is colored according to the -log10(p.adjust). |
| Page: 1 2 3 4 5 6 7 8 9 |
| GO ID | Tissue | Disease Stage | Description | Gene Ratio | Bg Ratio | pvalue | p.adjust | Count |
| GO:00434143 | Esophagus | ESCC | macromolecule methylation | 199/8552 | 316/18723 | 3.44e-10 | 9.57e-09 | 199 |
| GO:00322592 | Esophagus | ESCC | methylation | 222/8552 | 364/18723 | 2.26e-09 | 5.09e-08 | 222 |
| GO:0006304 | Esophagus | ESCC | DNA modification | 68/8552 | 120/18723 | 9.95e-03 | 3.42e-02 | 68 |
| GO:004341412 | Thyroid | ATC | macromolecule methylation | 131/6293 | 316/18723 | 2.01e-03 | 9.60e-03 | 131 |
| GO:003225911 | Thyroid | ATC | methylation | 148/6293 | 364/18723 | 2.69e-03 | 1.23e-02 | 148 |
| Page: 1 |
| Pathway ID | Tissue | Disease Stage | Description | Gene Ratio | Bg Ratio | pvalue | p.adjust | qvalue | Count |
| Page: 1 |
Top |
Cell-cell communication analysis |
| Identification of potential cell-cell interactions between two cell types and their ligand-receptor pairs for different disease states |
| Ligand | Receptor | LRpair | Pathway | Tissue | Disease Stage |
| Page: 1 |
Top |
Single-cell gene regulatory network inference analysis |
| Find out the significant the regulons (TFs) and the target genes of each regulon across cell types for different disease states |
| TF | Cell Type | Tissue | Disease Stage | Target Gene | RSS | Regulon Activity |
| ∗The dot plots of a searched regulon are shown for all cell subpopulations in each disease state of each tissue based on the regulon specific score inferred using pySCENIC and by calculating the average expression. |
| Page: 1 |
Top |
Somatic mutation of malignant transformation related genes |
| Annotation of somatic variants for genes involved in malignant transformation |
| Hugo Symbol | Variant Class | Variant Classification | dbSNP RS | HGVSc | HGVSp | HGVSp Short | SWISSPROT | BIOTYPE | SIFT | PolyPhen | Tumor Sample Barcode | Tissue | Histology | Sex | Age | Stage | Therapy Types | Drugs | Outcome |
| SPOCD1 | SNV | Missense_Mutation | c.1229N>T | p.Ser410Leu | p.S410L | Q6ZMY3 | protein_coding | deleterious(0.02) | benign(0.067) | TCGA-BH-A0B4-01 | Breast | breast invasive carcinoma | Male | >=65 | III/IV | Hormone Therapy | tamoxiphen | SD | |
| SPOCD1 | SNV | Missense_Mutation | rs754159686 | c.3542N>A | p.Arg1181His | p.R1181H | Q6ZMY3 | protein_coding | tolerated(0.57) | benign(0) | TCGA-BH-A0B7-01 | Breast | breast invasive carcinoma | Female | <65 | I/II | Chemotherapy | adriamycin | CR |
| SPOCD1 | SNV | Missense_Mutation | c.1361G>T | p.Ser454Ile | p.S454I | Q6ZMY3 | protein_coding | deleterious(0.02) | possibly_damaging(0.863) | TCGA-E2-A1L7-01 | Breast | breast invasive carcinoma | Female | <65 | III/IV | Chemotherapy | cyclophosphamide | PD | |
| SPOCD1 | insertion | In_Frame_Ins | novel | c.944_945insTTTACC | p.Leu315_Ser316insLeuPro | p.L315_S316insLP | Q6ZMY3 | protein_coding | TCGA-A8-A09D-01 | Breast | breast invasive carcinoma | Female | <65 | I/II | Chemotherapy | doxorubicin | CR | ||
| SPOCD1 | SNV | Missense_Mutation | novel | c.1364C>A | p.Pro455Gln | p.P455Q | Q6ZMY3 | protein_coding | tolerated(0.12) | benign(0.093) | TCGA-C5-A3HD-01 | Cervix | cervical & endocervical cancer | Female | <65 | I/II | Chemotherapy | cisplatin | SD |
| SPOCD1 | SNV | Missense_Mutation | novel | c.3100C>G | p.Gln1034Glu | p.Q1034E | Q6ZMY3 | protein_coding | tolerated(0.07) | benign(0.062) | TCGA-C5-A8YR-01 | Cervix | cervical & endocervical cancer | Female | <65 | I/II | Unknown | Unknown | PD |
| SPOCD1 | SNV | Missense_Mutation | c.2466C>A | p.Ser822Arg | p.S822R | Q6ZMY3 | protein_coding | deleterious(0.02) | possibly_damaging(0.852) | TCGA-FU-A3HZ-01 | Cervix | cervical & endocervical cancer | Female | <65 | I/II | Chemotherapy | cisplatin | CR | |
| SPOCD1 | SNV | Missense_Mutation | c.3105N>T | p.Lys1035Asn | p.K1035N | Q6ZMY3 | protein_coding | deleterious(0) | probably_damaging(0.984) | TCGA-A6-6141-01 | Colorectum | colon adenocarcinoma | Male | <65 | I/II | Chemotherapy | 5-fu | SD | |
| SPOCD1 | SNV | Missense_Mutation | rs748892059 | c.2276N>T | p.Pro759Leu | p.P759L | Q6ZMY3 | protein_coding | tolerated(0.05) | possibly_damaging(0.493) | TCGA-AA-3666-01 | Colorectum | colon adenocarcinoma | Male | >=65 | III/IV | Unknown | Unknown | PD |
| SPOCD1 | SNV | Missense_Mutation | novel | c.3413A>G | p.His1138Arg | p.H1138R | Q6ZMY3 | protein_coding | deleterious(0.03) | benign(0.024) | TCGA-AA-3949-01 | Colorectum | colon adenocarcinoma | Female | >=65 | III/IV | Unknown | Unknown | SD |
| Page: 1 2 3 4 5 6 7 8 9 10 11 |
Top |
Related drugs of malignant transformation related genes |
| Identification of chemicals and drugs interact with genes involved in malignant transfromation |
| (DGIdb 4.0) |
| Entrez ID | Symbol | Category | Interaction Types | Drug Claim Name | Drug Name | PMIDs |
| Page: 1 |

Copyright 2023-Present -The University of Texas Health Science Center at Houston |