
|
|||||
|
 | |
| |
| |
| |
| |
| |
|
Gene: SPNS2 |
Gene summary for SPNS2 |
| Gene information | Species | Human | Gene symbol | SPNS2 | Gene ID | 124976 |
| Gene name | sphingolipid transporter 2 | |
| Gene Alias | DFNB115 | |
| Cytomap | 17p13.2 | |
| Gene Type | protein-coding | GO ID | GO:0001501 | UniProtAcc | Q8IVW8 |
Top |
Malignant transformation analysis |
| Identification of the aberrant gene expression in precancerous and cancerous lesions by comparing the gene expression of stem-like cells in diseased tissues with normal stem cells |
| Entrez ID | Symbol | Replicates | Species | Organ | Tissue | Adj P-value | Log2FC | Malignancy |
| 124976 | SPNS2 | LZE24T | Human | Esophagus | ESCC | 2.65e-05 | 2.60e-01 | 0.0596 |
| 124976 | SPNS2 | P1T-E | Human | Esophagus | ESCC | 1.64e-05 | 4.89e-01 | 0.0875 |
| 124976 | SPNS2 | P39T-E | Human | Esophagus | ESCC | 8.84e-05 | 2.07e-01 | 0.0894 |
| 124976 | SPNS2 | P75T-E | Human | Esophagus | ESCC | 4.41e-07 | 1.72e-01 | 0.1125 |
| 124976 | SPNS2 | P82T-E | Human | Esophagus | ESCC | 5.97e-09 | 6.44e-01 | 0.1072 |
| 124976 | SPNS2 | P84T-E | Human | Esophagus | ESCC | 1.67e-05 | 6.32e-01 | 0.0933 |
| 124976 | SPNS2 | P127T-E | Human | Esophagus | ESCC | 3.79e-05 | 1.80e-01 | 0.0826 |
| Page: 1 |
| Tissue | Expression Dynamics | Abbreviation |
| Esophagus | 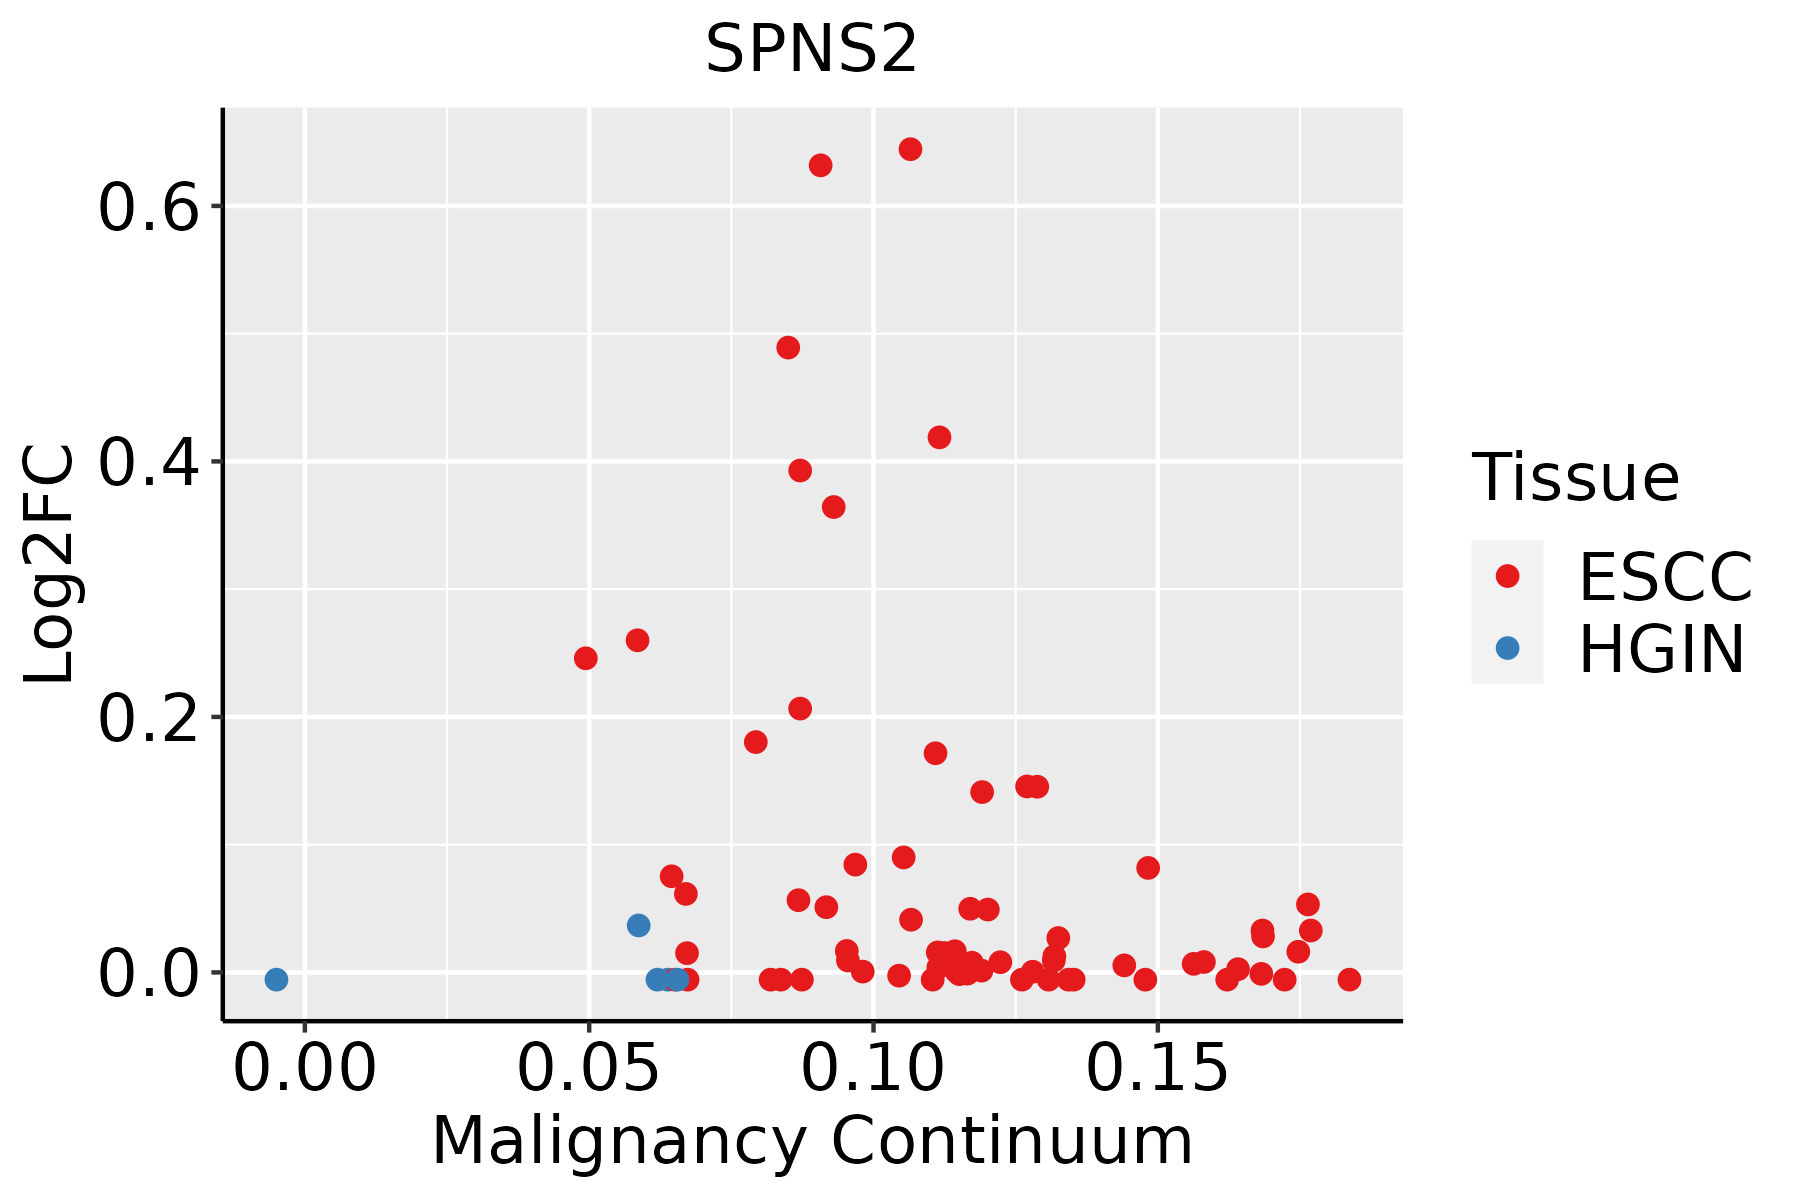 | ESCC: Esophageal squamous cell carcinoma |
| HGIN: High-grade intraepithelial neoplasias | ||
| LGIN: Low-grade intraepithelial neoplasias |
| ∗log2FC in expression of this searched gene in stem-like cells from each diseased tissue sample relative to stem-like cells in normal samples in each tissue plotted against the malignancy continuum. Samples are colored based on if they are from different disease stage. |
Top |
Malignant transformation related pathway analysis |
| Find out the enriched GO biological processes and KEGG pathways involved in transition from healthy to precancer to cancer |
| Tissue | Disease Stage | Enriched GO biological Processes |
| Colorectum | AD |  |
| Colorectum | SER |  |
| Colorectum | MSS |  |
| Colorectum | MSI-H |  |
| Colorectum | FAP |  |
| ∗Top 15 enriched GO BP terms are showed in the bar plot of each disease state in each tissue. Each row represents a significant GO biological process which is colored according to the -log10(p.adjust). |
| Page: 1 2 3 4 5 6 7 8 9 |
| GO ID | Tissue | Disease Stage | Description | Gene Ratio | Bg Ratio | pvalue | p.adjust | Count |
| GO:00066433 | Esophagus | ESCC | membrane lipid metabolic process | 130/8552 | 203/18723 | 9.29e-08 | 1.54e-06 | 130 |
| GO:0048872111 | Esophagus | ESCC | homeostasis of number of cells | 163/8552 | 272/18723 | 1.40e-06 | 1.69e-05 | 163 |
| GO:00464673 | Esophagus | ESCC | membrane lipid biosynthetic process | 91/8552 | 142/18723 | 7.19e-06 | 7.19e-05 | 91 |
| GO:00066652 | Esophagus | ESCC | sphingolipid metabolic process | 96/8552 | 155/18723 | 3.21e-05 | 2.66e-04 | 96 |
| GO:00603485 | Esophagus | ESCC | bone development | 115/8552 | 205/18723 | 1.67e-03 | 7.72e-03 | 115 |
| GO:00301481 | Esophagus | ESCC | sphingolipid biosynthetic process | 62/8552 | 103/18723 | 2.10e-03 | 9.38e-03 | 62 |
| GO:00434731 | Esophagus | ESCC | pigmentation | 59/8552 | 98/18723 | 2.64e-03 | 1.12e-02 | 59 |
| Page: 1 |
| Pathway ID | Tissue | Disease Stage | Description | Gene Ratio | Bg Ratio | pvalue | p.adjust | qvalue | Count |
| Page: 1 |
Top |
Cell-cell communication analysis |
| Identification of potential cell-cell interactions between two cell types and their ligand-receptor pairs for different disease states |
| Ligand | Receptor | LRpair | Pathway | Tissue | Disease Stage |
| Page: 1 |
Top |
Single-cell gene regulatory network inference analysis |
| Find out the significant the regulons (TFs) and the target genes of each regulon across cell types for different disease states |
| TF | Cell Type | Tissue | Disease Stage | Target Gene | RSS | Regulon Activity |
| ∗The dot plots of a searched regulon are shown for all cell subpopulations in each disease state of each tissue based on the regulon specific score inferred using pySCENIC and by calculating the average expression. |
| Page: 1 |
Top |
Somatic mutation of malignant transformation related genes |
| Annotation of somatic variants for genes involved in malignant transformation |
| Hugo Symbol | Variant Class | Variant Classification | dbSNP RS | HGVSc | HGVSp | HGVSp Short | SWISSPROT | BIOTYPE | SIFT | PolyPhen | Tumor Sample Barcode | Tissue | Histology | Sex | Age | Stage | Therapy Types | Drugs | Outcome |
| SPNS2 | SNV | Missense_Mutation | rs759366061 | c.769N>A | p.Gly257Arg | p.G257R | Q8IVW8 | protein_coding | deleterious(0.01) | probably_damaging(0.97) | TCGA-AO-A128-01 | Breast | breast invasive carcinoma | Female | <65 | I/II | Chemotherapy | doxorubicin | SD |
| SPNS2 | SNV | Missense_Mutation | rs747757809 | c.679C>T | p.Arg227Cys | p.R227C | Q8IVW8 | protein_coding | deleterious(0) | probably_damaging(1) | TCGA-D8-A1XK-01 | Breast | breast invasive carcinoma | Female | <65 | I/II | Chemotherapy | doxorubicine+cyclophosphamide | SD |
| SPNS2 | SNV | Missense_Mutation | c.1342N>T | p.Met448Leu | p.M448L | Q8IVW8 | protein_coding | tolerated(1) | benign(0.007) | TCGA-EK-A2PG-01 | Cervix | cervical & endocervical cancer | Female | >=65 | I/II | Unknown | Unknown | SD | |
| SPNS2 | SNV | Missense_Mutation | c.1095N>G | p.Ile365Met | p.I365M | Q8IVW8 | protein_coding | deleterious(0.01) | possibly_damaging(0.716) | TCGA-R2-A69V-01 | Cervix | cervical & endocervical cancer | Female | <65 | I/II | Chemotherapy | cisplatin | SD | |
| SPNS2 | insertion | Frame_Shift_Ins | novel | c.1525_1526insT | p.Pro509LeufsTer26 | p.P509Lfs*26 | Q8IVW8 | protein_coding | TCGA-DS-A1OB-01 | Cervix | cervical & endocervical cancer | Female | <65 | I/II | Chemotherapy | carboplatin | PD | ||
| SPNS2 | insertion | Frame_Shift_Ins | novel | c.1527_1528insCCAGCGCGGCTCCTGCTCCA | p.Phe510ProfsTer35 | p.F510Pfs*35 | Q8IVW8 | protein_coding | TCGA-DS-A1OB-01 | Cervix | cervical & endocervical cancer | Female | <65 | I/II | Chemotherapy | carboplatin | PD | ||
| SPNS2 | SNV | Missense_Mutation | c.857N>A | p.Arg286Lys | p.R286K | Q8IVW8 | protein_coding | deleterious(0.01) | probably_damaging(0.977) | TCGA-AA-3519-01 | Colorectum | colon adenocarcinoma | Male | <65 | III/IV | Unknown | Unknown | SD | |
| SPNS2 | SNV | Missense_Mutation | novel | c.1546G>A | p.Gly516Ser | p.G516S | Q8IVW8 | protein_coding | deleterious(0.04) | possibly_damaging(0.67) | TCGA-AA-3949-01 | Colorectum | colon adenocarcinoma | Female | >=65 | III/IV | Unknown | Unknown | SD |
| SPNS2 | SNV | Missense_Mutation | rs202089427 | c.677C>T | p.Thr226Met | p.T226M | Q8IVW8 | protein_coding | tolerated(0.23) | benign(0.112) | TCGA-AA-A010-01 | Colorectum | colon adenocarcinoma | Female | <65 | I/II | Chemotherapy | folinic | CR |
| SPNS2 | SNV | Missense_Mutation | novel | c.1391G>A | p.Ser464Asn | p.S464N | Q8IVW8 | protein_coding | deleterious(0) | benign(0.105) | TCGA-AA-A010-01 | Colorectum | colon adenocarcinoma | Female | <65 | I/II | Chemotherapy | folinic | CR |
| Page: 1 2 3 4 5 |
Top |
Related drugs of malignant transformation related genes |
| Identification of chemicals and drugs interact with genes involved in malignant transfromation |
| (DGIdb 4.0) |
| Entrez ID | Symbol | Category | Interaction Types | Drug Claim Name | Drug Name | PMIDs |
| Page: 1 |

Copyright 2023-Present -The University of Texas Health Science Center at Houston |